Abstract
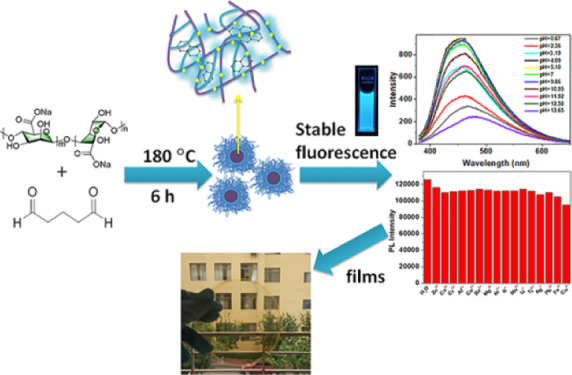
In recent years, as a new type of carbon dots, carbonized polymer dots (CPDs) have attracted more and more attention in many fields. In this experiment, a new kind of CPDs was synthesized by the hydrothermal treatment of the chemically cross-linked sodium alginate (SA) via glutaraldehyde. The fluorescence of CPDs was greatly enhanced because of the cross-linking enhanced emission effect. The formation process of CPDs at different reaction temperatures was explored. In addition, it was found that CPDs have stable fluorescence properties in mild acidic/basic and metal-ion environments. The in vitro toxicity of CPDs was tested, and based on their nontoxic property, SA films with anti-ultraviolet aging properties were prepared by using CPDs as the additive.
1. Introduction
As a new type of fluorescent material, carbon dots (CDs), a kind of carbon-based nanomaterial, have attracted people’s attention in recent years.1−3 Among various types of CDs, carbonized polymer dots (CPDs) are arising as a new kind of CDs, which have a large number of functional groups and polymer chains on the surface and can be seen as a transition material between polymer and fully carbonized CDs.4−6 A plenty of collectively called CDs prepared by linear polymers or monomers through condensation polymerization, assembly, or slightly carbonization process can be classified as CPDs.7 At present, CPDs have a wide range of raw materials, rich varieties, and low prices, including organic small molecules, polymers, and even biomass such as fruits, vegetables, plants, and so on.8−10
Among the various raw resources to prepare CPDs, sodium alginate (SA) has its unique advantages. SA is a natural linear polysaccharide extracted from seaweeds, which has many excellent properties, such as abundant sources, renewability, biodegradation, and good biocompatibility.11−13 The molecular structure of SA is composed of two glucose units, α-l-mannuronic acid and β-d-guluronic acid.14 The abundant hydroxyl and carboxyl groups on the chains can be easily chemically modified and can also serve as potential subfluorophores and active sites, making them an excellent candidate for the preparation of high-performance CPDs.
Until now, several kinds of CPDs with SA as a raw material have been reported through a hydrothermal or microwave treatment. Ethylenediamine, chitosan, or other N-containing compounds were incorporated in most of the research studies to ensure an N-doped structure of CPDs to enhance its fluorescent performance.15 Yu et al. prepared cationic CPDs by the hydrothermal reaction of SA and hydrogen peroxide.16 Choi et al. used SA and chitosan as raw materials to obtain CPDs by microwave treatment.17 Fong et al. prepared CPDs from SA nanoparticles preformed in the acid solvent in order to skip the surface passivation process.18 However, it still lacks research that makes full use of the intrinsic properties of SA to precisely control the structure and enhance the fluorescent property of CPDs.
Recently, Yang et al. put forward the cross-linking enhanced emission (CEE) effect as a particular mechanism that attributes to the photoluminescence (PL) of CPDs, which refers to the fact that cross-linked structures (chemical or physical cross-linking) of CPDs can restrain the vibration and rotation of the subfluorophores and as a result decrease the nonradiation vibration, reduce the energy loss in the excited state, and finally enhance the fluorescence. On this basis, here we presented the preparation of CPDs (named as SG-CPDs) with a controlled structure through the hydrothermal reaction of SA and glutaraldehyde, which served as the cross-linking agent for SA through the acetalation of hydroxyl and aldehyde groups. Structures and fluorescence properties of as-prepared CPDs were characterized and the course of reaction was looked through. The effect of cross-linking was also investigated. Benefitting from the preserved surface properties of SA, CPDs showed more stable fluorescence in a broad pH range and ionic environments than those prepared from other resources. Moreover, the in vitro cytotoxicity of CPDs was tested, and then CPDs were used as the anti-ultraviolet aging additive for SA films.
2. Results and Discussion
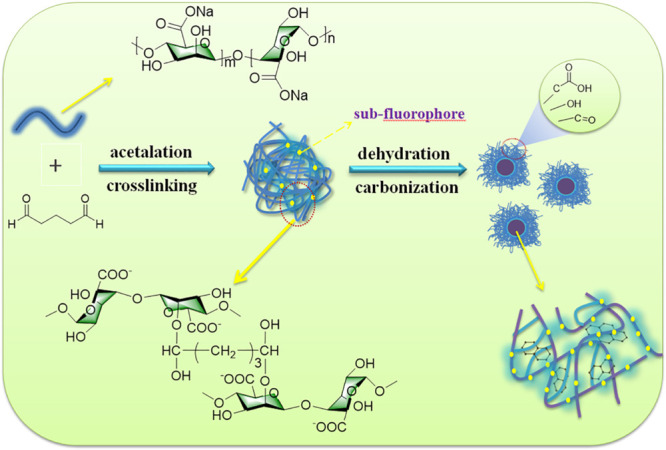
The preparation procedure for SG-CPDs is illustrated in Scheme 1. SA reacted with glutaraldehyde through the acetalation of hydroxy and aldehyde groups, so the cross-linking frames of SA chains were obtained, partially fixing the subfluorophores (C=O, C–O) of the SA chains. Then, dehydration and carbonization of SA cross-linking frames occurred to form more compact CPD structures with small amounts of carbonized clusters during the hydrothermal process, and at the same time, the subfluorophores were further fixed in CPDs during carbonization, providing the enhancement of fluorescence.
Scheme 1. Schematic for the Preparation of SG-CPDs.
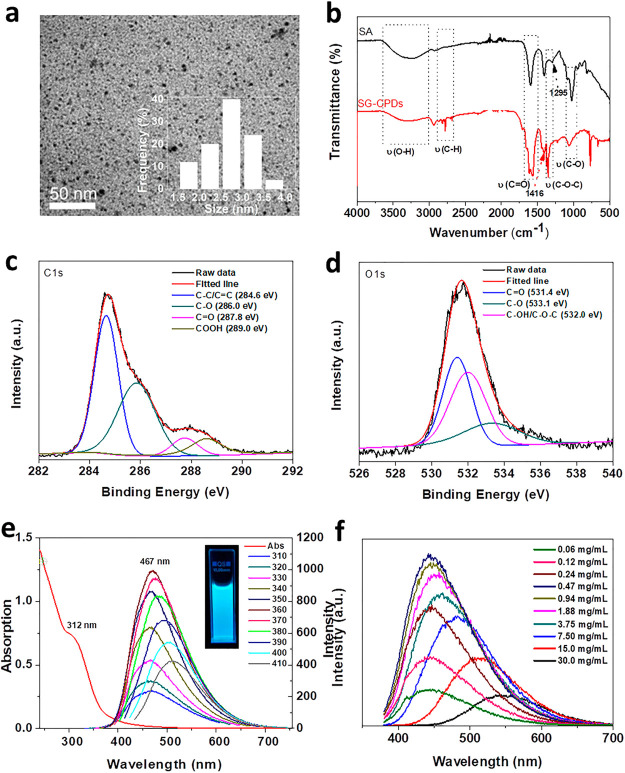
The transmission electron microscopy (TEM) image of Figure 1a showed that the as-prepared SG-CPDs at 180 °C had a spherical morphology and narrow size distribution with an average diameter of 2–5 nm. The chemical structure was then explored by a Fourier transform infrared spectrometer. Figure 1b shows the spectra of SG-CPDs and the raw material SA, which were quite different. First, the peak intensity of SG-CPDs at the vicinity of 3270 cm–1, which was assigned to the stretching vibration of O–H, apparently decreased compared to that of SA because of the consumption of hydroxyl groups during the cross-linking, dehydration, and carbonization processes. Similarly, peaks at 1063 cm–1 assigned to the stretching vibration of C–OH also decreased. The C=O bending vibration at 1613 cm–1 and in-plane C–H at 1416 cm–1 shifted a little because of the rupture of original C–H of SA and the formation of new C–H groups during the carbonization process. Similarly, the stretching vibrations of the C–O–C bond of SA at 1295 cm–1 shifted to 1350 cm–1 for SG-CPDs. The sharp peak at 774 cm–1 appeared in the curve of SG-CPDs was attributed to the stretching vibration of the C–C bond of substituted benzene, indicating the formation of the substituted benzene structure in SG-CPDs through the carbonization process.19
Figure 1.
(a) TEM image of SG-CPDs prepared at 180 °C. (b) FT-IR spectra of SA and SG-CPDs. (c,d) XPS analysis of C 1s and O 1s of SG-CPDs. (e) UV–vis absorption and PL emission spectra of SG-CPDs. The inset is the photograph of the SG-CPD aqueous solution under 365 nm excitation. (f) PL spectra of SG-CPDs with different concentrations excited at 360 nm.
X-ray photoelectron spectroscopy (XPS) data further confirmed the chemical compositions of SG-CPDs. The resolved C 1s peaks of SG-CPDs of Figure 1c showed that the chemical states of C element in CPDs consisted of C–C/C=C bonds (284.6 eV), C–O bonds (286.0 eV), C=O bonds (287.8 eV), and COOH bonds (289.0 eV). The resolved O 1s peaks of SG-CPDs in Figure 1d showed that the chemical states of the O element consist of C=O bonds (531.4 eV), C–O bonds (533.1 eV), and C–OH/C–O–C bonds (532.0 eV). XPS data showed that SG-CPDs were mainly composed of carboxyl, aldehyde, ether linkage, and hydroxyl groups, which were consistent with FT-IR.
Ultraviolet–visible (UV–vis) and PL spectra of SG-CPDs are shown in Figure 1e. The characteristic absorption peak at 312 nm was observed in the UV–vis spectrum of SG-CPDs, which corresponds to the n−π* transition of C=O. PL emission spectra of SG-CPDs showed obvious excitation dependence. When the excitation wavelength changed from 310 to 410 nm, the emission peak shifted from 458 to 508 nm, which illustrated the existence of different fluorescence centers and complex energy levels in CPDs.20 In addition, the fluorescence lifetime of SG-CPDs was tested, as shown in Figure S1, by exponential fitting, τ1 and τ2 were 4.80 and 1.45 ns, respectively, indicating that emission originated from different fluorescence centers and the average fluorescence lifetime of SG-CPDs was 3.46 ns. The optimal excitation and emission wavelengths appeared at 360 and 467 nm, respectively. The influence of CPDs’ concentration to the PL emission was investigated (Figure 1f). All measurement parameters were kept the same to make the comparison of intensity meaningful. With the increase of concentration, the emission intensity first increased and then decreased, while its position red-shifted from 444 to 548 nm, with the emission color changed from blue to green. The red shift was due to the fluorescence resonance energy transfer between CPDs.21 The significant reduction in the emission intensity of concentrated samples resulted from the internal filtering effect, such that during the PL measurement, the incident light was strongly absorbed by the CPDs at the front of the cuvette, weakening the incident light for CPDs at the back of the cuvette.22,23
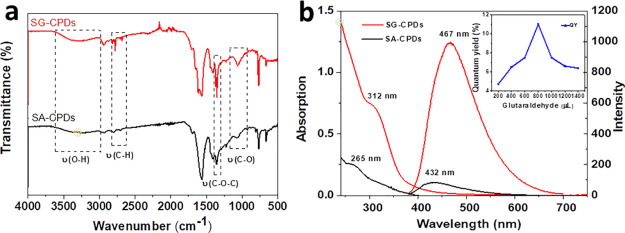
To ensure the influence of cross-linking on the PL, SA-CPDs were prepared in the same condition using neat SA. The FT-IR spectra of SA-CPDs and SG-CPDs are compared in Figure 2a. A large number of carboxyl groups were found on the surface of two CPDs. Hydroxyl peaks in 3270 and 1063 cm–1 for SG-CPDs showed higher intensities than those of SA-CPDs, which resulted from the partial passivation of hydroxyl groups from over carbonization by cross-linking, as illustrated in Scheme 1. In addition, sharp peaks at 2816 and 2778 cm–1 and the stronger peak at 1350 cm–1 of SG-CPDs were due to the C–O–C group formed during the acetal reaction between the aldehyde group and the hydroxyl group. All the differences between the two spectra proved that the cross-linking happened during the preparation of SG-CPDs.
Figure 2.
(a) FT-IR spectra of SA-CPDs and SG-CPDs. Both CPDs were prepared under 180 °C. (b) UV–vis and PL spectra of SA-CPDs and SG-CPDs, and the inset was the QY with different amounts of glutaraldehyde.
UV–vis absorption and PL emission spectra of SG-CPDs and SA-CPDs were then investigated to figure out the influence of CEE on the PL property. As shown in Figure 2b, compared to those of SA-CPDs, both the absorption and the emission peaks of SG-CPDs red-shifted and significantly increased in intensity and the UV–vis absorption peak at 265 nm was attributed to π–π* transition, while the absorption peak at 312 nm was attributed to n−π* transition. The cross-linking structure of the precursors resulted in a more compact internal structure of CPDs, which enhanced the group interaction and changed energy gaps, leading to the red shifts of both the absorption and emission.5 The quantum yields (QYs) of the two CPDs were 2% for SA-CPDs and 11% for SG-CPDs, showing that the cross-linking process greatly improved the fluorescence intensity because of the restriction of nonradiation relaxation de-excitation process caused by the vibration and rotation of subfluorophores, as illustrated in Scheme 1. Moreover, the QY of SG-CPDs was found to be closely related to the amount of glutaraldehyde, as shown in the inset picture of Figure 2b, probably because the strongest cross-linking extent was achieved with the molar ratio of SA/glutaraldehyde about 2.66.
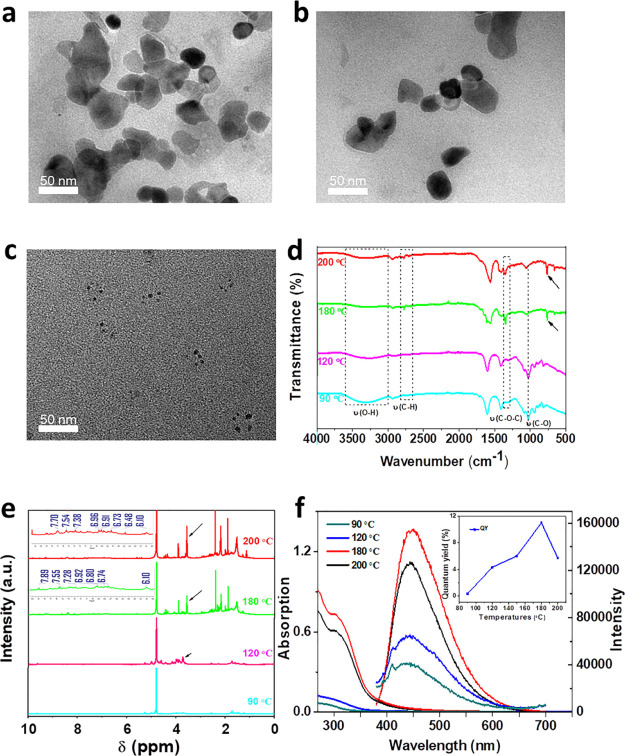
SG-CPDs were then prepared at different temperatures to figure out the influence of the reaction temperature. Figure 3a shows that polymer clusters larger than 50 nm appeared at a low reaction temperature of 90 °C, with no fixed shapes and low image contrast because of the low degree of carbonization. At 120 °C, the sample was further dehydrated and cross-linked to form smaller clusters with higher contrast, as shown in Figure 3b. When the reaction temperature rose to 200 °C, the sample was carbonized and precipitated. After purification, the size was barely changed, but the number of particles was greatly reduced compared with that at 180 °C, as shown in Figure 3c.
Figure 3.
(a–c) TEM images of SG-CPDs obtained at different reaction temperatures (the temperature was 90, 120, and 200 °C in sequence). (d) FT-IR spectra, (e) 1H NMR and (f) UV–vis absorption and PL emission spectra of SG-CPDs, and the inset of (f) was the corresponding QY.
The chemical structures of different SG-CPDs were then characterized by FT-IR in Figure 3d. With the deepened cross-linking and dehydration at higher temperatures, hydroxyl peaks at 1063 and 3270 cm–1 decreased gradually while the C–O–C bond formed by the acetal reaction gradually appeared and increased near 1350, 2816, and 2778 cm–1. Meanwhile, the deepened carbonization resulted in the formation of conjugated π-subdomains at high temperatures of 180 and 200 °C, namely, the absorption peak near 770 cm–1, which was C–C stretching vibration of substituted benzene.12 Peaks at 2816 and 2778 cm–1 were assigned to stretching vibrations of CHO bonds formed during dehydration and carbonization at high temperatures; besides, the acetal reaction between the aldehyde group and the hydroxyl group was also the reason for the formation of the peaks.
The proton nuclear magnetic resonance (1H NMR) spectra of SG-CPDs are shown in Figure 3e. With the increase of temperature, the peak intensity of C–O–C formed near δ = 3.7 increased gradually, indicating that the cross-linking deepened gradually. The group of small peaks near δ = 6.0–8.5 proved that aromatic compounds appear, showing that the sample had a para crystalline carbon structure at 180 and 200 °C. This result was in agreement with that of FT-IR spectra, where both degrees of cross-linking and carbonization were deepened by the increase of temperature.
Figure 3f shows the UV–vis and PL spectra of SG-CPDs prepared at different temperatures. No obvious absorption peaks for SG-CPDs prepared at 90 and 120 °C were observed for UV–vis spectra, indicating that there were no clear band gaps in those polymer clusters because of the insufficient cross-linking and carbonization at low temperatures. Then, at 180 and 200 °C, the fixing of subfluorophores led to the obvious n−π* transition absorption peaks at 310 nm. Moreover, PL intensities and QY increased with the increasing temperatures because of the CEE effects, while the maximum peak positions remained the same. Cross-linking and carbonization (physical cross-linking) were the main reasons for the enhancement of fluorescence. In addition, QY of the samples increased. However, the highest emission intensity and QY appeared at 180 °C but not 200 °C because too high temperature caused further carbonization of the fixing subfluorophores, resulting in the decrease of QY.
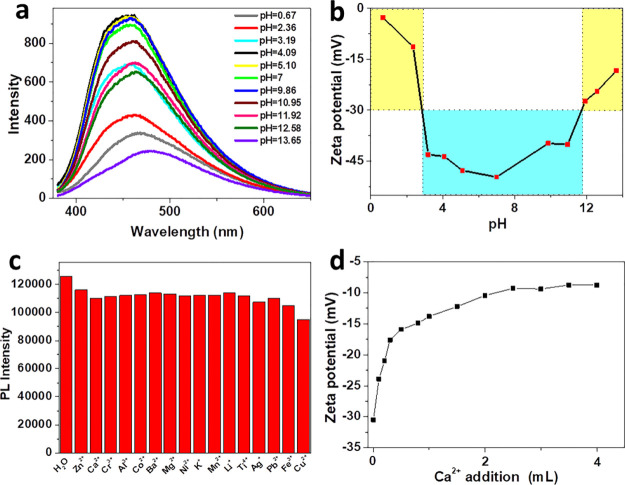
The fluorescence spectra of SG-CPDs at different pH were investigated. It can be seen from Figure 4a that as the pH increased from 0.67 to 13.65, the fluorescence peak first blue-shifted from 465 to 453 nm and then red-shifted to 480 nm. The fluorescence intensity maintained a comparable intensity level in a large pH range of about 3–12, which meant that SG-CPDs could be well used in mild acidic and basic environments without quenching (see photographs in Figure S2). However, emission intensities reduced significantly under strong acidic or basic environments deduced to be the aggregation of SG-CPDs in strong acidic and basic environments. To prove this point, ζ-potentials of SG-CPDs at different pH were tested and are shown in Figure 4b. First of all, because of the carboxyl groups capped surface, all samples showed negative ζ-potentials. However, absolute values in different pH ranges were quite different. Apparently, in the pH range of 3–12, all the values were larger than 30 mV, which was usually regarded as the lowest boundary of a stable dispersion of nanoparticles. However, in strong acid (pH < 3 in this case), the value was only 2.68 mV because the surface of SG-CPDs was neutralized by the protonation of carboxyl groups, while it was 18.3 mV in strong base (pH > 13 in this case) because of the charge shielding caused by the increased ion strength. In both cases, the aggregation of SG-CPDs resulted from the weak stability of the dispersion, leading to the red shift and intensity decrease of fluorescence.
Figure 4.
(a) PL emission spectra and (b) ζ-potential of SG-CPDs at different pH. (c) PL reactions of SG-CPDs with different metal ions. The concentration of all added substances was 45.0 μM. (d) Relationship between the ζ-potential of SG-CPDs’ solutions and the addition amount of Ca2+.
The specific surface property and the CEE PL mechanism of SG-CPDs also resulted in their unique stable PL in different metal-ion environments. Usually, the quenching of CPDs in metal-ion environments will be observed because of the formation of nonfluorescence ground-state complex between CPDs and metal ions, or the energy or charge transfer resulted from the collision between excited CPDs and metal ions.22−24 However, as shown in Figure 4c, SG-CPDs showed no significant quenching in various metal-ion solutions. As the SG-CPDs had a large number of negative groups on the surface, they electrostatically interacted with the metallic ions in the solution. As shown in Figure 4d, when 2 wt % CaCl2 aqueous solution was added into the SG-CPD solution, the ζ-potential decreased gradually with the increasing addition amount and then became stable over 2.5 mL, while the fluorescence was almost unchanged (see photographs in Figure S3). This specific phenomenon was due to the unique CEE PL mechanism of CPDs that the PL originated from the cross-linking-fixed subfluorophores, which would not be affected by the interaction of SG-CPDs with metal ions. Moreover, this was different from the change of PL in interaction with a strong acid or base, in which the interactions among each SG-CPD would cause directly energy or charge transfer after aggregation and finally resulted in the peak shifts and intensity decrease. We believed that the special stability of SG-CPDs in metal-ion environments would be conducive to the application in biological imaging and so on.
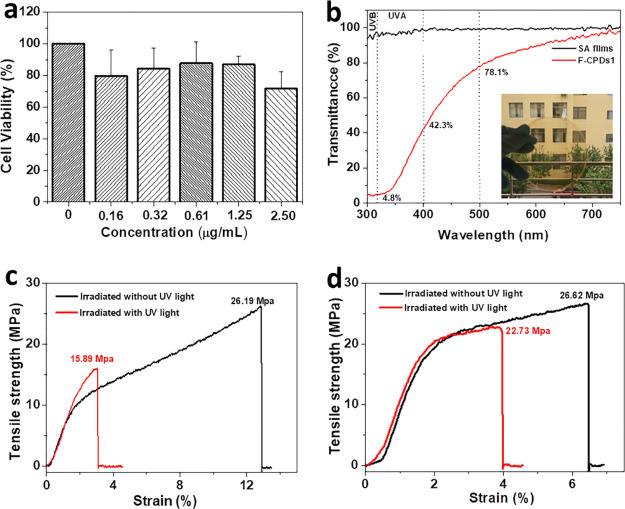
In order to ensure the safety of SG-CPDs in its daily applications, the in vitro toxicity of SG-CPDs was determined by the 3-[4,5-dimethyl-2-thiazolyl]-2,5-diphenyl-2H-tetrazolium bromide (MTT) cell survival test. It can be seen from Figure 5a that the cell viability was higher than 72% at all concentrations, indicating that SG-CPDs had enough safety for daily usages. We then tried to incorporate the SG-CPDs in SA films. As a kind of films made from biopolymer, SA films were transparent, nontoxic, degradable, and renewable,25 which can be used in food packaging, preservation, and drug delivery carriers,26−28 but the UV-degradable property of SA decreased its mechanical strength under daylight and furthermore, the easy transmittance of the UV lights through the films can easily affect the food. Different from other additives, SG-CPDs was nontoxic and had no effect on food. Therefore, we added SG-CPDs to the SA films (named as F-CPDs) to improve the anti-ultraviolet performance of the films. Illustration in Figure 5b is the optical photograph of F-CPDs. Because of the excellent dispersion of SG-CPDs in water and its similar surface properties with SA, the dispersion of SG-CPDs in SA films was very good. The color of the films was uniform with no obvious aggregation and excellent transparency. The transmittance values of SA films and F-CPDs1 (the dosage of SG-CPDs was 1 mL) were measured and are shown in Figure 5b. The SA films had a transmittance of more than 95.1% from 300 to 700 nm. The transmittance of F-CPDs1 was more than 78.1% in the green to red light region, 42.3% in the blue violet region, and only 4.8% in the UV region, showing excellent UV shielding performance. In order to verify the UV aging resistance of the films, tensile strength measurements of SA films and F-CPDs1 before and after UV irradiation were tested and are shown in Figure 5c,d. Before UV irradiation, the strengths of the two films were 26.19 and 26.62 MPa, respectively, and the similarity indicated that SG-CPDs had good dispersion and compatibility in the films and did not affect the mechanical strength of the films. After UV irradiation for 3 days, the tensile strength of pure SA films was reduced by 39% while the F-CPDs1 decreased to only 15% of the original strength, showing good preserved strength against UV irradiation. This unique property was because SG-CPDs can convert the absorbed UV light into heat energy, at the same time accelerate the loss of water molecules, and make the internal structure of the films more compact, so the tensile strength of the F-CPDs1 was well preserved.29 As shown in Figure S4, the tensile strengths of the films with different amounts of SG-CPDs (F-CPDs0.5, F-CPDs1, and F-CPDs1.5 with dosages of SG-CPDs 0.5, 1, and 1.5 mL, respectively) were further explored. It can be seen that the amount of SG-CPDs had little influence on the tensile strengths of the films. After UV irradiation, the composite films all showed much higher tensile strengths than SA films. The slight increase of tensile strength for F-CPDs0.5 might be because the converted heat energy resulted in the cross-linking of the film. These results demonstrated the feasibility of SG-CPDs as anti-ultraviolet aging additives for SA films.
Figure 5.
(a) In vitro toxicological assessment of SG-CPDs with varying concentrations with L-929 cells. (b) UV–vis spectra of SA films and F-CPDs1. The thickness of each film was 40 μm. The inset is the photograph of F-CPDs1. (c,d) Tensile strength curves of the SA films (c) and the F-CPDs1 (d) before and after UV irradiation.
3. Conclusions
In summary, SG-CPDs with blue PL were synthesized from chemically cross-linked SA based on the CEE mechanism. Results showed that the QY of SA-derived CPDs increased from 2.5 to 11% upon cross-linking. Through a series of detailed characterization, the structure and fluorescent properties of SG-CPDs during the hydrothermal reaction were determined. Benefitting from the inherited surface properties of SA, the SG-CPDs had high fluorescent stability in different acidic/basic environments and different metal-ion environments. The safety of SG-CPDs was proved by the cell activity test in vitro. Finally, SG-CPDs were added into SA films to offer the UV resistance, and the results showed that SG-CPDs effectively reduce the effect of UV on the mechanical strength of SA films.
4. Experimental Section
4.1. Materials
SA (white powder, Mw = 220 kDa, MWD = 1.5 and M/G = 1.05 as we used before30) was bought from the Gather Great Ocean Algae Industry Group. Glutaraldehyde was obtained from Tianjin Bodi Chemical Industry Co. Hydrochloric acid (HCl, 36–38%) was obtained from Beijing Chemical Reagent Co. Sodium hydroxide (NaOH, AR) was purchased from Sinopharm Chemical Reagent Co. The metal salts needed for the experiment were purchased from Sinopharm Chemical Reagent Co., and all reagents were of analytical grade. MTT was purchased from China Center for Type Culture Collection (Wuhan, China). Glycerin (99%) was purchased from Shanghai Macklin Biochemical Co. Secondary deionized water was used throughout.
4.2. Preparation and Purification
SA powders were dissolved in 50 mL of water to form a 2 wt % solution. Then, 800 μL of glutaraldehyde and 1 mL of 0.1 M HCl were added and mixed by stirring. The mixture was then transferred to a poly(tetrafluoroethylene)-lined autoclave (50 mL) and heated at 180 °C. Other temperatures were also used to help understand the reaction process. The obtained brown solution was first filtered through a 0.45 μm nylon filter membrane (Millipore) to remove the carbonized precipitate. Resulted SG-CPD solution was obtained by dialysis with deionized water in a dialysis bag (1000 D) for 3 days. Solid SG-CPD powders were obtained via freeze-drying. For comparison, CPDs without the addition of glutaraldehyde were prepared in the similar way and named SA-CPDs.
4.3. In Vitro Cytotoxicity
The cell cytotoxicity of SG-CPDs was tested by the MTT assay with L-929 fibroblasts. The cells were first cultured to the logarithmic growth stage in the Dulbecco’s modified Eagle’s medium supplemented with 10% fetal bovine serum. After digestion with trypsin–ethylenediaminetetraacetic acid, the cells were transferred to wells of a 96-well plate with the concentration of 1 × 10⁵ cells per well and then incubated for 24 h at 37 °C with 5% CO2 until a semiconfluent monolayer was formed. The SG-CPDs were added to each well with certain amounts to ensure that the final concentrations were 0, 0.16, 0.32, 0.61, 1.25, and 2.50 μg/mL, respectively. After that, the cells were further incubated for 24 h. Then, 20 μL of MTT with the concentration of 5 mg/mL was added to each well and incubated for another 4 h. Finally, after carefully removing the surfactant, 150 μL of dimethyl sulfoxide was added to each well, and the well plate was shaken in the dark for 10 min to dissolve the crystals. Absorbances of the solutions at 570 and 630 nm were measured using a microplate reader (EnSpire, PerkinElmer Inc. Massachusetts, MA, USA), and the cell viability was the ratio of the absorbance of cells cultured with SG-CPDs and that of the control group. All samples were performed five times to obtain an average value.
4.4. Preparation of Anti-ultraviolet Aging SA/SG-CPD Films
SG-CPD (0.5, 1, and 1.5 mL, 20 mg/mL) solutions and 0.075 g of glycerin as the plasticizer were added to 50 mL of 1.5 wt % SA solution. The mixture was stirred evenly, and ultrasound was done for an hour to remove bubbles. The mixture was poured into a glass culture dish and dried at 40 °C for 12 h. Finally, films with good strength and transparency were prepared, respectively, named F-CPDs0.5, F-CPDs1, and F-CPDs1.5. All films were cut to two same thin strips of 8 mm × 5 cm as a group. Then, one strip was exposed to 365 nm UV irradiation for 3 days, while the other strip was placed in dark for comparison. Tensile strengths of all groups of strips were then tested at room temperature and humidity of 65% relative humidity.
4.5. Characterization
TEM was recorded on a HITACHI H-7600 by using ultrathin carbon films as grids. FT-IR spectra were recorded on a Thermo Scientific Nicolet iS50 spectrophotometer. XPS measurements were performed by an ESCALAB 250 Xi XPS system of Thermo Scientific. UV–vis absorption spectra and transmittance were measured by a HITACHI U-3900H spectrophotometer. PL spectra were observed by a HORIBA Scientific FluoroMax-4 spectrofluorometer. The fluorescence lifetime was collected on an Edinburgh FLS 980. QY was measured according to the method in the literature.31 NMR spectra were recorded using a Bruker AVANCE III HD 400 MHz using D2O as the solvent. Zeta potential was recorded on a Malvern Zetasizer Nano ZSE. The tensile test was obtained by an Instron 5300 universal testing machine (spacing: 2 cm, tensile speed: 5 mm/min).
Acknowledgments
This work was financially supported by the National Natural Science Foundation of China (no. 51303089); China Postdoctoral Science Foundation (nos. 20110491557, 2012T50597); Postdoctoral Innovation Foundation of Shandong Province (no. 201102039); Changjiang Scholars and Innovative Research Team in University (IRT_14R30); Taishan Scholar Program of Shandong Province (tspd20181208); and State Key Laboratory of Bio-Fibers and Eco-Textiles (Qingdao University, no. ZKT 36).
Supporting Information Available
The Supporting Information is available free of charge at https://pubs.acs.org/doi/10.1021/acsomega.0c03995.
Photograph of PL of SG-CPDs in different pH environments and photograph of PL of SG-CPDs after adding calcium ions (mL) (PDF)
The authors declare no competing financial interest.
Supplementary Material
References
- Michalet X.; Pinaud F. F.; Bentolila L. A.; Tsay J. M.; Doose S.; Li J. J.; Sundaresan G.; Wu A. M.; Gambhir S. S.; Weiss S. Quantum Dots for Live Cells, in Vivo Imaging, and Diagnostics. Science 2005, 307, 538. 10.1126/science.1104274. [DOI] [PMC free article] [PubMed] [Google Scholar]
- Sun Y.-P.; Zhou B.; Lin Y.; Wang W.; Fernando K. A. S.; Pathak P.; Meziani M. J.; Harruff B. A.; Wang X.; Wang H.; Luo P. G.; Yang H.; Kose M. E.; Chen B.; Veca L. M.; Xie S.-Y. Quantum-sized carbon dots for bright and colorful photoluminescence. J. Am. Chem. Soc. 2006, 128, 7756–7757. 10.1021/ja062677d. [DOI] [PubMed] [Google Scholar]
- Sui B.; Li Y.; Yang B. Nanocomposite hydrogels based on carbon dots and polymers. Chin. Chem. Lett. 2020, 31, 1443–1447. 10.1016/j.cclet.2019.08.023. [DOI] [Google Scholar]
- Song Y.; Zhu S.; Shao J.; Yang B. Polymer carbon dots—a highlight reviewing their unique structure, bright emission and probable photoluminescence mechanism. J. Polym. Sci., Part A: Polym. Chem. 2017, 55, 610–615. 10.1002/pola.28416. [DOI] [Google Scholar]
- Xia C.; Zhu S.; Feng T.; Yang M.; Yang B. Evolution and Synthesis of Carbon Dots: From Carbon Dots to Carbonized Polymer Dots. Adv. Sci. 2019, 6, 1901316. 10.1002/advs.201901316. [DOI] [PMC free article] [PubMed] [Google Scholar]
- Zhu S.; Song Y.; Zhao X.; Shao J.; Zhang J.; Yang B. The photoluminescence mechanism in carbon dots (graphene quantum dots, carbon nanodots, and polymer dots): current state and future perspective. Nano Res. 2015, 8, 355–381. 10.1007/s12274-014-0644-3. [DOI] [Google Scholar]
- Tao S.; Feng T.; Zheng C.; Zhu S.; Yang B. Carbonized Polymer Dots: A Brand New Perspective to Recognize Luminescent Carbon-Based Nanomaterials. J. Phys. Chem. Lett. 2019, 10, 5182–5188. 10.1021/acs.jpclett.9b01384. [DOI] [PubMed] [Google Scholar]
- Meng W.; Bai X.; Wang B.; Liu Z.; Lu S.; Yang B. Biomass-Derived Carbon Dots and Their Applications. Energy Environ. Mater. 2019, 2, 172–192. 10.1002/eem2.12038. [DOI] [Google Scholar]
- Cui Z.; Li Z.; Jin Y.; Ren T.; Chen J.; Wang X.; Zhong K.; Tang L.; Tang Y..; Cao M. Novel magnetic fluorescence probe based on carbon quantum dots-doped molecularly imprinted polymer for AHLs signaling molecules sensing in fish juice and milk. Food Chem. 2020, 328, 127063. 10.1016/j.foodchem.2020.127063. [DOI] [PubMed] [Google Scholar]
- Yang P.; Zhu Z.; Li X.; Zhang T.; Zhang W.; Chen M.; Zhou X. Facile synthesis of yellow emissive carbon dots with high quantum yield and their application in construction of fluorescence-labeled shape memory nanocomposite. J. Alloys Compd. 2020, 834, 154399. 10.1016/j.jallcom.2020.154399. [DOI] [Google Scholar]
- Lee K. Y.; Mooney D. J. Alginate: Properties and biomedical applications. Prog. Polym. Sci. 2012, 37, 106–126. 10.1016/j.progpolymsci.2011.06.003. [DOI] [PMC free article] [PubMed] [Google Scholar]
- Jeon O.; Bouhadir K. H.; Mansour J. M.; Alsberg E. Photocrosslinked alginate hydrogels with tunable biodegradation rates and mechanical properties. Biomaterials 2009, 30, 2724–2734. 10.1016/j.biomaterials.2009.01.034. [DOI] [PubMed] [Google Scholar]
- Pawar S. N.; Edgar K. J. Alginate derivatization: A review of chemistry, properties and applications. Biomaterials 2012, 33, 3279–3305. 10.1016/j.biomaterials.2012.01.007. [DOI] [PubMed] [Google Scholar]
- Dou X.; Zhou Q.; Chen X.; Tan Y.; He X.; Lu P.; Sui K.; Tang B. Z.; Zhang Y.; Yuan W. Z. Clustering-Triggered Emission and Persistent Room Temperature Phosphorescence of Sodium Alginate. Biomacromolecules 2018, 19, 2014–2022. 10.1021/acs.biomac.8b00123. [DOI] [PubMed] [Google Scholar]
- Liu Y.; Liu Y.; Park S.-J.; Zhang Y.; Kim T.; Chae S.; Park M.; Kim H.-Y. One-step synthesis of robust nitrogen-doped carbon dots: acid-evoked fluorescence enhancement and their application in Fe3+ detection. J. Mater. Chem. A 2015, 3, 17747–17754. 10.1039/c5ta05189d. [DOI] [Google Scholar]
- Zhou J.; Deng W.; Wang Y.; Cao X.; Chen J.; Wang Q.; Xu W.; Du P.; Yu Q.; Chen J.; Spector M.; Yu J.; Xu X. Cationic carbon quantum dots derived from alginate for gene delivery: One-step synthesis and cellular uptake. Acta Biomater. 2016, 42, 209–219. 10.1016/j.actbio.2016.06.021. [DOI] [PubMed] [Google Scholar]
- Choi Y.; Ryu G. H.; Min S. H.; Lee B. R.; Song M. H.; Lee Z.; Kim B.-S. Interface-Controlled Synthesis of Heterodimeric Silver–Carbon Nanoparticles Derived from Polysaccharides. ACS Nano 2014, 8, 11377–11385. 10.1021/nn504287q. [DOI] [PubMed] [Google Scholar]
- Fong J. F. Y.; Chin S. F.; Ng S. M. Facile synthesis of carbon nanoparticles from sodium alginate via ultrasonic-assisted nano-precipitation and thermal acid dehydration for ferric ion sensing. Sens. Actuators, B 2015, 209, 997–1004. 10.1016/j.snb.2014.12.038. [DOI] [Google Scholar]
- Liu J.; Li D.; Zhang K.; Yang M.; Sun H.; Yang B. One-Step Hydrothermal Synthesis of Nitrogen-Doped Conjugated Carbonized Polymer Dots with 31% Efficient Red Emission for In Vivo Imaging. Small 2018, 14, 1703919. 10.1002/smll.201703919. [DOI] [PubMed] [Google Scholar]
- Tao S.; Feng T.; Zheng C.; Zhu S.; Yang B. Carbonized Polymer Dots: A Brand New Perspective to Recognize Luminescent Carbon-Based Nanomaterials. J. Phys. Chem. Lett. 2019, 10, 5182–5188. 10.1021/acs.jpclett.9b01384. [DOI] [PubMed] [Google Scholar]
- Clapp A. R.; Medintz I. L.; Mauro J. M.; Fisher B. R.; Bawendi M. G.; Mattoussi H. Fluorescence Resonance Energy Transfer Between Quantum Dot Donors and Dye-Labeled Protein Acceptors. J. Am. Chem. Soc. 2004, 126, 301–310. 10.1021/ja037088b. [DOI] [PubMed] [Google Scholar]
- Dong Y.; Wang R.; Li G.; Chen C.; Chi Y.; Chen G. Polyamine-Functionalized Carbon Quantum Dots as Fluorescent Probes for Selective and Sensitive Detection of Copper Ions. Anal. Chem. 2012, 84, 6220–6224. 10.1021/ac3012126. [DOI] [PubMed] [Google Scholar]
- Zu F.; Yan F.; Bai Z.; Xu J.; Wang Y.; Huang Y.; Zhou X. The quenching of the fluorescence of carbon dots: A review on mechanisms and applications. Microchim. Acta 2017, 184, 1899–1914. 10.1007/s00604-017-2318-9. [DOI] [Google Scholar]
- Shen P.; Xia Y. Synthesis-Modification Integration: One-Step Fabrication of Boronic Acid Functionalized Carbon Dots for Fluorescent Blood Sugar Sensing. Anal. Chem. 2014, 86, 5323–5329. 10.1021/ac5001338. [DOI] [PubMed] [Google Scholar]
- Yang M.; Shi J.; Xia Y. Effect of SiO2, PVA and glycerol concentrations on chemical and mechanical properties of alginate-based films. Int. J. Biol. Macromol. 2018, 107, 2686–2694. 10.1016/j.ijbiomac.2017.10.162. [DOI] [PubMed] [Google Scholar]
- Song Y.; Liu L.; Shen H.; You J.; Luo Y. Effect of sodium alginate-based edible coating containing different anti-oxidants on quality and shelf life of refrigerated bream (Megalobrama amblycephala). Food Control 2011, 22, 608–615. 10.1016/j.foodcont.2010.10.012. [DOI] [Google Scholar]
- Rhim J.-W. Physical and mechanical properties of water resistant sodium alginate films. LWT–Food Sci. Technol. 2004, 37, 323–330. 10.1016/j.lwt.2003.09.008. [DOI] [Google Scholar]
- Dong Z.; Wang Q.; Du Y. Alginate/gelatin blend films and their properties for drug controlled release. J. Membr. Sci. 2006, 280, 37–44. 10.1016/j.memsci.2006.01.002. [DOI] [Google Scholar]
- Hu G.; Lei B.; Jiao X.; Wu S.; Zhang X.; Zhuang J.; Liu X.; Hu C.; Liu Y. Synthesis of modified carbon dots with performance of ultraviolet absorption used in sunscreen. Opt. Express 2019, 27, 7629. 10.1364/oe.27.007629. [DOI] [PubMed] [Google Scholar]
- Zhao Z.; Geng C.; Zhao X.; Xue Z.; Quan F.; Xia Y. Preparation of CdTe/Alginate Textile Fibres with Controllable Fluorescence Emission through a Wet-Spinning Process and Application in the Trace Detection of Hg2+ Ions. Nanomaterials 2019, 9, 570. 10.3390/nano9040570. [DOI] [PMC free article] [PubMed] [Google Scholar]
- Wang Y.; Liang Z.; Su Z.; Zhang K.; Ren J.; Sun R.; Wang X. All-Biomass Fluorescent Hydrogels Based on Biomass Carbon Dots and Alginate/Nanocellulose for Biosensing. ACS Appl. Bio Mater. 2018, 1, 1398–1407. 10.1021/acsabm.8b00348. [DOI] [PubMed] [Google Scholar]
Associated Data
This section collects any data citations, data availability statements, or supplementary materials included in this article.


