Abstract
Structural and morphological interplay between hard and soft phases determine the bulk properties of thermoplastic polyurethanes. Commonly employed techniques rely on different physical or chemical phenomena for characterizing the organization of domains, but detailed structural information can be difficult to derive. Here, total scattering pair distribution function (PDF) analysis is used to determine atomic-scale insights into the connectivity and molecular ordering and compared to the domain size and morphological characteristics measured by AFM, TEM, SAXS, WAXS, and solid-state NMR 1H–1H spin-diffusion. In particular, density distribution functions are highlighted as a means to bridging the gap from the domain morphology to intradomain structural ordering. High real-space resolution PDFs are shown to provide a sensitive fingerprint for indexing aromatic, aliphatic, and polymerization-induced bonding characteristics, as well as the hard phase structure, and indicate that hard phases coexist in both ordered and disordered states.
1. Introduction
How do the atomic arrangements within thermoplastic polyurethanes (TPUs) affect their bulk properties? This is a complicated question to answer because of the small size and weak ordering of the domains, microphase segregation and intermixing, complex morphologies, and strongly diverging chemistry- and processing-driven structuring pathways. The amount, size, and morphology of hard and soft phases can be studied by methods such as small-angle X-ray scattering (SAXS),1−3 transmission electron microscopy (TEM),4−6 atomic force microscopy (AFM),7−9 and various solid-state nuclear magnetic resonance (NMR) techniques.10−15 However, the methods are sensitive to different sample properties, for example, variations in electron density, mechanical response, or molecular mobility and proton density. It is therefore important to cross-examine samples by different points-of-view to validate the interpretation of their structural characteristics.16−18
Substantial information on the atomic structure, phase composition, and domain morphology can also be determined from wide-angle X-ray scattering (WAXS).19 However, semicrystalline polymers,20 especially TPUs, show very few and extremely broad peaks, making it difficult or impossible to extract this information from the data. There is additionally the question of whether peaks from diffracting domains constitute true crystalline states or paracrystals with reduced symmetry operators available to describe the structure.21 In either case, coexisting challenges include the finiteness of the ordered domains on small scales, the potential for orientational and conformational distortions, and interfacial effects, all of which challenge the ability to extract information about the nature of ordering, let alone quantitative information about bond lengths or conformations.
Here, the domain formation in TPUs with different hard segments (HS) and soft segments (SS) was investigated by a variety of techniques covering length-scales from ångströms to micrometers. In particular, we focus on the use of pair distribution functions (PDFs) obtained from total scattering measurements, which allow us to extract details of atomic bonding, molecular chain packing arrangements, and domain size distributions from X-ray scattering data,22,23 even when no long-range structuring is present.24 PDF analysis has been used on polymers as early as 193625 but often with low-resolution data or analysis over only short distances.26,27 Recent investigations have shown utility for determining structures of TPU hard domains28 and quantifying the magnitude of local symmetry breaking offsets in stacked, two-dimensional (2D) porous polymers.29,30 It was also shown that a longer distance assessment can provide information about domain sizes and relative phase fractions.31 Here, we demonstrate further the use of lower energy laboratory X-ray diffraction data for observing real-space correlations of chain packing over longer distances, which we distinguish as density distribution functions (DDFs) due to the lack of atom-pair resolution compared to the PDF. In general, the idea of density distributions can be generalized for all scattering regimes: the isotropic atomic-pair density correlations obtained from different regions of X-ray scattering momentum transfer imbue useful differences in structural length-scale resolution.
2. Results and Discussion
Samples listed in Table 1 were prepared by BASF Polyurethanes GmbH, Germany. HS consisted of either 4,4′-methylene diphenyl diisocyanate (MDI) or hexamethylene diisocyanate (HDI) with 1,4-butanediol (BD) as a chain extender (CE). SS consisted of a polyetherol (PEOL) or polyesterol (PESOL): PTHF (Mn = 1000) or an ester of adipic acid, 1,6-hexanediol, and BD (Mn = 2000). The hard segment content (HSC) was calculated according to the formula in Section 2.1 of Stribeck et al.32
Table 1. List of Samples.
| sample | isocyanate | CE | SS | HSC % |
|---|---|---|---|---|
| TPU-06 | HDI | BD | PEOL | 46 |
| TPU-15 | MDI | BD | PEOL | 43 |
| TPU-30 | MDI | BD | PESOL | 44 |
13C solid-state NMR spectra were used to confirm the presence of HS and SS components in the samples. Schematics for the components in each TPU along with their respective NMR spectra are given in Figure 1. The origin of different regions of the spectra are labeled with the contributing carbon type. A more detailed assignment of resonances is provided in the Supporting Information.
Figure 1.
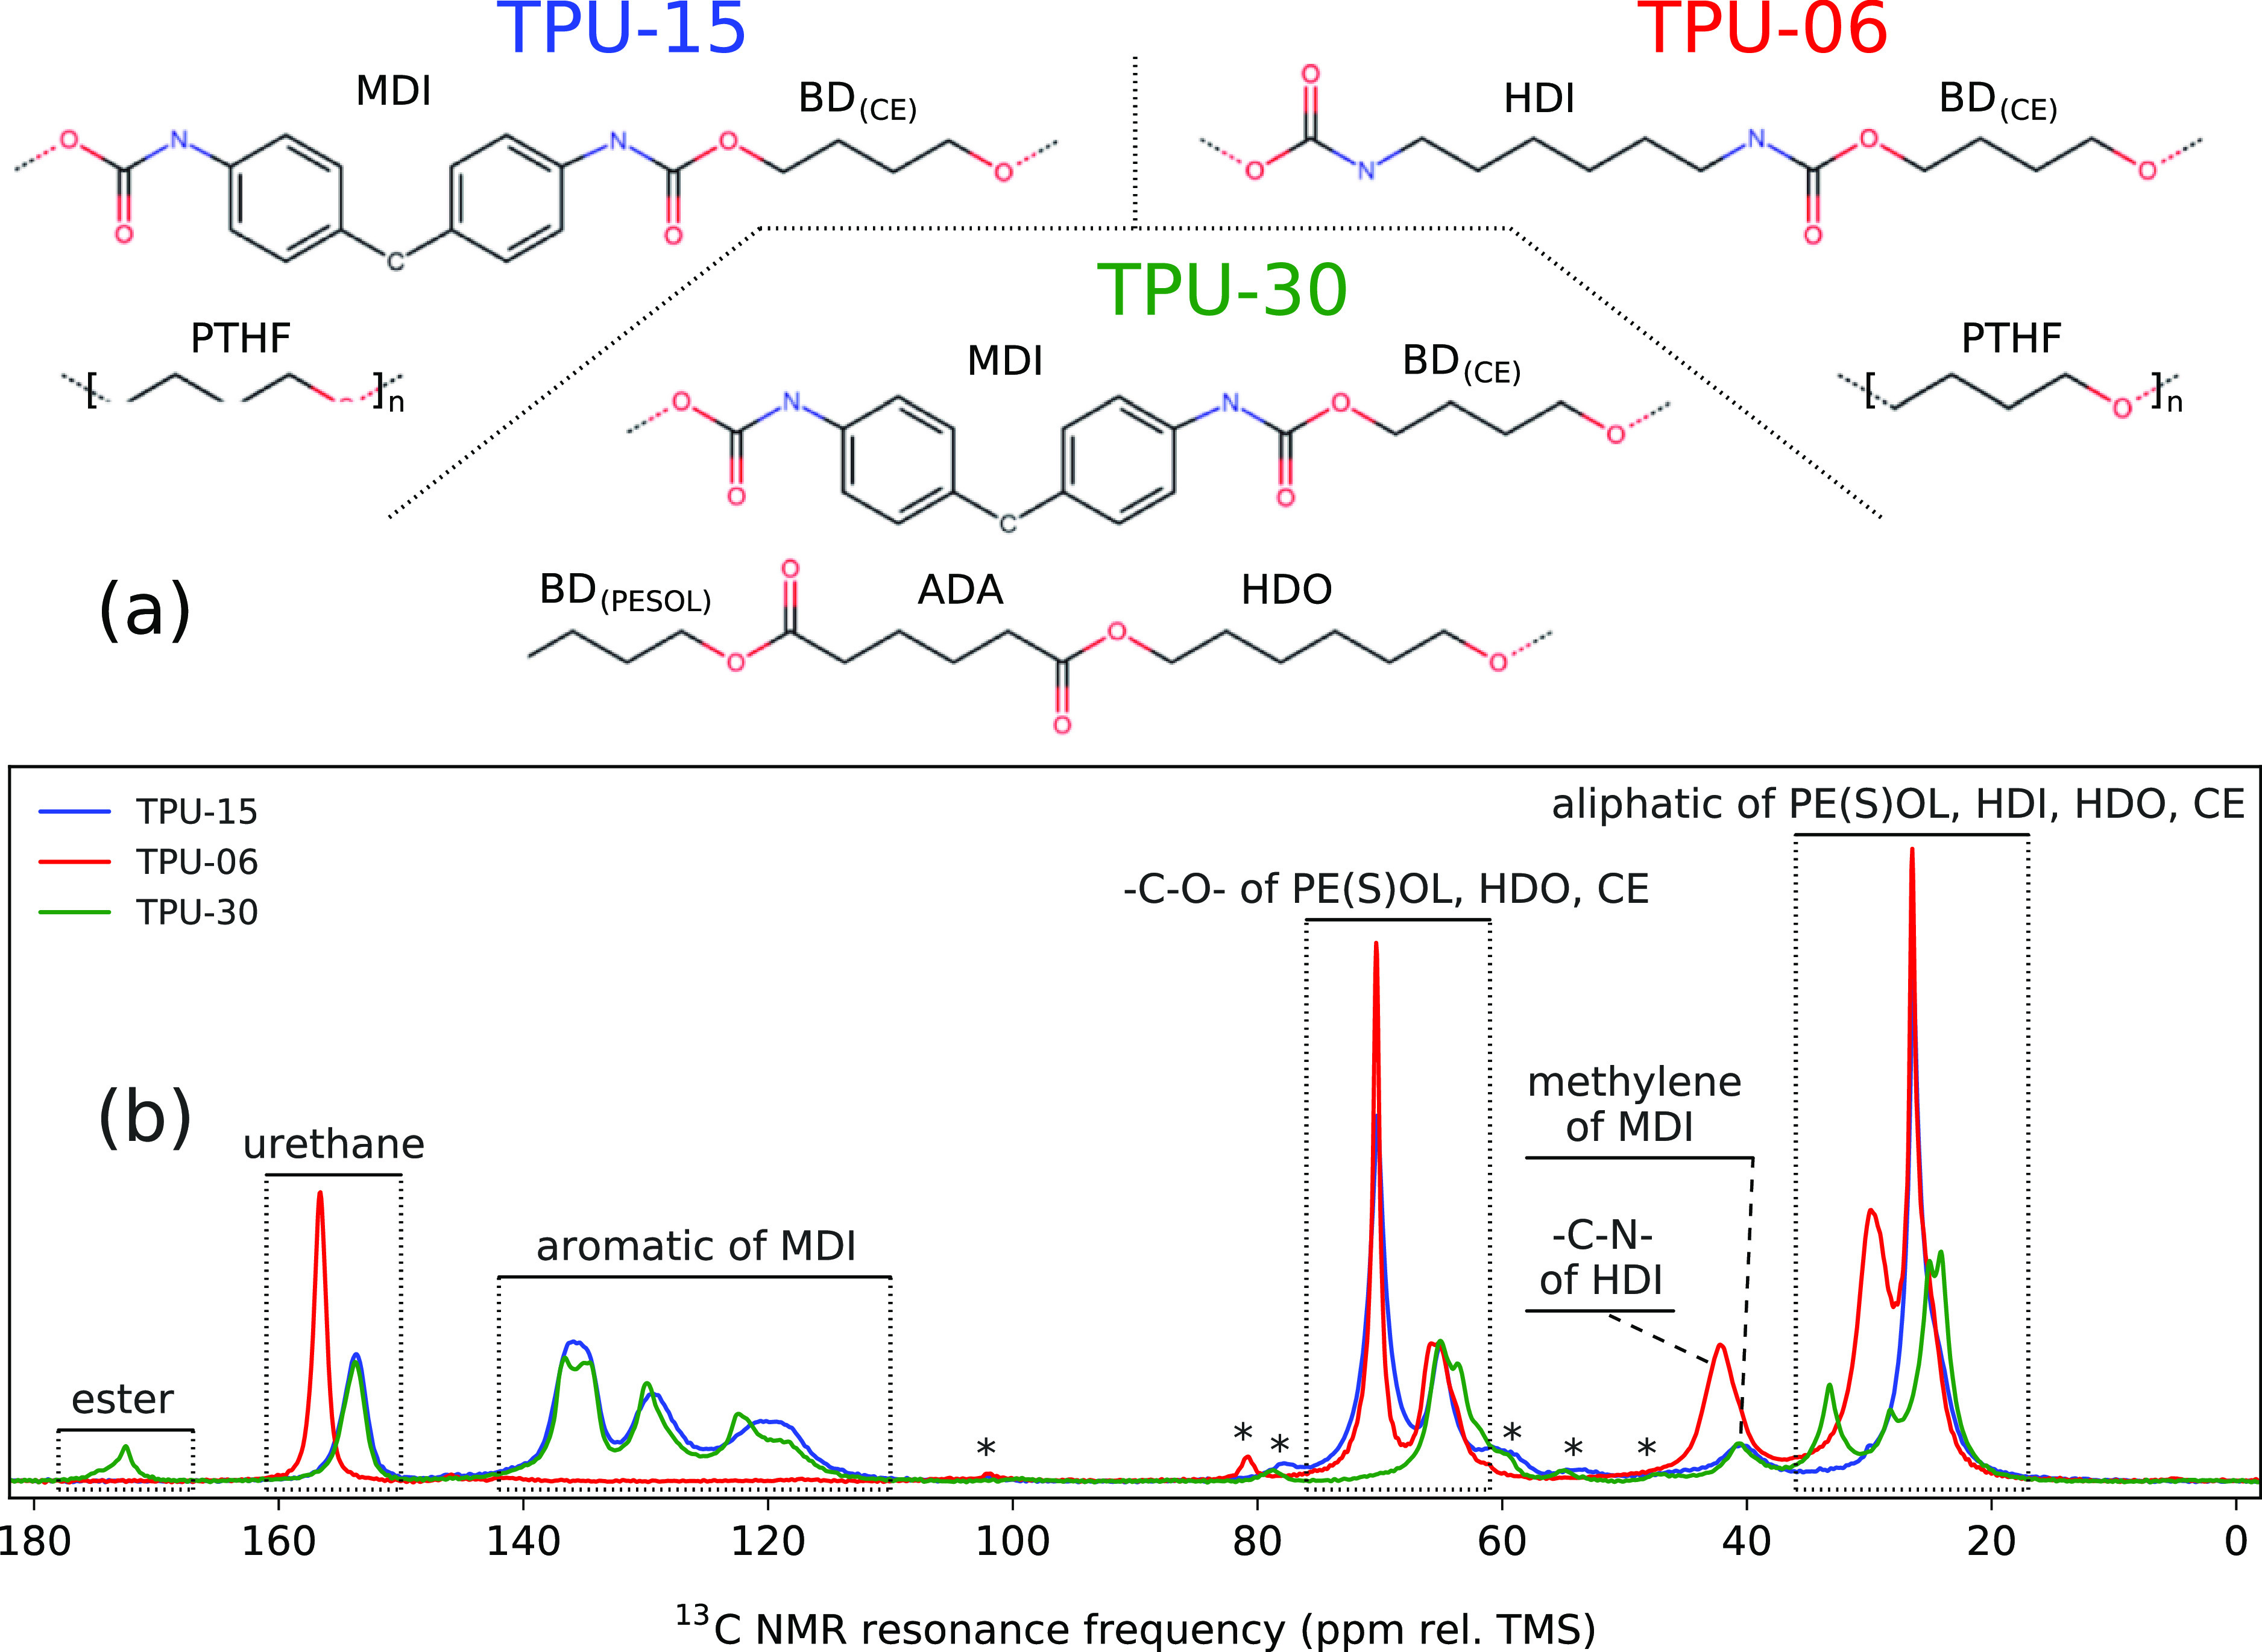
(a) Schematics of the HS and SS motifs and (b) 13C solid-state NMR spectra measured for all samples. Asterisks (*) denote spinning side-bands. Intensities are given at an arbitrary linear scale.
Segregation of hard and soft phases was measured by AFM phase contrast and TEM bright field measurements, as shown in Figure 2. In both cases, darker and lighter areas indicate softer and harder regions, respectively. AFM images are a 2D representation of a three-dimensional (3D) hierarchy of structures resulting from the random cut via cryo-microtomy, which are expected to be normally distributed. However, processing can result in non-normally distributed anisotropies that are more difficult to account for. To give a semiquantitative comparison of typical domain dimensions along any given axis, hard domains were identified in the AFM images, and the distributions of minimum and maximum Feret diameters were measured. Image processing steps and the resulting size distributions are shown in Figures S1–S3.33,34 The distributions were fit with a log-normal function, as listed in Table S1, giving mean Feret diameters of 29 nm (TPU-30), 24 nm (TPU-06), and 17 nm (TPU-15), though the variance is much larger for TPU-30 because of the highly anisotropic, branch structures ≥200 nm, likely due to secondary interactions of the ester. TPU-06 shows a slightly smaller mean Feret diameter and smaller variance because of more isotropic domains, while TPU-15 has the smallest and most homogeneously sized domains. Despite changes in morphology, all samples show a large population of Feret diameters on the order of 5–20 nm, indicating similar short-axis lengths.
Figure 2.
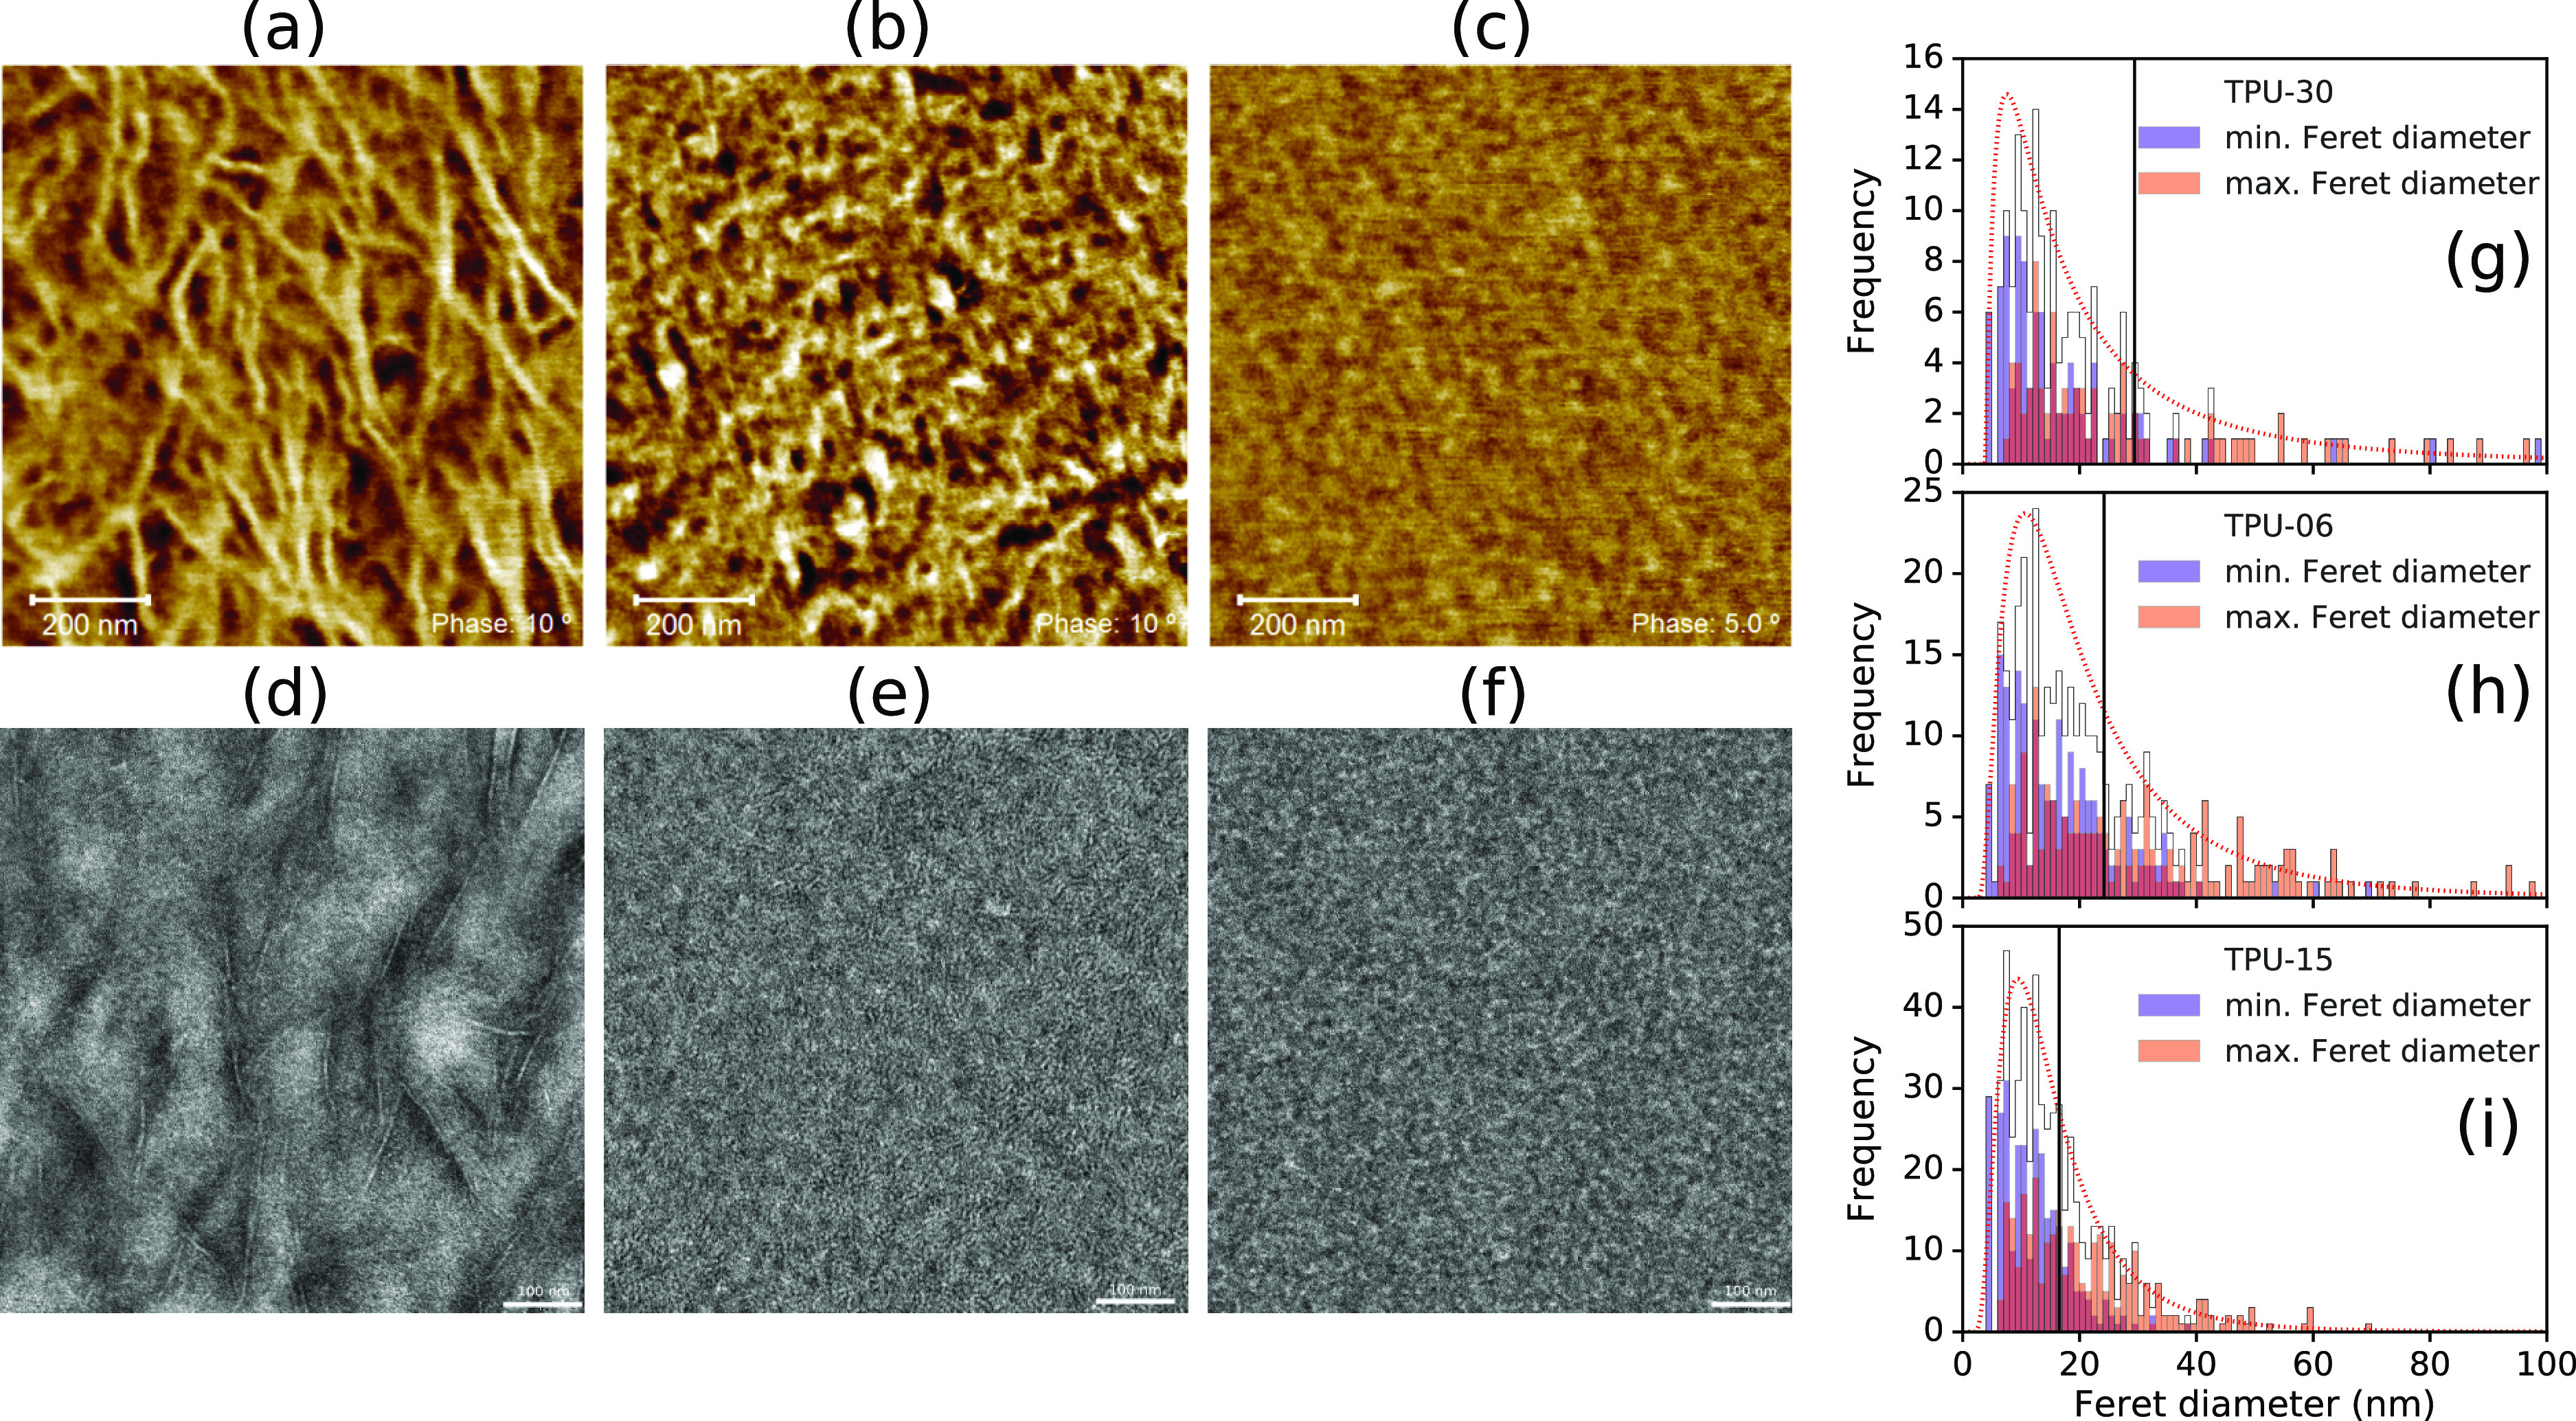
AFM (upper row) and TEM (RuO4 staining) (lower row) images shown for the respective TPU samples: (a,d) TPU-30, (b,e) TPU-06, and (c,f) TPU-15. The respective distributions of minimum and maximum Feret diameters are shown in (g–i) with a single log-normal distribution fitted to the combined data and the distribution mean.
For TEM measurements, noncrystalline and/or lower density content is preferably stained by ruthenium tetroxide (RuO4) to give darker regions, while lighter regions represent denser, more ordered or crystalline content. Preference for staining aromatic moieties, which are present in MDI, can also give contrast between soft and hard domains. The graininess of the images, and apparent overlap/percolation of the ordered regions, make it more difficult to extract specific domains from the images. However, representative dimensions can be extracted by visual inspection, for example, as shown in Figure S4. TEM shows highly anisotropic ordered regions for TPU-30, with widths around 5–6 nm and lengths on the order of ≥100 nm. TPU-06 shows a coarse grained morphology with very fine lamellar structures and more isotropic ordered domains ∼5–20 nm. TPU-15 shows similar domain sizes but lacks any distinct lamellar structuring. A lower contrast between the bright and dark regions suggests increased interfacial thickness between the ordered and disordered regions.
SAXS patterns, as shown in Figure 3a, show a diffraction peak, indicative of microphase segregated morphologies. Peaks show correlations between neighboring hard domains at d-spacings (i.e., long periods) of ∼14.0, 11.2, and 9.3 nm for TPU-30, TPU-06, and TPU-15, respectively, (values vary by analysis method but with consistent trends, see Table S2). Thus, correlated packing of neighboring hard domains must occur along the short-axis length of the domains. Small artefacts in the TPU-30 SAXS curve result from the preferred orientation effects, coinciding with the elongated domain morphology.
Figure 3.

X-ray scattering from the TPU samples is shown over different ranges of momentum transfer, corresponding to different structural length-scales: (a) SAXS, (b) WAXS, and (c) reduced total scattering F(Q).
WAXS patterns, as shown in Figure 3b, show broad diffraction features located at ∼1.0–2.0 Å–1, indicating predominantly amorphous content. Low-intensity, Bragg-like diffraction peaks demonstrate the presence of some ordered content. Small peaks at 0.455 Å–1 for TPU-15 (more diffuse for TPU-30) and 0.83 Å–1 for both samples can be assigned to 020 and 040 reflections for the MDI-BD hard phase with a P21/c symmetry,28 indicating intradomain ordering along the fiber axis and/or possible paracrystalline arrangements of HS.35,36 A similar peak at 0.98 Å–1 for TPU-06 may then indicate fiber axis ordering of aliphatic chains for HDI-BD. Locally ordered chains in the soft phase may also contribute. TPU-30 shows a sharp diffraction peak at 1.365 Å–1 that can be assigned to several reflections related to lateral packing between chains via H-bonding or edge-to-face interacting phenyl groups.28 Despite a similar HSC, TPU-15 is dominated by the amorphous halo, suggesting the hard phase that is either too small, or too poorly ordered, to produce Bragg peaks. TPU-06, on the other hand, shows three sharp diffraction peaks, suggesting a different hard phase structure (i.e., aliphatic isocyanate in the hard phase, not aromatic MDI). The reduced total scattering structure functions F(Q), as shown in Figure 3c, highlight differences in the diffuse scattering, at high-Q, because of the local atomic bonding characteristics imbued by different sample chemistries. See Figures S6 and S7 for further comparisons of I(Q) and F(Q) data.
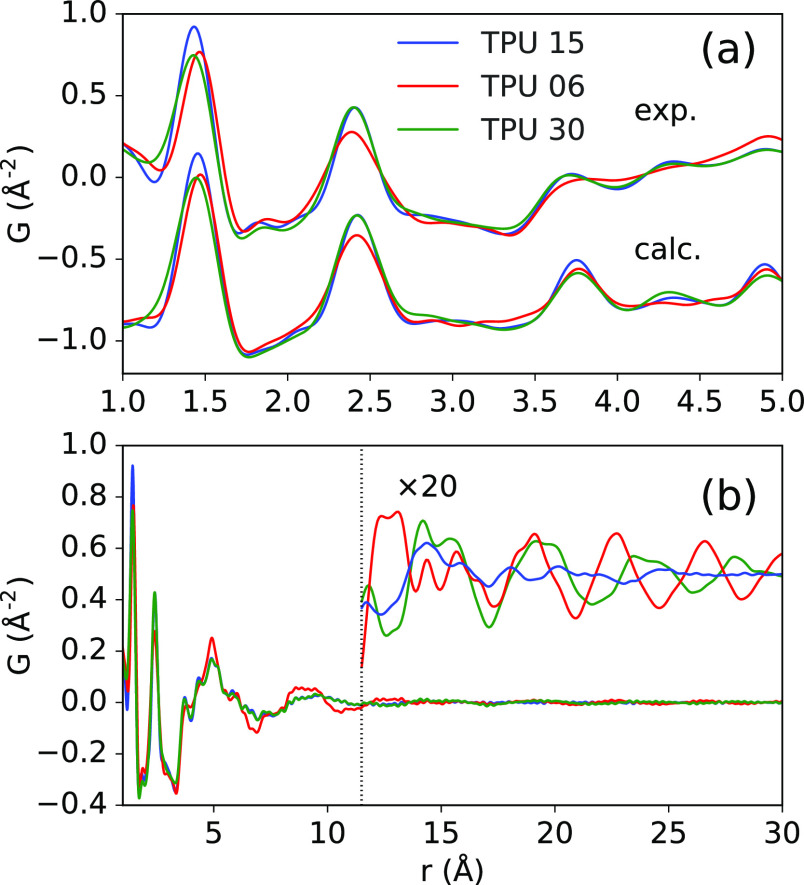
High real-space resolution PDFs from total scattering measurements37−39 at different facilities [beamline 11-ID-B at the advanced photon source (APS) and beamline ID31 at the European Synchrotron Radiation Facility (ESRF)] show that despite differences in radiation energy, detector technology, and sample placement, the results are highly reproducible, as shown in Figure S8 and Table S3. This ensures that slight deviations in the local peak position and shape indicate real changes in sample-specific bonding environments. Peaks associated with the two first nearest-neighbor (NN) pair-distances are shown in Figure 4a.
Figure 4.
Experimental PDFs showing (a) the first few NN coordination environments compared to PDFs calculated from stoichiometric combinations of HS and SS models. PDFs are shown (b) over medium-r showing the chain packing, and smoothed and amplified for comparison at long distances.
The first feature worth noting is the change in the position of the first peak, which represents the distribution of (non-hydrogen) NN bond distances (e.g., C–C, C=C, C–O, C=O, C–N, and C=N). Intensity weighted at shorter-r indicates a larger proportion of double bonds and/or aromatic character, which coincide with the changing chemical constituents here. Therefore, TPU-15 and TPU-30 have similarly shorter NN distributions because of MDI. TPU-30 shows additional weight on the short side corresponding to more C=O double bonds in the Adipic ester. TPU-06 shows a distribution at longer-r because of the aliphatic character of HDI and PTHF. The second NN peak of TPU-06 also has a wider distribution, which could possibly result from a wider distribution of bond angles because of more torsional flexibility of the aliphatic backbone. PDFs calculated from polymerized chains, compared in Figure 4a, show good agreement with the experiment.40 A better agreement of the polymerized chain model PDFs versus summations of individual monomers suggests that the PDFs are also sensitive to bond character modification because of polymerization. Comparison of fits to the first two NN peaks and more information about model calculations can be found in the Supporting Information Section S4.7.
The signals corresponding to medium-range structuring are shown in Figure 4b. All sample signals appear to be dominated by the short-range ordered content. However, with ×20 amplification (and with termination effects reduced by a Lorch function,41 see Supporting Information Section S4.5), a small amount of long-range ordered content can be observed as well. TPU-15 is less well ordered, while TPU-30 and TPU-06 show more distinctive structuring. As both TPU-06 and TPU-15 have the PEOL SS, a significant difference at short distances may indicate that HDI contributes a stronger effect on structuring in the disordered component (more prominent at short distances). The amplitude of the signals from the long-range components are much smaller than would be expected for a 40–50% ordered hard phase, indicating that much of the HSC does not contribute to the ordered domains.
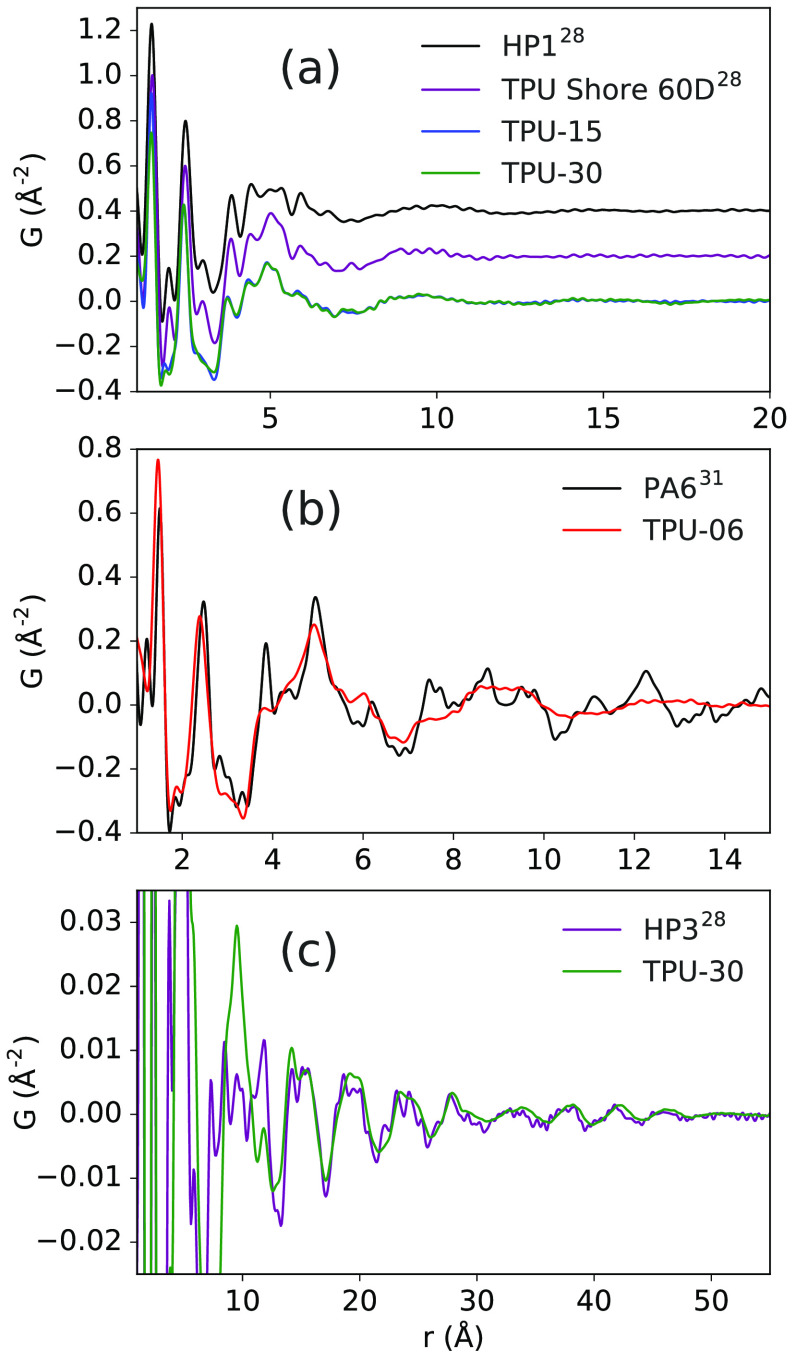
Despite different SS species, TPU-15 and TPU-30 both show similar local chain packing environments up to 17 Å, Figure 5a.
Figure 5.
Comparisons of short- and medium-range order seen in the PDFs: (a) PDFs of TPU-30 and TPU-15 are compared to PDFs measured from previous TPU samples (HP1: 1:1 MDI:BD hard phase, and TPU Shore 60D: 1:0.79:0.21 MDI:BD:PTHF) (note: prior measurements were performed at 100 K).28 The small features around the second NN peak in the previous data are termination effects. (b) TPU-06 is compared to polyamide 6 (PA6).31 (c) The long-range ordered signal in TPU-30 is indexed to the hard phase (HP3: 1:1.2 MDI-BD) measured at NSLS (100 K).28 Data sets in (c) were both processed with Qmax = 15 Å–1 and a Lorch modification for comparison.41
Despite different SS species, TPU-15 (MDI-BD-PTHF) and TPU-30 (MDI-BD-PESOL) show similar local chain packing environments up to 17 Å, Figure 5a. They also both share a similar local structure to TPU Shore 60D with composition 1:0.79:0.21 MDI:BD:PTHF, as well as the MDI-BD model hard phase (HP1), which was found to be amorphous at a 1:1 ratio in a previous study.28 These observations are notable, because it then appears that while we did observe an effect on local ordering due to the presence of SS in the previous study, we do not currently observe a significant local structural effect between the PEOL versus PESOL SS for the current two samples, despite the drastic changes in the morphology and hard domain structure. The presence of some fraction of disordered hard domains is suggested in the current samples, helping to explain the missing hard phase intensity at long distances. The average local ordering in the samples appears to be dominated by the isocyanate and CE components. TPU-06 shows a different short- and medium-r environment with slightly sharper features and higher chain-packing frequency, showing similarity to the PDF of α polyamide 6 (PA6),31 as shown in Figure 5b. The local structures show some similarities in terms of both the positions of sharp features (intramolecular correlations) as well as the wavelength of the lower frequency oscillations (intermolecular chain-chain packing correlations), which may indicate more linear chain packing conformations compared to the zig-zag formations in the MDI-BD phase, even in the short-range ordered component. This is plausible because hydrogen bonding could form between HDI-BD segments in a similar fashion to those between amide linkages in PA6. The sharp features in the PDF of TPU-06 are more broadened than in PA6 (e.g., the third NN peak at approximately 4 Å), which may indicate more torsional freedom than in the antiperiplanar α-PA6. This may arise from bending at the carbamate groups, as suggested by the MMFF94s relaxations. Over medium and long distances, TPU-30 shows the prototypical MDI-BD hard phase structure, as shown in Figure 5c.28,42 This demonstrates that the MDI-BD hard domains can form the same structure as the model hard phase (HP3: 1:1.2 MDI-BD) in the presence of the PTHF SS (i.e., different average local structure) in the case of TPU-30.
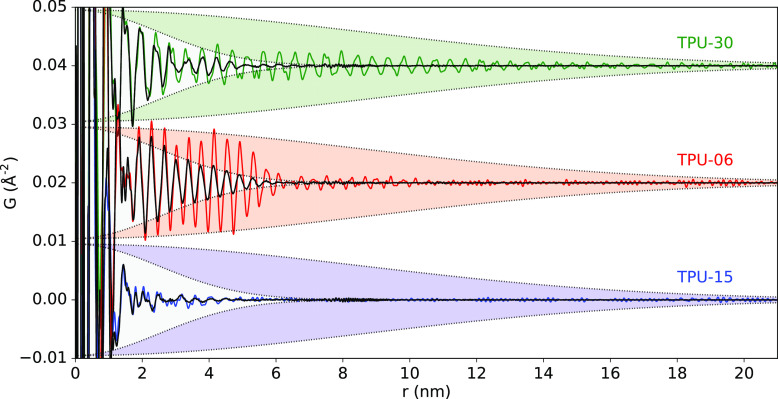
Long-range ordering of the TPUs is shown over the nm range of the synchrotron PDFs, as shown in Figure 6. DDFs obtained from Cu-Kα1 laboratory measurements are overlayed for comparison. These data lack atomic resolution because of their limited Qmax and are not suitable for local structure analysis. However, the peak positions and shapes match very well over long distances. In fact, the increased Q-resolution of the laboratory data here allows for the DDF functions to be assessed over much longer distances43−45 than for the PDFs obtained from typical rapid acquisition measurements with a 2D detector.46 In general, the experimental (e.g., sample, beam, and detection) geometries, X-ray energy, and detector-type all contribute to an instrumental resolution function that describes the ability for the experiment to resolve diffraction features in a reciprocal space. Convolution with a broader resolution function (e.g., increased sample thickness, larger pixels in the detector, shortening the sample-to-detector distance, higher energy, larger beam diameter, etc.) results in broader diffraction patterns. In real-space, this has the effect of multiplying the PDF by the Fourier transform of the reciprocal-space resolution function, leading to increased damping of the signal at long distances. This limits the range over which structural correlations can be observed in the PDF. PDFs measured in rapid acquisition mode46 (the standard setup for synchrotron PDF measurements) have quite low Q-resolution compared to typical XRPD-focused experiments, which is not a problem when the experiment is only concerned with the local structure.
Figure 6.
Long-distance range of PDFs from the rapid acquisition experiment (black) and DDFs from higher Q-resolution lab experiments (color) showing structural correlations over an increased distance.
The resolution of features over longer distances allows information to be extracted from the additional damping effects on the profile due to the domain size and shape profiles, once the instrumental effects have been accounted for (see Supporting Information Section S4.8). Recent studies, for example, have demonstrated comparisons of lab and synchrotron data for polyamide 631 and low- and high-Qmax synchrotron data measured at different detector distances.47 The more complex structural damping profiles for the TPUs here were confirmed using PDFs obtained from a higher resolution measurement (longer sample-to-detector distance and smaller pixel size), using a Pilatus detector from DECTRIS at the ESRF, as shown in Figures S12 and S13. For TPU-30, the profile smoothly damps with increasing r. Large, long-range ordered domains extend up to ≥20 nm. For TPU-06, a higher concentration population of domains are ordered up to 6 nm, and then a lower concentration population of domains appear ordered up to ≥11.0 nm. The damping profile for TPU-15 is nearly identical for both PDF and DDF data, indicating that the coherence in this case is not resolution limited, and the hard domains are only ordered up to ∼5–7.5 nm. The amorphous phases were estimated at 13/14/19 Å for TPU-15/30/06, respectively, which is in good agreement with the previously determined MDI-BD-PTHF disordered phase (18 Å).28
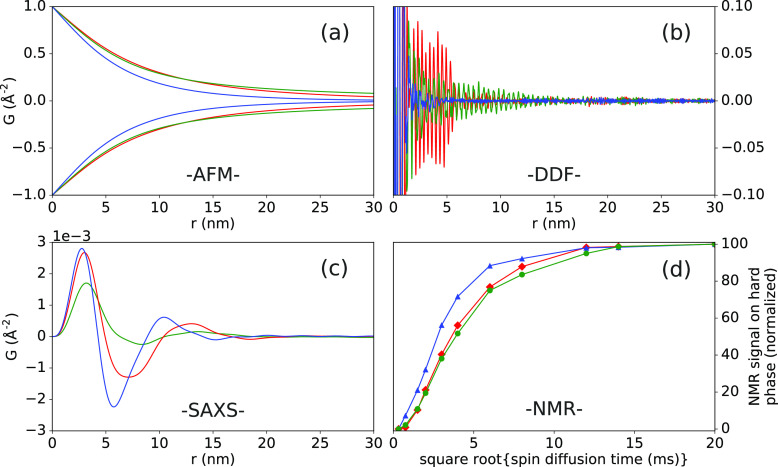
Information on size and morphological distributions obtained from AFM, DDF, SAXS, and NMR are compared, as shown in Figure 7. G(r) attenuation profiles were approximated from the AFM Feret diameter distributions of hard and soft phase separation; see Supporting Information Section S4.9 for details. The aggregated attenuation profiles, as shown in Figure 7a, can be compared directly to DDFs, as shown in Figure 7b, which show the signals from the polymer chain packing within the ordered hard domains. The AFM measurements are optimized for viewing hard and soft phase separation, so the regions visualized can be much larger than, and aggregates of, the coherent ordered domains observed with DDF. The apparent resolution of hard domains by AFM can also be affected by tapping force, tip geometry, Q factor, environment, and so forth.48 Overall trends between AFM and DDF are still in good agreement. TPU-15, with signals dying out most quickly, has the smallest aggregate hard regions comprised of small isotropic ordered domains. TPU-30 shows a more gradual signal damping which extends to much longer distances, as it has both larger and more anisotropic hard regions and crystallites.49−52 TPU-06 is intermediate to the other two samples, with a larger concentration of well ordered, isotropic hard regions and a small population with larger dimensions. The increased HSC has previously been shown to increase the amount of light-colored regions and the distinction between light/dark regions, indicating a decrease in interfacial thickness that is consistent with what is currently observed for the TPU samples here.48 Interlocking, connected morphologies of TPU hard domains have also been noted and suggested to be favorable on exceeding a HSC of 25 wt %,9 and at a certain HSC, there can even be phase inversion. In future implementations, PDF/DDF measurements could potentially be used as a reference for tuning the AFM measurement parameters to optimize resolution to discriminate crystallite domains.
Figure 7.
Domain size information by different techniques for TPU-30 (green), TPU-06 (red), and TPU-15 (blue): (a) real-space G(r) damping profiles calculated from Feret diameter distributions measured by AFM, (b) DDFs showing chain-chain packing correlations within ordered hard domains and damped according to domain morphology and size distribution, (c) G(r) from SAXS showing correlation between hard domains, and (d) NMR 1H–1H spin-diffusion from the soft to hard domain.
G(r) functions obtained by the Fourier transformation of the SAXS53−55 are shown in Figure 7c. Here, peaks represent roughly the probability that a vector with magnitude r has both ends in a region of similar density, with respect to the average atomic density. This was compared to other correlation functions typically used in SAXS analysis (calculated using SasView,56 see Supporting Information Section S3.1).57−59 Given the apparent isotropism of TPU-06 and TPU-15, and the branch-like structures in TPU-30, the assumptions made by the 1D correlation function and associated interface distribution function are probably not suitable.1,60 The average domain thickness was estimated by extrapolation of the self-correlation in the 3D correlation functions as 4.3 (TPU-30), 4.4 (TPU-06), and 3.5 nm (TPU-15).61 Regarding the smaller value estimates for the domain sizes from SAXS versus PDF: the scattering contrast in SAXS comes from the variations in electron density between phases. For PDF, the contrast comes from the higher resolution ordering of electron density within the phases. Therefore, it is possible that complex interfacial regions, not easily accounted for in the SAXS estimate, may contain molecular ordering that extends the observed domain size in the PDFs. The SAXS estimates may also be complicated by inhomogeneity and distributions of structural properties. If the domain sizes are estimated by the minimum in both the 3D correlation function and G(r), we obtain consistent values which agree better with the PDF and microscopy results. Thus, the linear extension method for the SAXS estimate may simply not rely on suitable assumptions here.
Domain size information was also obtained through 1H–1H spin-diffusion solid-state NMR, as measured by 13C-detection (see Supporting Information Section S5).10−12Figure 7d shows the amount of NMR polarization diffusing from the soft phase to hard phase as a function of diffusion time. All samples show relatively fast buildups, which are in line with a short-axis length of <10 nm, although dimensionality has an effect that is difficult to define for the inhomogeneous and distributed domains in this case. TPU-15 shows the fastest signal buildup over spin-diffusion time, while TPU-06 and TPU-30 show a similarly slower build-up of polarization on the hard phase. To a first approximation, the NMR signal buildup correlates well with the graining of the hard/soft phase from AFM and TEM images, packing of hard phases from SAXS, and the average crystallite coherence from PDF. According to the NMR buildup, there must be more interface between the hard and soft phases in TPU-15 compared to TPU-06 and TPU-30. TPU-06 and TPU-30 have similar spin-diffusion buildup characteristics, that is, a comparable amount of polarization exchange between the hard and soft matrix. Thus, while lamellar structures and superstructures of TPU-06 and TPU-30 look different by microscopy, the total amount of the interface must be similar. This is in better agreement with the PDF/DDF analysis which shows that the distribution of actual coherent ordered domain dimensions is weighted more toward sizes in the 5–10 nm range (also in agreement with TEM and SAXS), rather than the larger hard regions observed by AFM/TEM. Notably, the NMR data correlate especially well with the grouping of samples according to the mean Feret diameters, though further investigations would be necessary to detail how the length should be compared in systems with nonspherical domains.
Formally, it is possible to calculate a hard-phase domain size from the NMR data.10,11 This requires the dimensionality of the phases (i.e., ϵ = 1 for lamellae, ϵ = 2 for fibers, and ϵ = 3 for spheres, or combinations thereof) to be known over a representative volume, the influence of superstructures to the interphase spin-diffusion to be negligible, and the spin-diffusion constant to be quantitatively transferable from a measurement of a reference material. This is typically only the case for very well-understood materials. Here, a complex mixture of dimensionalities and length scales, including lamellae and superstructures, are observed, and the spin-diffusion coefficient has not been determined precisely, making it difficult to infer the hard phase diameter or thickness from the signal buildup curves.
It should be noted that 13C-detected solid-state NMR experiments, as employed here, are relatively time-consuming. Approaches using much more sensitive, and thus faster, 1H-only detection (omitting 13C entirely) have been implemented, requiring careful calibration of spin-diffusion constants.62 Such experiments may be used to screen a larger series of similar samples, for example, for quality control purposes, with high-field or even benchtop NMR devices when sufficient information from other sources has been used to establish a sound understanding of the material class.
3. Conclusions
Here, we have demonstrated PDF analysis of local ordering and domain structure/morphology in several TPU samples. The high real-space resolution data obtained from synchrotron total scattering measurements gave unique fingerprints for different chemistries and structuring of ordered and disordered phases. Additionally, the similarity between the PDFs here and for previous TPU model hard phases, and the disproportionately low intensities of the long-range ordered content, show that there is a large concentration of disordered hard domains coexisting with larger, long-range ordered domains, despite all three showing different structures. In combination with TEM, AFM, SAXS, and 1H–1H spin-diffusion solid-state NMR, we determined that the ordered domains in all samples have similarly characteristic short-axis lengths on the order of 5–10 nm, regardless of the presence or absence, and isotropy or anisotropy, of lamellae formation over larger length-scales. Furthermore, the larger domain size distribution characteristics observed in real-space correlate well with the hard phase morphologies observed by AFM and TEM imaging techniques.
Additionally, we showed that PDFs from high Q-resolution total scattering data, and even DDFs measured from laboratory diffractometers, can bridge information about size and shape distributions of the hard domains with the internal arrangement of molecular chains. The use of Cu-Kα1 radiation is not suitable for proper atomic PDF analysis.63 However, despite the loss of atomic resolution, suitable density–density correlations between polymer chains packed into nanocrystalline or paracrystalline domains could still be extracted, over wider distances than typical rapid acquisition synchrotron experiments, allowing for increased sensitivity to changes in domain structuring, morphology, and/or the presence of size distributions.
In future experiments, the use of PDF/DDF measurements could help to optimize imaging and spectroscopic measurement protocols for specific observables. Overall, the complementarity between different probes of the morphology and internal structure motivate further use of these data for quantitative, multiscale complex modeling.64
Acknowledgments
M.W.T. gratefully acknowledges support from BASF. SAXS experiments were performed at the NCD-SWEET beamline at ALBA Synchrotron with the collaboration of ALBA staff. This research used beamline 11-ID-B of the APS, a U.S. Department of Energy (DOE) Office of Science User Facility operated for the DOE Office of Science by Argonne National Laboratory under contract no. DE-AC02-06CH11357. The authors thank Olaf Borkiewicz and Kevin Beyer for assistance at 11-ID-B, and Anton Kovyakh for help measuring samples. Agnieszka Poulain is thanked for assistance with additional experiments performed on beamline ID-31 at the ESRF, Grenoble, France. Ronald Walter and Thomas Frechen are thanked for TEM measurements, and Ute Heinemeyer is thanked for helpful comments on TEM analysis. Christian Schneider is thanked for help with lab standard preparation.
Supporting Information Available
The Supporting Information is available free of charge at https://pubs.acs.org/doi/10.1021/acs.macromol.0c01557.
Further details of AFM, TEM, and SAXS measurements and analysis; X-ray and total scattering experimental details; data processing; molecular modeling procedure; experimental resolution effects; experimental information for 1H–1H spin-diffusion solid-state NMR; and detailed NMR resonance assignments (PDF)
The authors declare no competing financial interest.
Supplementary Material
References
- Koberstein J. T.; Stein R. S. Small-angle X-ray scattering studies of microdomain structure in segmented polyurethane elastomers. J. Polym. Sci., Polym. Phys. Ed. 1983, 21, 1439–1472. 10.1002/pol.1983.180210814. [DOI] [Google Scholar]
- Laity P. R.; Taylor J. E.; Wong S. S.; Khunkamchoo P.; Norris K.; Cable M.; Andrews G. T.; Johnson A. F.; Cameron R. E. A review of small-angle scattering models for random segmented poly(ether-urethane) copolymers. Polymer 2004, 45, 7273–7291. 10.1016/j.polymer.2004.08.033. [DOI] [Google Scholar]
- Dencheva N.; Stribeck A.; Denchev Z. Nanostructure development in multicomponent polymer systems characterized by synchrotron x-ray scattering. Eur. Polym. J. 2016, 81, 447–469. 10.1016/j.eurpolymj.2016.02.004. [DOI] [Google Scholar]
- Martin D. C.; Thomas E. L. Experimental high-resolution electron microscopy of polymers. Polymer 1995, 36, 1743–1759. 10.1016/0032-3861(95)90922-o. [DOI] [Google Scholar]
- Ivanov D. A.; Lipnik P. D. M.; Jonas A. M. Transmission electron microscopy studies on selectively stained poly(aryl-ether-ketone)/poly(ether-imide) semicrystalline blends. J. Polym. Sci., Polym. Phys. Ed. 1997, 35, 2565–2570. . [DOI] [Google Scholar]
- Libera M. R.; Egerton R. F. Advances in the Transmission Electron Microscopy of Polymers. Polym. Rev. 2010, 50, 321–339. 10.1080/15583724.2010.493256. [DOI] [Google Scholar]
- Collin B.; Chatenay D.; Coulon G.; Ausserre D.; Gallot Y. Ordering of copolymer thin films as revealed by atomic force microscopy. Macromolecules 1992, 25, 1621–1622. 10.1021/ma00031a042. [DOI] [Google Scholar]
- Garret J. T.; Siedlecki C. A.; Runt J. Microdomain morphology of poly(urethane urea) multiblock copolymers. Macromolecules 2001, 34, 7066–7070. [Google Scholar]
- Aneja A.; Wilkes G. L. A systematic series of “model” PTMO based segmented polyurethanes reinvestigated using atomic force microscopy. Polymer 2003, 44, 7221–7228. 10.1016/j.polymer.2003.07.007. [DOI] [Google Scholar]
- Clauss J.; Schmidt-Rohr K.; Spiess H. W. Determination of domain sizes in heterogeneous polymers by solid-state NMR. Acta Polym. 1993, 44, 1–17. 10.1002/actp.1993.010440101. [DOI] [Google Scholar]
- Schmidt-Rohr K.; Spiess H. W.. Multidimensional Solid-State NMR and Polymers; Academic Press: London, 1994. [Google Scholar]
- Servay T.; Voelkel R.; Schmiedberger H.; Lehmann S. Thermal oxidation of the methylene diphenylene unit in MDI-TPU. Polymer 2000, 41, 5247–5256. 10.1016/s0032-3861(99)00743-0. [DOI] [Google Scholar]
- Voda M. A.; Demco D. E.; Voda A.; Schauber T.; Adler M.; Dabisch T.; Adams A.; Baias M.; Blümich B. Morphology of thermoplastic polyurethanes by 1H spin-diffusion NMR. Macromolecules 2006, 39, 4802–4810. 10.1021/ma060335m. [DOI] [Google Scholar]
- Saalwächter K. Proton multiple-quantum NMR for the study of chain dynamics and structural constraints in polymeric soft materials. Prog. Nucl. Magn. Reson. Spectrosc. 2007, 51, 1–35. 10.1016/j.pnmrs.2007.01.001. [DOI] [Google Scholar]
- Mokeev M. V.; Ostanin S. A.; Saprykina N. N.; Zuev V. V. Microphase structure of polyurethane-polyurea copolymers as revealed by solid-state NMR: effect of molecular architecture. Polymer 2018, 150, 72–83. 10.1016/j.polymer.2018.07.014. [DOI] [Google Scholar]
- Zhou H.; Wilkes G. L. Comparison of lamellar thickness and its distribution determined from d.s.c., SAXS, TEM and AFM for high-density polyethylene films having a stacked lamellar morphology. Polymer 1997, 38, 5735–5747. 10.1016/s0032-3861(97)00145-6. [DOI] [Google Scholar]
- Ivanov D. A.; Amalou Z.; Magonov S. N. Real-time evolution of the lamellar organization of poly(ethyele terepthalate) during crystallization from the melt: high-temperature atomic force microscopy study. Macromolecules 2001, 34, 8944–8952. 10.1021/ma010809b. [DOI] [Google Scholar]
- Haubruge H. G.; Gallez X. A.; Nysten B.; Jonas A. M. Image analysis of transmission electron micrographs of semicrystalline polymers: a comparison with X-ray scattering results. J. Appl. Crystallogr. 2003, 36, 1019–1025. 10.1107/s0021889803009087. [DOI] [Google Scholar]
- Powder Diffraction: Theory and Practice; Dinnebier R. E., Billinge S. J. L., Eds.; Royal Society of Chemistry: London, England, 2008. [Google Scholar]
- Flory P. J.; Yoon D. Y. Molecular morphology in semicrystalline polymers. Nature 1978, 272, 226–229. 10.1038/272226a0. [DOI] [Google Scholar]
- Hosemann R.; Hindeleh A. M. Structure of crystalline and paracrystalline condensed matter. J. Macromol. Sci., Phys. 1995, 34, 327–356. 10.1080/00222349508219497. [DOI] [Google Scholar]
- Egami T.; Billinge S. J. L.. Underneath the Bragg Peaks: Structural Analysis of Complex Materials, 2nd ed.; Elsevier: Amsterdam, 2012. [Google Scholar]
- Billinge S. J. L. Nanometer scale structure from powder diffraction: total scattering and atomic pair distribution function analysis. IUCr Newsl. 2019, 649–672. 10.1107/97809553602060000972. [DOI] [Google Scholar]
- Elliott S. R. Medium-range structural order in covalent amorphous solids. Nature 1991, 354, 445–452. 10.1038/354445a0. [DOI] [Google Scholar]
- Simard G. L.; Warren B. E. X-ray study of amorphous rubber. J. Am. Chem. Soc. 1936, 58, 507–509. 10.1021/ja01294a034. [DOI] [Google Scholar]
- Narten A. H.; Habenschuss A.; Xenopoulos A. Diffraction and structure of amorphous and crystalline regions in semicrystalline nylon 6.6. polymer 1991, 32, 1923–1927. 10.1016/0032-3861(91)90153-a. [DOI] [Google Scholar]
- Winokur M. J.; Mattes B. R. Determination of the local molecular structure in amorphous polyaniline. Phys. Rev. B 1996, 54, R12637–R12640. 10.1103/physrevb.54.r12637. [DOI] [PubMed] [Google Scholar]
- Terban M. W.; Dabbous R.; Debellis A. D.; Pöselt E.; Billinge S. J. L. Structures of hard phases in thermoplastic polyurethanes. Macromolecules 2016, 49, 7350–7358. 10.1021/acs.macromol.6b00889. [DOI] [Google Scholar]
- Pütz A. M.; Terban M. W.; Bette S.; Haase F.; Dinnebier R. E.; Lotsch B. V. Total scattering reveals the hidden stacking disorder in a 2D covalent organic framework. Chem. Sci. 2020, 10.1039/D0SC03048A. [DOI] [PMC free article] [PubMed] [Google Scholar]
- Grunenberg L.; Savasci G.; Terban M. W.; Duppel V.; Moudrakovski I.; Etter M.; Dinnebier R. E.; Ochsenfeld C.; Lotsch B. V.. Amine-linked covalent organic frameworks as a powerful platform for post-synthetic modification: structure interconversion and combined linkage- and pore-wall-modification. 2020, ChemRxiv Preprint: https://doi.org/10.26434/chemrxiv.12985907.v1. [Google Scholar]
- Terban M. W.; Pütz A. M.; Savasci G.; Heinemeyer U.; Hinrichsen B.; Desbois P.; Dinnebier R. E. Improving the picture of atomic structure in nonoriented polymer domains using the pair distribution function: a study of polyamide 6. J. Polym. Sci. 2020, 58, 1843–1866. 10.1002/pol.20190272. [DOI] [Google Scholar]
- Stribeck A.; Li X.; Zeinolebadi A.; Pöselt E.; Eling B.; Funari S. Morphological Changes under Strain for Different Thermoplastic Polyurethanes Monitored by SAXS Related to Strain at Break. Macromol. Chem. Phys. 2015, 216, 2318–2330. 10.1002/macp.201500255. [DOI] [Google Scholar]
- Schneider C. A.; Rasband W. S.; Eliceiri K. W. NIH Image to ImageJ: 25 years of image analysis. Nat. Methods 2012, 9, 671–675. 10.1038/nmeth.2089. [DOI] [PMC free article] [PubMed] [Google Scholar]
- Wagner T.; Eglinger J.= Thorstenwagner/ij-Particlesizer: v1.0.9 Snapshot Release, version v1.0.9-SNAPSHOT; Zenodo, 2017; June 28.
- Bonart R. X-ray investigations concerning the physical structure of cross-linking in segmented urethane elastomers. J. Macromol. Sci., Phys. 1968, 2, 115–138. 10.1080/00222346808212867. [DOI] [Google Scholar]
- Bonart R.; Morbitzer L.; Hentze G. X-ray investigations concerning the physical structure of cross-linking in urethane elastomers. II. Butanediol as chain extender. J. Macromol. Sci., Phys. 1969, 3, 337–356. 10.1080/00222346908205099. [DOI] [Google Scholar]
- Ashiotis G.; Deschildre A.; Nawaz Z.; Wright J. P.; Karkoulis D.; Picca F. E.; Kieffer J. The fast azimuthal integration Python library: pyFAI. J. Appl. Crystallogr. 2015, 48, 510–519. 10.1107/S1600576715004306. [DOI] [PMC free article] [PubMed] [Google Scholar]
- Juhás P.; Davis T.; Farrow C. L.; Billinge S. J. L. A rapid and highly automatable program for processing powder diffraction data into total scattering pair distribution functions. J. Appl. Crystallogr. 2013, 46, 560–566. 10.1107/s0021889813005190. [DOI] [Google Scholar]
- Yang X.; Juhás P.; Farrow C.; Billinge S. J. L.. xPDFsuite: an end-to-end software solution for high throughput pair distribution function transformation, visualization and analysis. 2015, arXiv preprint arXiv:1402.3163. [Google Scholar]
- Halgren T. A. MMFF VI. MMFF94s option for energy minimization studies. J. Comput. Chem. 1999, 20, 720–729. . [DOI] [PubMed] [Google Scholar]
- Lorch E. Neutron diffraction by germania, silica and radiation-damaged silica glasses. J. Phys. C: Solid State Phys. 1969, 2, 229–237. 10.1088/0022-3719/2/2/305. [DOI] [Google Scholar]
- Blackwell J.; Gardner K. H. Structure of the hard segments in polyurethane elastomers. Polymer 1979, 20, 13–17. 10.1016/0032-3861(79)90035-1. [DOI] [Google Scholar]
- Peterson P. F.; Božin E. S.; Proffen T.; Billinge S. J. L. Improved measures of quality for atomic pair distribution functions. J. Appl. Crystallogr. 2003, 36, 53. 10.1107/s0021889802018708. [DOI] [Google Scholar]
- Qiu X.; Božin E. S.; Juhás P.; Proffen T.; Billinge S. J. L. Reciprocal space instrumental effects on the real space neutron atomic pair distribution function. J. Appl. Crystallogr. 2004, 37, 110–116. 10.1107/s0021889803026670. [DOI] [Google Scholar]
- Olds D.; Saunders C. N.; Peters M.; Proffen T.; Neuefeind J.; Page K. Precise implications for real-space pair distribution function modeling of effects intrinsic to modern time-of-flight neutron diffractometers. Acta Crystallogr. A 2018, 74, 293–307. 10.1107/s2053273318003224. [DOI] [PubMed] [Google Scholar]
- Chupas P. J.; Qiu X.; Hanson J. C.; Lee P. L.; Grey C. P.; Billinge S. J. L. Rapid acquisition pair distribution function analysis (RA-PDF). J. Appl. Crystallogr. 2003, 36, 1342–1347. 10.1107/s0021889803017564. [DOI] [Google Scholar]
- Terban M. W.; Russo L.; Pham T. N.; Barich D. H.; Sun Y. T.; Burke M. D.; Brum J.; Billinge S. J. L. Local structural effects due to micronization and amorphization on an HIV treatment active pharmaceutical ingredient. Mol. Pharm. 2020, 17, 2370–2389. 10.1021/acs.molpharmaceut.0c00122. [DOI] [PubMed] [Google Scholar]
- Garrett J. T.; Lawrey B. D.; Wilkes G. L. Microdomain morphology of poly(urethane urea) multiblock copolymers. Macromolecules 2001, 34, 7066–7070. 10.1021/ma0102114. [DOI] [Google Scholar]
- Howell R. C.; Proffen T.; Conradson S. D. Pair distribution function and structure factor of spherical particles. Phys. Rev. B 2006, 73, 094107. 10.1103/physrevb.73.094107. [DOI] [Google Scholar]
- Lei M.; de Graff A. M. R.; Thorpe M. F.; Wells S. A.; Sartbaeva A. Uncovering the intrinsic geometry from the atomic pair distribution function of nanomaterials. Phys. Rev. B 2009, 80, 024118. 10.1103/physrevb.80.024118. [DOI] [Google Scholar]
- Kodama K.; Iikubo S.; Taguchi T.; Shamoto S.-i. Finite size effects of nanoparticles on the atomic pair distribution functions. Acta Crystallogr. A 2006, 62, 444–453. 10.1107/s0108767306034635. [DOI] [PubMed] [Google Scholar]
- Gamez-Mendoza L.; Terban M. W.; Billinge S. J. L.; Martinez-Inesta M. Modelling and validation of particle size distributions of supported nanoparticles using the pair distribution function technique. J. Appl. Crystallogr. 2017, 50, 741–748. 10.1107/S1600576717003715. [DOI] [Google Scholar]
- Franklin R. E. The interpretation of diffuse X-ray diagrams of carbon. Acta Crystallogr. 1950, 3, 107–121. 10.1107/s0365110x50000264. [DOI] [Google Scholar]
- Benmore C. J.; Alderman O. L. G.; Robinson D.; Jennings G.; Tamalonis A.; Ilavsky J.; Clark E.; Soignard E.; Yarger J. L.; Weber J. K. R. Extended range X-ray pair distribution functions. Nucl. Instrum. Methods Phys. Res., Sect. A 2020, 955, 163318. 10.1016/j.nima.2019.163318. [DOI] [Google Scholar]
- Liu C.-H.; Janke E. M.; Li R.; Juhás P.; Gang O.; Talapin D. V.; Billinge S. J. L. sasPDF: pair distribution function analysis of nanoparticle assemblies from small-angle scattering. J. Appl. Crystallogr. 2020, 53, 699–709. 10.1107/s1600576720004628. [DOI] [PMC free article] [PubMed] [Google Scholar]
- SasView 5.0.2 documentation. https://www.sasview.org/docs/user/qtgui/Perspectives/Corfunc/corfunc\_help.html (accessed 13th June, 2020).
- Vonk C. G.; Kortleve G. X-ray small-angle scattering of bulk polyethylene. Colloid Polym. Sci. 1967, 220, 19–24. 10.1007/bf02086052. [DOI] [Google Scholar]
- Méring J.; Tchoubar D. Interprétation de la diffusion centrale des rayons X par les systèmes poreux. I. J. Appl. Crystallogr. 1968, 1, 153–165. 10.1107/s0021889868005212. [DOI] [Google Scholar]
- Ruland W. The evaluation of the small-angle scattering of lamellar two-phase systems by means of interface distribution functions. Colloid Polym. Sci. 1977, 255, 417–427. 10.1007/bf01536457. [DOI] [Google Scholar]
- Stribeck N.; Ruland W. Determination of the interface distribution function of lamellar two-phase systems. J. Appl. Crystallogr. 1978, 11, 535–539. 10.1107/s0021889878013813. [DOI] [Google Scholar]
- Strobl G. R.; Schneider M. Direct evaluation of the electron density correlation function of partially crystalline polymers. J. Polym. Sci., Polym. Phys. Ed. 1980, 18, 1343–1359. 10.1002/pol.1980.180180614. [DOI] [Google Scholar]
- Mellinger F.; Wilhelm M.; Spiess H. W. Calibration of 1H NMR spin diffusion coefficients for mobile polymers through transverse relaxation measurements. Macromolecules 1999, 32, 4686–4691. 10.1021/ma9820265. [DOI] [Google Scholar]
- Dykhne T.; Taylor R.; Florence A.; Billinge S. J. L. Data requirements for the reliable use of atomic pair distribution functions in amorphous pharmaceutical fingerprinting. Pharmaceut. Res. 2011, 28, 1041–1048. 10.1007/s11095-010-0350-0. [DOI] [PubMed] [Google Scholar]
- Juhás P.; Farrow C. L.; Yang X.; Knox K. R.; Billinge S. J. L. Complex Modeling: a strategy and software program for combining multiple information sources to solve ill-posed structure and nanostructure inverse problems. Acta Crystallogr. A 2015, 71, 562–568. 10.1107/s2053273315014473. [DOI] [PubMed] [Google Scholar]
Associated Data
This section collects any data citations, data availability statements, or supplementary materials included in this article.


