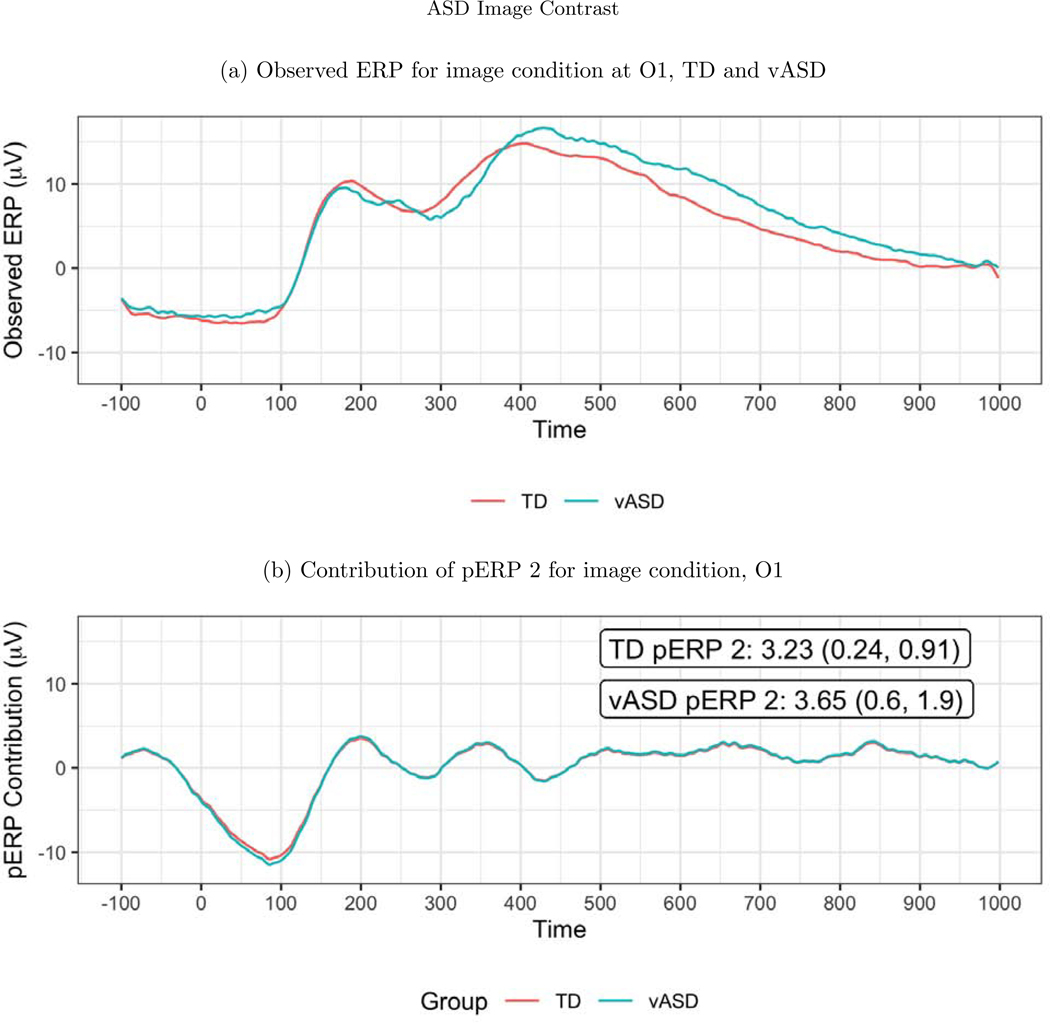
Figure 9:
(a) The observed average ERP waveform for the image condition, by group. No N1 is evident. (b) ERP reconstructed using only pERP2, i.e. pERP 2 scaled by its contribution to the waveform (O1 plotted here). This component is detected despite the apparent lack of an N1 in the overall ERP because we also identify and model pERP 1, which captures spillover from the prior trial. The numbers shown are the mean weight with SE, and APSD in parentheses. The APSD reflects the subject variability and is much larger in the vASD group. Thus the vASD group has an average response very similar to that of the TD group, but there is a great deal more variability in the vASD group.

