

Supplemental Digital Content is available in the text.
Background:
Longitudinal studies of environmental hazards often rely on exposure estimated at the participant’s enrollment residence. This could lead to exposure misclassification if participants move over time.
Methods:
We evaluated residential mobility in the Iowa Women’s Health Study (age 55–69 years) over 19 years of follow-up (1986–2004). We assessed several environmental exposures of varying spatial scales at enrollment and follow-up addresses. Exposures included average nitrate concentrations in public water supplies, percent of agricultural land (row crops and pasture/hay) within 750 m, and the presence of concentrated animal feeding operations within 5 km. In comparison to gold standard duration–based exposures averaged across all residences, we evaluated the sensitivity and specificity of exposure metrics and attenuation bias for a hypothetical nested case–control study of cancer, which assumed participants did not move from their enrollment residence.
Results:
Among 41,650 participants, 32% moved at least once during follow-up. Mobility was predicted by working outside the home, being a former/current smoker, having a higher education level, using a public drinking water supply, and town size of previous residence. Compared with duration-based exposures, the sensitivity and specificity of exposures at enrollment ranged from 94% to 99% and 97% to 99%, respectively. A hypothetical true odds ratio of 2.0 was attenuated 8% for nitrate, 9%–10% for agricultural land, and 6% for concentrated animal feeding operation exposures.
Conclusions:
Overall, we found low rates of mobility and mobility-related exposure misclassification in the Iowa Women’s Health Study. Misclassification and attenuation of hypothetical risk estimates differed by spatial variability and exposure prevalence.
What this study adds.
Our findings that mobility was predicted by smoking status, place of work, education level, drinking water source, and town size in the Iowa Women’s Health Study add to limited previous knowledge about mobility patterns in older, rural populations. We showed modest attenuation bias due to mobility-related exposure misclassification and demonstrated that such misclassification can increase with duration of the exposure period, greater spatial variability in the exposure, and lower exposure prevalence. These findings suggest that misclassification and subsequent attenuation bias in epidemiologic studies of long-term exposure to environmental factors can be mitigated by incorporating residential moves.
Introduction
Many prospective cohort studies use the participants’ address at study enrollment to estimate environmental exposures over time.1–9 However, if participants change residences during the follow-up period and these changes are not accounted for, epidemiologic analyses may be subject to exposure misclassification and subsequent bias. Mobility-related misclassification may be greater for studies that require estimation of exposures over long periods of time, as needed in evaluating risk of chronic diseases like cancer. The rate of mobility will also depend on the population of interest and can vary by demographics, lifestyle, and other characteristics.10–15 The effects of residential mobility on epidemiologic inference can be magnified for exposures that have low prevalence and high spatial variability.10,12,16–18
A few cohort studies estimating exposure to outdoor air pollution have investigated the impact of residential mobility on epidemiologic associations and reported varying degrees of exposure misclassification and resultant bias.11,19–23 A retrospective (Canada) and prospective (Sweden) exposure assessment of various air pollutants found high correlations (r = 0.70–0.80) between estimated exposure at enrollment and across all addresses for the exposure period.19,22 However, Hystad et al.19 showed that despite high correlation, about half of individuals were misclassified into different exposure quintiles. Only some of the aforementioned studies quantified the impact of mobility on the exposure–disease relationship.11,21,23 Additional studies are needed to evaluate mobility-related misclassification of environmental exposures beyond air pollution, and in rural areas, as previous studies are limited to urban settings.
The Iowa Women’s Health Study (IWHS) is a cohort of postmenopausal women in which several investigations on cancer have used the enrollment address as the basis for historical exposure assessment of environmental risk factors.1,4–6,24–27 Since residential histories were not collected in this study, we aimed to describe residential mobility and population characteristics related to mobility using address data collected over 19 years of follow-up. We estimated mobility-related exposure misclassification and subsequent bias in risk estimates for several environmental exposures.
Materials and methods
Study population
The IWHS is a population-based prospective cohort of 41,836 postmenopausal women enrolled in 1986 and followed for cancer incidence and mortality. Study enrollment and data collection have been described.28 Briefly, women aged 55–69 years were randomly selected from valid Iowa driver’s licenses and mailed an enrollment survey to collect information about dietary intake, demographics, family history of cancer, and medical and reproductive history. The participation rate at enrollment was 42%; response rates among living subjects for five follow-up surveys mailed in 1987, 1989, 1992, 1997, and 2004 were 91%, 89%, 83%, 79%, and 68%, respectively. The Institutional Review Boards of the University of Minnesota and University of Iowa approved the IWHS.
Residential mobility
We excluded 186 participants whose date of death was before the first follow-up (1987), because no prospective mobility information was available for these individuals. Mobility was assessed for the remaining 41,650 (99.6%) IWHS participants. Participant address information was collected over a 19-year period from enrollment (1986) and at the five follow-up surveys, with the last information collected in 2004. Addresses were also updated through routine tracing efforts and linkages with cancer and death registries for each follow-up period. We did not trace additional moves between survey periods. Addresses were geocoded as latitude and longitude coordinates with ArcGIS (v. 9.3). Geocoded addresses were linked to US Census 2000 Incorporated Places boundaries to describe town size for addresses within an incorporated place (population <10,000, 10,000 to <100,000, or ≥100,000) or otherwise categorized as an unincorporated place. We defined “well-geocoded” addresses as geocodes placed at the complete street address or nearest intersection.29 Overall, 78% of enrollment addresses were well-geocoded; poorer geocode rates were observed for unincorporated places (eTable 1; http://links.lww.com/EE/A105). We censored addresses for follow-up surveys following death (n = 10,823 total deaths before 2004). We assessed residential mobility for each follow-up period by comparing address pairs between each consecutive survey. Among well-geocoded addresses, a move was defined when the distance between addresses was greater than 250 m, a distance selected to account for positional error, a frequently observed phenomenon especially among rural addresses.30,31 If one or both addresses in a pair were not well-geocoded, we instead compared the combination of city/town and ZIP code and recorded a move if both attributes were mismatched.
Environmental exposures
We evaluated several environmental exposures previously investigated in relation to cancer risk in the IWHS4–6,25,26,29,32 and in other studies in Iowa.33,34 Exposure to average annual nitrate–nitrogen (NO3-N mg/L) in drinking water was estimated based on the city of the participant’s address using public monitoring data (1986–2004) for finished water samples from Iowa public water supplies (PWS)35 (eFigure 1; http://links.lww.com/EE/A105). Exposure to agricultural land was estimated using land cover classification data in 1992 (the mid-point of follow-up) from the US National Land Cover Database36 (eFigure 2; http://links.lww.com/EE/A105). We calculated the proportion of agricultural land (row crops and pasture or hay, respectively) within a 750 m circular buffer around the home, a distance previously associated with higher pesticide levels in homes.33 Finally, we evaluated exposure to concentrated animal feeding operations (CAFOs) using publicly available information on permitted CAFOs (2003–2011) from the Iowa Department of Natural Resources37 (eFigure 3; http://links.lww.com/EE/A105) and enumerating CAFOs within 5 km of the address. The percent of IWHS participants by county of residence at enrollment is shown in eFigure 4; http://links.lww.com/EE/A105.
Bias analysis
Study participants with well-geocoded addresses at enrollment and all follow-up periods (n = 29,226; 70% of the cohort) were assigned exposures for each address and included in the bias analysis. Participants excluded from the bias analyses were similar to those included, with the exception of town size at enrollment, drinking water source, and occupation (a greater proportion of excluded participants lived in an unincorporated place, used a private well, and/or were homemakers); eTable 2; http://links.lww.com/EE/A105. Exposure was censored at follow-ups where addresses were outside of Iowa (n = 2,002 participants [7%]). We assigned exposures to participants in two ways: (1) based on the enrollment address, therefore assuming the participant remained at the enrollment address for up to 19 years (“stability method”) and (2) based on calculating a duration-based average across all addresses during follow-up (“mobility method”). Exposures were estimated at each new address starting from the year of the follow-up survey when the move was observed. Exposures for agricultural land and CAFOs near homes were assigned for all 29,226 participants. Our analysis of NO3-N included 20,057 participants who reported using a PWS in 1989 for which nitrate monitoring data were available.
We classified participants as exposed or unexposed using distribution- and regulatory-based thresholds that have been evaluated in previous IWHS analyses. We classified continuous exposures (NO3-N mg/L and agricultural land percentage within 750 m of the home) based on the highest quartile (<75th and ≥75th percentile). We also evaluated exposure to NO3-N at half the US Environmental Protection Agency maximum contaminant level (MCL) of 10 mg/L (1/2 MCL, <5 and ≥5 mg/L).38 For CAFOs, we classified a participant as exposed if there was one or more CAFO within 5 km of the address.
Statistical analyses
We calculated the mobility rate (probability of moving at least once) and the distribution of Euclidean distances (km) between moves with well-geocoded address pairs overall and for each follow-up. We computed the proportion of moves that occurred within the same city and, for moves to a different city, the proportion of moves to a larger city (based on town population). We grouped participants into three categories according to their mobility over the 19-year period: “nonmovers,” those never observed to move; “ever movers,” those who moved at least once; and “frequent movers,” a subset of ever movers who moved two or more times. We examined differences in characteristics between movers and nonmovers, including age, race, body mass index, smoking status, occupation, education, town size at enrollment, follow-up participation, drinking water source (reported in the 1989 follow-up survey), historical duration at the enrollment residence (reported in the 1987 follow-up survey), and prospective residence duration (years after enrollment until a participant moved or was censored due to loss to follow-up or death). We estimated the odds ratios (OR) and 95% confidence intervals for the likelihood of moving between subsequent follow-ups using a generalized estimating equation (GEE) model. To account for the varying number of years between follow-ups, we used the natural logarithm of years between follow-ups as the offset. Categories of race, body mass index, smoking status, occupation, education, and drinking water source were based on information collected at a single time point (enrollment), while age and town size of the address varied by follow-up. Missing-level indicators were included for variables if the percentage of participants with missing values was greater than 2%. Participants with missing values for education level, race, smoking status, and/or town size were excluded from the GEE models (n = 1,114).
Bias analysis
Using the mobility method as the gold standard in comparison to the enrollment address, we computed the sensitivity and specificity of correctly assigning exposure at 3, 11, and 19 years of follow-up (survey periods beginning [1989], mid-point [1997], and end [2004]). Sensitivity of exposure assignment was defined as the percentage of truly exposed participants that were correctly classified as exposed (e.g., ≥75th percentile and 1/2 MCL NO3-N; ≥75th percentile agricultural land; or ≥1 CAFOs within 5 km). Specificity was defined as the percentage of truly unexposed participants (e.g., <75th percentile and 1/2 MCL NO3-N; <75th percentile agricultural land; or 0 CAFOs within 5 km) that were correctly classified as unexposed. We estimated the attenuation of the observed OR (ORobs) due to misclassified exposures in a hypothetical nested case–control study of cancer assuming a true OR (ORtrue) of 2.0, using an approach described by Blair et al.39 We note that our estimated attenuation assumes there is nondifferential misclassification of exposure, in that the sensitivity and specificity are independent of the outcome.
For sensitivity analyses, we explored changes in misclassification with decreasing exposure prevalence. For NO3-N and agricultural land exposures, we used cut points at or above the 50th, 75th, and 95th percentile. For CAFOs, we used increasing counts of ≥1 (40% exposure), ≥2 (25% exposure), and ≥8 operations (5% exposure) near the home.
RESULTS
The cumulative mobility rate of IWHS participants over 19 years of follow-up was 4% at the first follow-up (1987), 9% at the second follow-up (1989), 12% at the third follow-up (1992), 21% at the fourth follow-up (1997), and 32% at the fifth follow-up (2004). Almost half of all moves occurred within the same city (41%). For moves to a different city, 54% of destination cities were larger than previous cities. The median distance between addresses was 6.5 km (Table 1). Participants who moved from unincorporated places traveled farther (median, 10.8 km). The distance between addresses for follow-ups one through four were similar (median, 5.3–5.7 km) but greater between follow-up four to five (median, 8.7 km) (eTable 3; http://links.lww.com/EE/A105).
Table 1.
Characteristics of the IWHS participants who did not move, ever moved, and moved frequently during 19 years of follow-up
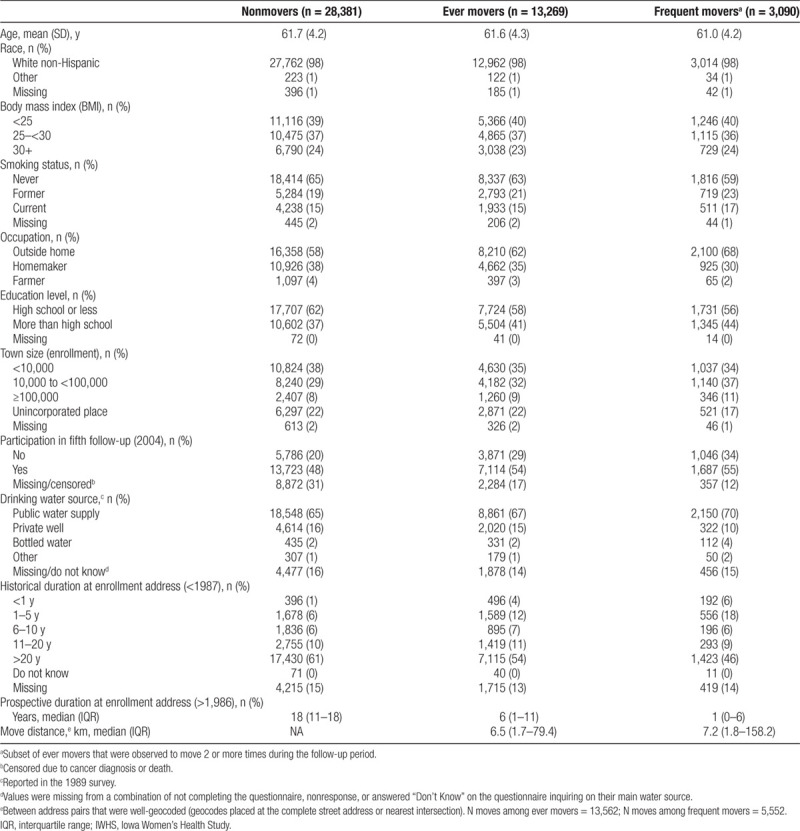
We observed differences between nonmovers (n = 28,381; 68%), ever movers (n = 13,269; 32%), and frequent movers (n = 3,090; 23% of ever movers) across demographic, health, and lifestyle characteristics (Table 1). A greater proportion of ever movers used to smoke, worked outside the home, had more than a high school education, and participated in the fifth follow-up compared with nonmovers. Similar and elevated trends were observed for the subset of frequent movers. Additionally, a greater proportion of frequent movers lived in larger towns compared with nonmovers. Most participants who did not move were at their enrollment address for 20 years prior (61%).
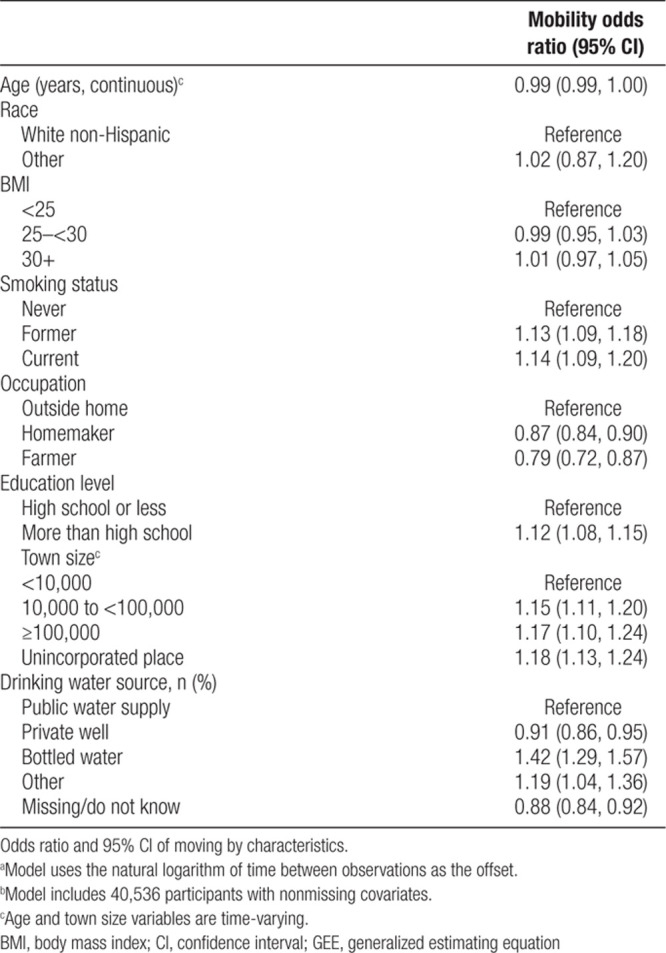
GEE model results indicated that when accounting for all other variables, mobility was significantly predicted by smoking status, occupation, education, town size, and drinking water source (Table 2). The odds of moving were greater for former or current smokers, those who worked outside the home, and those who had more than a high school education. Compared to living in a town size of <10,000, the odds of moving were 15% and 17% greater for those living in a town of 10,000–<100,000 and ≥100,000, respectively, and 18% greater for those in an unincorporated place. Compared to using a PWS as a primary water source, mobility was greater for those using bottled water or other source and less likely for those using a private well or unknown/missing water source.
Table 2.
GEE modela,b for predicting mobility
Exposures to NO3-N in drinking water, pasture/hay, row crop, and CAFOs assigned at the enrollment address were similar to the duration-based average across all addresses (Table 3). Sensitivity and specificity of exposure assignment at the enrollment address decreased for all environmental exposures with increasing years of follow-up as a greater proportion of women moved (Table 4). Sensitivity was lowest for NO3-N exposure ≥75th percentile (93.5%) and pasture/hay exposure (94.1%). Minor differences were observed for pasture/hay and row crops. Sensitivity of NO3-N exposure ≥5 mg/L (99.1%) was greater than exposure at ≥75th percentile even though exposure prevalence was lower (17%). The lowest specificity was observed for exposure to one or more CAFOs (40% prevalence) at all years of follow-up (96.9%). Attenuation of the ORtrue for the study period ranged from 5% to 8% for NO3-N, from 9% to 10% for agricultural land, and 6% for CAFOs.
Table 3.
Exposure distributions for participants with well-geocoded addresses (n = 29,226) assigned at the enrollment address and averaged across all addresses for 19 years of follow-up
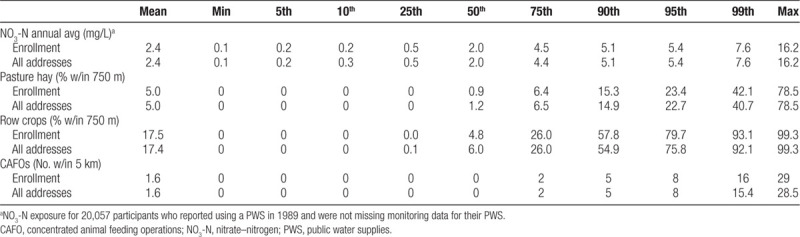
Table 4.
Accuracy of exposure assignment when using the enrollment addressa for 3, 11, and 19 follow-up years and attenuation in an odds ratio (OR) of 2.0 for a hypothetical cancer analysis for 19 years of follow-up

Attenuation of the OR associated with NO3-N exposure defined at or above the 50th and 95th percentiles (5%) was somewhat less than observed at the 75th percentile (8%); eTable 4; http://links.lww.com/EE/A105. Accuracy of CAFO exposures was similar for different cut points. The accuracy of agricultural land was influenced by exposure prevalence; at 5% exposure prevalence, sensitivities were lowest (range 86.0%–91.0%), and specificities were highest (range 99.3%–99.5%). Attenuation of the ORtrue ranged from 5% to 8% for NO3-N, from 9% to 16% for agricultural land, and from 6% to 7% for CAFOs.
DISCUSSION
Our study found the majority (68%) of the IWHS cohort remained at their enrollment address during the 19 years of follow-up. We found that mobility was predicted by occupation, education, smoking status, town size, and drinking water source. Overall, we observed low misclassification of environmental exposures and resultant bias of hypothetical risk associations. We found that mobility-related misclassification was influenced by years of follow-up, the spatial variability of the environmental measure, and the prevalence of exposure.
The proportion of participants in the IWHS who moved during 19 years of follow-up (32%) was lower than that in other more urban and younger populations, including the Canadian National Enhanced Cancer Surveillance System case–control study (60% mobility; 20-year residential history),19 the European Study of Cohorts for Air Pollution Effects subcohort in Sweden (70% mobility; 14.6-year follow-up),22 and the Cincinnati Childhood Allergy and Air Pollution Study prospective birth cohort (54% mobility; follow-up birth to 7 years).11 The rate of mobility in our population was comparable to that in a study of Canadians 55 years and older, of which 32% moved over a 12-year period and 30% lived in a small city or rural area.15 We observed a median movement distance of 6.5 km (4 miles) among movers, which is similar to studies of younger and more urban populations in the United States that report median distances of 3.210 and 4 miles.11,40
We found that mobility varied by several demographic and residential characteristics, including age, education, occupation, smoking status, town size, and drinking water source. Mobility was less likely for homemakers and farmers compared to those who worked outside the home. Though there are few existing studies to directly compare this result, a study of older Canadians found participants who returned to work were more likely to move.15 The odds of mobility were greater for current and former smokers in the IWHS. These results agree with a study of pregnant women, which found greater mobility for those who had reported ever smoking.12 Similar to our findings, older residents (60+ years old) in Rhode Island who were more educated were more likely to move.14 The greater likelihood of moving among women living in an unincorporated place reported in our study is comparable to another study of older adults who were more likely to move if they lived in a rural area.41 Increased mobility in rural or unincorporated places among older adults may be explained by a perceived inability to remain independent in their homes and communities.41,42 However, we also found mobility was greater for women living in larger towns, similar to patterns of higher mobility in urban areas observed in one population of younger women.43 Although not evaluated in our study, other predictors of mobility that may be relevant to older populations include marital status, home ownership, number of children, and use of community services.13–15,42
We did not find appreciable differences in exposure distributions when exposures were estimated only at the enrollment address compared to an average across all addresses, suggesting mobility in the cohort was not likely motivated by exposure levels. Other environmental exposures, such as traffic-related air pollution, may decrease as people relocate away from the exposure source (e.g., major roadways).11,20 We demonstrated that exposure misclassification from mobility increased over time in the IWHS by reevaluating exposure at the beginning, middle, and end of follow-up, indicating that the length of the exposure period will impact the extent of mobility-related misclassification. Even though misclassification increased over time, sensitivity and specificity remained >90% for all exposures at the end of the 19-year follow-up period. The low levels of misclassification we observed can be in part attributed to the stability of the population at the enrollment address because only 32% of the population moved during follow-up. Similarly, a study of older Canadians also with a 32% mobility rate observed no systematic biases in the associations between place-dependent variables (e.g., housing quality, material and social deprivation, urbanicity) when mobility was ignored.15 In our analysis, the sensitivity of NO3-N exposure in drinking water at the end of follow-up was lowest at ≥75th percentile (93.5%) compared to both ≥5 mg/L (99.1%) and ≥95th percentile (97.5%). The lower sensitivity at the ≥75th percentile despite higher exposure prevalence may be attributed to the crude spatial scale of NO3-N (city-level), which results in multiple people in the same city having identical exposure values and, consequently, percentile cutpoints inexact due to having many tied values. The accuracy of agricultural land exposure assignment was typically lower than NO3-N at various cut points and can be in part explained by differences in the spatial variability of these two exposures.17,40 Mobility may result in misclassification of exposure to agricultural land within 750 m buffers, regardless of a change in city of residence, while NO3-N exposure would not be affected by intra-city moves (41% of moves in our data). The risk estimates of CAFOs were also less attenuated than agricultural land and could be in part explained by the larger buffer size (5 km) and limited range of possible exposures to CAFOs (i.e., a maximum of 29 facilities within 5 km of the home).
In an effort to evaluate relevant misclassification and epidemiologic bias, we used environmental exposures that have been previously assessed and analyzed for cancer risks in the IWHS4–6,26,29 and have been examined in studies of other populations in Iowa.33,34 Since our current study assessed prospective exposure, we cannot directly estimate attenuation of cancer risks in previous investigations, which evaluated historical exposures. Historical duration of >20 years at the drinking water source has been used previously to define subgroup analyses of cancer risks to control for potential influences of mobility.5 We noted similarities between historical and prospective mobility rates in this cohort, as the proportion of participants remaining at the enrollment address for 19 years of follow-up (68%) was similar to the proportion of participants reporting a historical duration of >20 years at the enrollment address (69%). Thus, we expect limited mobility-related misclassification in previous analyses due to exposure estimation using only the enrollment address.
Our study has several strengths. By using prospectively collected residential information, we did not have to rely on participants’ recall of previous addresses or retrospective tracing of addresses using commercial software. Our analyses provide context for studies of environmental exposures over long time periods, including insight about expected exposure misclassification and attenuation of the exposure-disease outcome due to unaccounted changes in residential addresses. We acknowledge some limitations to this work. Because residential addresses were collected at each follow-up period, we were not able to capture moves as they occurred between surveys. However, our rate of frequent mobility (23% among movers) is comparable to the rate of frequent mobility (more than one move; 23%) in a study of older Canadians that collected address information biennially.15 While we used tracing efforts to update address information for nonrespondents in follow-ups, participation rates were higher for those who moved, suggesting there was a diminished ability to detect mobility for nonrespondents. Because we did not have information about drinking water source at each survey, we assumed participants who reported a PWS in 1989 continued to use a PWS at their other residences. In our hypothetical case–control analysis, we assumed exposure misclassification was nondifferential with respect to outcome. Although exposure misclassification is often nondifferential when exposure is assessed through secondary data linkages,22 it is possible that mobility can result in differential misclassification if characteristics of the study population (e.g., education, smoking) are associated with both mobility and the outcome under study.11,12 We note that the overall rates of exposure misclassification due to mobility in our study were extremely low. Therefore, even if the mobility-related exposure misclassification was differential, the effects on the estimated odds ratio should remain relatively minimal. Further exploration of the association between mobility and its correlates with specific health outcomes of interest is warranted. Finally, addresses within city or town boundaries had better geocoding accuracy, which led us to exclude more participants in rural areas in our bias analysis.
CONCLUSIONS
We evaluated residential mobility in a prospective cohort and found that the likelihood of participants changing residences differs by their demographics and other characteristics. We demonstrated how not incorporating residential changes in environmental exposure assessment can lead to misclassification and attenuation in the relative measure of association. Although we found low mobility-related exposure misclassification in the IWHS, we note the potential impacts on epidemiologic inference can vary by the characteristics of the study population (mobility rate), choice of exposure metrics (duration of exposure, thresholds used to define exposure), and characteristics of the exposure itself (spatial variability). Although limited to the exposures we evaluated in this study, our findings suggest that misclassification and attenuation bias in epidemiologic studies of long-term exposure to environmental factors can be mitigated by incorporating residential moves. Future studies should consider characteristics specific to their participants that could impact mobility and resultant bias.
Conflicts of interest statement
The authors declare that they have no conflicts of interest with regard to the content of this report.
Acknowledgments
We thank Abigail Flory of Westat Inc. for GIS support on this project.
Supplementary Material
Footnotes
Published online 24 August 2020
Sponsorships or competing interests that may be relevant to content are disclosed at the end of the article.
D.N.M. and J.A.F. are co-first authors of this article.
Supported by the Intramural Research Program of the National Cancer Institute.
Code is available from the National Cancer Institute upon request. Data requests should be directed to the University of Minnesota and are subject to their data access policies.
SDC Supplemental digital content is available through direct URL citations in the HTML and PDF versions of this article (www.environepidem.com).
REFERENCES
- 1.Weyer PJ, Cerhan JR, Kross BC, et al. Municipal drinking water nitrate level and cancer risk in older women: the Iowa Women’s Health Study. Epidemiology. 2001; 12:327–338 [DOI] [PubMed] [Google Scholar]
- 2.Turner MC, Krewski D, Diver WR, et al. Ambient air pollution and cancer mortality in the cancer prevention study II. Environ Health Perspect. 2017; 125:087013. [DOI] [PMC free article] [PubMed] [Google Scholar]
- 3.Pronk A, Nuckols JR, De Roos AJ, et al. Residential proximity to industrial combustion facilities and risk of non-Hodgkin lymphoma: a case-control study. Environ Health. 2013; 12:20. [DOI] [PMC free article] [PubMed] [Google Scholar]
- 4.Jones RR, Weyer PJ, DellaValle CT, et al. Ingested nitrate, disinfection by-products, and kidney cancer risk in older women. Epidemiology. 2017; 28:703–711 [DOI] [PMC free article] [PubMed] [Google Scholar]
- 5.Jones RR, Weyer PJ, DellaValle CT, et al. Nitrate from drinking water and diet and bladder cancer among postmenopausal women in Iowa. Environ Health Perspect. 2016; 124:1751–1758 [DOI] [PMC free article] [PubMed] [Google Scholar]
- 6.Inoue-Choi M, Jones RR, Anderson KE, et al. Nitrate and nitrite ingestion and risk of ovarian cancer among postmenopausal women in Iowa. Int J Cancer. 2015; 137:173–182 [DOI] [PMC free article] [PubMed] [Google Scholar]
- 7.Espejo-Herrera N, Gracia-Lavedan E, Pollan M, et al. Ingested nitrate and breast cancer in the Spanish Multicase-Control Study on Cancer (MCC-Spain). Environ Health Perspect. 2016; 124:1042–1049 [DOI] [PMC free article] [PubMed] [Google Scholar]
- 8.De Roos AJ, Davis S, Colt JS, et al. Residential proximity to industrial facilities and risk of non-Hodgkin lymphoma. Environ Res. 2010; 110:70–78 [DOI] [PMC free article] [PubMed] [Google Scholar]
- 9.Beelen R, Hoek G, van den Brandt PA, et al. Long-term effects of traffic-related air pollution on mortality in a Dutch cohort (NLCS-AIR study). Environ Health Perspect. 2008; 116:196–202 [DOI] [PMC free article] [PubMed] [Google Scholar]
- 10.Bell ML, Banerjee G, Pereira G. Residential mobility of pregnant women and implications for assessment of spatially-varying environmental exposures. J Expo Sci Environ Epidemiol. 2018; 28:470–480 [DOI] [PMC free article] [PubMed] [Google Scholar]
- 11.Brokamp C, LeMasters GK, Ryan PH. Residential mobility impacts exposure assessment and community socioeconomic characteristics in longitudinal epidemiology studies. J Expo Sci Environ Epidemiol. 2016; 26:428–434 [DOI] [PMC free article] [PubMed] [Google Scholar]
- 12.Miller A, Siffel C, Correa A. Residential mobility during pregnancy: patterns and correlates. Matern Child Health J. 2010; 14:625–634 [DOI] [PubMed] [Google Scholar]
- 13.Sommers DG, Rowell KR. Factors differentiating elderly residential movers and nonmovers. Popul Res Policy Rev. 1992; 11:249–262 [Google Scholar]
- 14.Meyer JW, Speare A. Distinctively elderly mobility: types and determinants. Econ Geogr. 1985; 61:79–88 [PubMed] [Google Scholar]
- 15.Philibert M, Daniel M. Predictors of residential mobility among older Canadians and impact on analyses of place and health relationships. AIMS Public Health. 2015; 2:115–131 [DOI] [PMC free article] [PubMed] [Google Scholar]
- 16.Hodgson S, Lurz PW, Shirley MD, Bythell M, Rankin J. Exposure misclassification due to residential mobility during pregnancy. Int J Hyg Environ Health. 2015; 218:414–421 [DOI] [PubMed] [Google Scholar]
- 17.Cressie N. Change of support and the modifiable areal unit problem. Geogr Syst. 1996; 3:159–180 [Google Scholar]
- 18.Canfield MA, Ramadhani TA, Langlois PH, Waller DK. Residential mobility patterns and exposure misclassification in epidemiologic studies of birth defects. J Expo Sci Environ Epidemiol. 2006; 16:538–543 [DOI] [PubMed] [Google Scholar]
- 19.Hystad P, Demers PA, Johnson KC, et al. Spatiotemporal air pollution exposure assessment for a Canadian population-based lung cancer case-control study. Environ Health. 2012; 11:22. [DOI] [PMC free article] [PubMed] [Google Scholar]
- 20.Hart JE, Rimm EB, Rexrode KM, Laden F. Changes in traffic exposure and the risk of incident myocardial infarction and all-cause mortality. Epidemiology. 2013; 24:734–742 [DOI] [PMC free article] [PubMed] [Google Scholar]
- 21.Crouse DL, Peters PA, Hystad P, et al. Ambient PM2.5, O3, and NO2 exposures and associations with mortality over 16 years of follow-up in the Canadian Census Health and Environment Cohort (CanCHEC). Environ Health Perspect. 2015; 123:1180–1186 [DOI] [PMC free article] [PubMed] [Google Scholar]
- 22.Oudin A, Forsberg B, Strömgren M, Beelen R, Modig L. Impact of residential mobility on exposure assessment in longitudinal air pollution studies: a sensitivity analysis within the ESCAPE project. ScientificWorldJournal. 2012; 2012:125818. [DOI] [PMC free article] [PubMed] [Google Scholar]
- 23.Joseph A-C, Fuentes M, Wheeler DC. The impact of population mobility on estimates of environmental exposure effects in a case-control study. Stat Med. 2020; 39:1610–1622 [DOI] [PubMed] [Google Scholar]
- 24.Inoue-Choi M, Weyer PJ, Jones RR, et al. Atrazine in public water supplies and risk of ovarian cancer among postmenopausal women in the Iowa Women’s Health Study. Occup Environ Med. 2016; 73:582–587 [DOI] [PMC free article] [PubMed] [Google Scholar]
- 25.Quist AJL, Inoue-Choi M, Weyer PJ, et al. Ingested nitrate and nitrite, disinfection by-products, and pancreatic cancer risk in postmenopausal women. Int J Cancer. 2018; 142:251–261 [DOI] [PMC free article] [PubMed] [Google Scholar]
- 26.Ward MH, Kilfoy BA, Weyer PJ, Anderson KE, Folsom AR, Cerhan JR. Nitrate intake and the risk of thyroid cancer and thyroid disease. Epidemiology. 2010; 21:389–395 [DOI] [PMC free article] [PubMed] [Google Scholar]
- 27.Jones RR, DellaValle CT, Weyer PJ, et al. Ingested nitrate, disinfection by-products, and risk of colon and rectal cancers in the Iowa Women’s Health Study cohort. Environ Int. 2019; 126:242–251 [DOI] [PMC free article] [PubMed] [Google Scholar]
- 28.Folsom AR, Zhang S, Sellers TA, Zheng W, Kushi LH, Cerhan JR. Cancer incidence among women living on farms: findings from the Iowa Women’s Health Study. J Occup Environ Med. 1996; 38:1171–1176 [DOI] [PubMed] [Google Scholar]
- 29.Jones RR, Yu CL, Nuckols JR, et al. Farm residence and lymphohematopoietic cancers in the Iowa Women’s Health Study. Environ Res. 2014; 133:353–361 [DOI] [PMC free article] [PubMed] [Google Scholar]
- 30.Whitsel EA, Quibrera PM, Smith RL, et al. Accuracy of commercial geocoding: assessment and implications. Epidemiol Perspect Innov. 2006; 3:8. [DOI] [PMC free article] [PubMed] [Google Scholar]
- 31.Cayo MR, Talbot TO. Positional error in automated geocoding of residential addresses. Int J Health Geogr. 2003; 2:10. [DOI] [PMC free article] [PubMed] [Google Scholar]
- 32.Inoue-Choi M, Ward MH, Cerhan JR, Weyer PJ, Anderson KE, Robien K. Interaction of nitrate and folate on the risk of breast cancer among postmenopausal women. Nutr Cancer. 2012; 64:685–694 [DOI] [PMC free article] [PubMed] [Google Scholar]
- 33.Ward MH, Lubin J, Giglierano J, et al. Proximity to crops and residential exposure to agricultural herbicides in Iowa. Environ Health Perspect. 2006; 114:893–897 [DOI] [PMC free article] [PubMed] [Google Scholar]
- 34.Jones RR, DellaValle CT, Flory AR, et al. Accuracy of residential geocoding in the Agricultural Health Study. Int J Health Geogr. 2014; 13:37. [DOI] [PMC free article] [PubMed] [Google Scholar]
- 35.Center for Health Effects of Environmental Contamination. The University of Iowa. 1987. Available at: https://cheec.uiowa.edu/. Accessed November 8, 218.
- 36.United States Geological Survey. National Land Cover Dataset 1992 (NLCD1992). 1992. Available at: https://www.mrlc.gov/nlcd1992.php. Accessed November 8, 2018.
- 37.Iowa Geodata. Animal Feeding Operations. 2017. Available at: https://geodata.iowa.gov/dataset/animal-feeding-operations. Accessed February 2, 2019.
- 38.U.S. Environmental Protection Agency. Estimated Nitrate Concentrations in Groundwater Used for Drinking. 2018. Available at: https://www.epa.gov/nutrient-policy-data/estimated-nitrate-concentrations-groundwater-used-drinking. Accessed October 31, 2018.
- 39.Blair A, Thomas K, Coble J, et al. Impact of pesticide exposure misclassification on estimates of relative risks in the Agricultural Health Study. Occup Environ Med. 2011; 68:537–541 [DOI] [PMC free article] [PubMed] [Google Scholar]
- 40.Lupo PJ, Symanski E, Chan W, et al. Differences in exposure assignment between conception and delivery: the impact of maternal mobility. Paediatr Perinat Epidemiol. 2010; 24:200–208 [DOI] [PubMed] [Google Scholar]
- 41.Sergeant JF, Ekerdt DJ, Chapin R. Measurement of late-life residential relocation: why are rates for such a manifest event so varied? J Gerontol B Psychol Sci Soc Sci. 2008; 63:S92–S98 [DOI] [PubMed] [Google Scholar]
- 42.Weeks LE, Keefe J, Macdonald DJ. Factors predicting relocation among older adults. J Hous Elderly. 2012; 26:355–371 [Google Scholar]
- 43.Bell ML, Belanger K. Review of research on residential mobility during pregnancy: consequences for assessment of prenatal environmental exposures. J Expo Sci Environ Epidemiol. 2012; 22:429–438 [DOI] [PMC free article] [PubMed] [Google Scholar]
Associated Data
This section collects any data citations, data availability statements, or supplementary materials included in this article.