

ABSTRACT
Sustained macroautophagy/autophagy favors the differentiation of fibroblasts into myofibroblasts. Cellular senescence, another means of responding to long-term cellular stress, has also been linked to myofibroblast differentiation and fibrosis. Here, we evaluate the relationship between senescence and myofibroblast differentiation in the context of sustained autophagy. We analyzed markers of cell cycle arrest/senescence in fibroblasts in vitro, where autophagy was triggered by serum starvation (SS). Autophagic fibroblasts expressed the senescence biomarkers CDKN1A/p21 and CDKN2A/p16 and exhibited increased senescence-associated GLB1/beta-galactosidase activity. Inhibition of autophagy in serum-starved fibroblasts with 3-methyladenine, LY294002, or ATG7 (autophagy related 7) silencing prevented the expression of senescence-associated markers. Similarly, suppressing MTORC2 activation using rapamycin or by silencing RICTOR also prevented senescence hallmarks. Immunofluorescence microscopy showed that senescence and myofibroblast differentiation were induced in different cells, suggesting mutually exclusive activation of senescence and myofibroblast differentiation. Reactive oxygen species (ROS) are known inducers of senescence and exposing fibroblasts to ROS scavengers decreased ROS production during SS, inhibited autophagy, and significantly reduced the expression of senescence and myofibroblast differentiation markers. ROS scavengers also curbed the AKT1 phosphorylation at Ser473, an MTORC2 target, establishing the importance of ROS in fueling MTORC2 activation. Inhibition of senescence by shRNA to TP53/p53 and shRNA CDKN2A/p16 increased myofibroblast differentiation, suggesting a negative feedback loop of senescence on autophagy-induced myofibroblast differentiation. Collectively, our results identify ROS as central inducers of MTORC2 activation during chronic autophagy, which in turn fuels senescence activation and myofibroblast differentiation in distinct cellular subpopulations.
Abbreviations: 3-MA: 3-methyladenine; ACTA2: actin, alpha 2, smooth muscle, aorta; AKT1: AKT serine/threonine kinase 1; p-AKT1: AKT1 Ser473 phosphorylation; t-AKT1: total AKT serine/threonine kinase 1; ATG4A: autophagy related 4A cysteine peptidase; ATG7: autophagy gene 7; C12FDG: 5-dodecanoylaminofluorescein Di-β-D-Galactopyranoside; CDKN1A: cyclin dependent kinase inhibitor 1A; CDKN2A: cyclin dependent kinase inhibitor 2A; Ctl: control; DAPI: 4ʹ,6-diamidino-2-phenylindole, dilactate; ECM: extracellular matrix; GSH: L-glutathione reduced; H2O2: hydrogen peroxide; HLF: adult human lung fibroblasts; Ho: Hoechst 33342 (2′‐[4‐ethoxyphenyl]‐5‐[4‐methyl‐1‐piperazinyl]‐2.5′‐bi‐1H‐benzimidazole); HSC: hepatic stellate cells; LY: LY294002; MAP1LC3B/LC3B: microtubule-associated protein 1 light chain 3 beta; MTORC1/2: mechanistic target of rapamycin kinase complex 1/2; N: normal growth medium; NAC: N-acetyl-L-cysteine; PBS: phosphate-buffered saline; PDGFA: platelet derived growth factor subunit A; PRKCA/PKCα: protein kinase C alpha; PtdIns3K: class III phosphatidylinositol 3-kinase; PTEN: phosphatase and tensin homolog; R: rapamycin; RICTOR: RPTOR independent companion of MTOR complex 2; ROS: reactive oxygen species; RPTOR: regulatory associated protein of MTOR complex 1; SA-GLB1/β-gal: senescence-associated galactosidase beta 1; SGK1: serum/glucocorticoid regulated kinase 1; shRNA: short hairpin RNA; siCtl: control siRNA; siRNA: small interfering RNA; SQSTM1: sequestosome 1; SS: serum-free (serum starvation) medium; TP53: tumor protein p53; TUBA: tubulin alpha; V: vehicle.
KEYWORDS: Autophagy, MTORC2, myofibroblast, rapamycin, senescence
Introduction
The differentiation of fibroblasts into myofibroblasts is an essential component of normal tissue repair. Differentiated myofibroblasts are characterized by a contractile phenotype dependent on the formation of stress fibers that contain ACTA2 (actin alpha 2, smooth muscle) and an increased capacity to produce extracellular matrix (ECM) components such as COL1A (collagen type I alpha) and COL3A1 [1,2]. During fibrosis, an abnormal form of repair, myofibroblasts persist at sites of injury, therefore contributing to ECM protein overproduction, ECM thickening, loss of normal tissue architecture, and perturbed organ and/or tissue functions [1,3]. The presence of myofibroblasts during the healing process is, therefore, a normal phenomenon, while their long-term accumulation is a hallmark of fibrosis.
Cellular senescence refers to a stable arrest of cell proliferation. This process results from a variety of stresses including oxidative stress, telomere attrition and activated
oncogenes [4]. Senescence-associated proliferation arrest is characterized by the activity of the TP53-CDKN1A/p21WAF1 and CDKN2A/p16INK4a-RB pathways. Senescent cells also increase lysosomal mass to promote elevated levels of senescence-associated GLB1/beta-galactosidase (SA-GLB1/β-gal) activity [5]. They remain viable and contribute to the tissue stress response mostly via a senescence-associated secretory phenotype [6,7]. Mounting evidence suggests that dysregulated senescence can, under certain circumstances, contribute to abnormal tissue repair and fibrosis [6,8]. Both enhanced [9] and decreased [10,11] cellular senescence have been linked to fibrosis. These seemingly contradictory results likely highlight the fact that finely-tuned levels of senescence are required during normal tissue repair, whereas unregulated senescence likely disrupts normal healing [8,12]. Hence, the timing of the senescence response, the cell types involved, and the downstream pathways triggered by senescence induction weave a complex interplay of responses that may be either beneficial or detrimental to tissue repair.
Autophagy represents a highly conserved process triggered, like senescence, in response to stress or starvation. During autophagy, cytoplasmic components are sequestered within autophagosomes, which fuse with lysosomes to initiate the degradation of its content to sustain metabolism. Mechanistic target of rapamycin kinase complex 1 (MTORC1) is a key regulator of autophagy, and its inhibition increases this cellular process [13]. Autophagy has also been linked to fibrosis [14,15]. It was shown to promote fibroblast-to-myofibroblast differentiation through activation of the mechanistic target of rapamycin kinase complex 2 (MTORC2) [16,17].
Studies on cross-talk between autophagy and senescence in fibroblasts show contradictory context-dependent results [18,19]. In the context of chemotherapy- or oncogenic Ras-induced senescence, the inhibition of autophagy delays the expression of senescence markers [20,21]. In contrast, primary human cells prematurely enter telomere- and stress-mediated replicative senescence when autophagy is perturbed [22]. In addition to senescence-associated proliferation arrest, autophagy is also involved in regulating the pro-inflammatory secretome of senescent cells [23], whether senescence impacts autophagy-mediated MTORC2 activation and myofibroblast differentiation remain to be delineated.
Here, we sought to characterize the interlaced relationship between autophagy-induced MTORC2 activation in fibroblasts and senescence activation. We report that, in fibroblasts, sustained autophagy induction by reactive oxygen species (ROS) is associated with enhanced MTORC2 activity, which concomitantly controls the expression of senescence markers and myofibroblast differentiation.
Results
Autophagy induced by prolonged serum starvation is central to senescence
WI-38 human embryonic lung fibroblasts were exposed to serum-free/serum starvation medium (SS) to evaluate the functional importance of growth factor deprivation in the simultaneous activation of autophagy, senescence, and myofibroblast differentiation. CDKN1A (cyclin dependent kinase inhibitor 1A) protein, a marker of both cell-cycle arrest and senescence [24], increased rapidly in fibroblasts serum-starved for 4 h followed by a progressive decline, suggesting a role in immediate growth arrest (Figure 1A). Alternatively, CDKN2A (cyclin dependent kinase inhibitor 2A), another cell-cycle arrest protein, and a reliable cell senescence marker [25–28] was stably induced in serum-starved fibroblasts (Figure 1B). SA-GLB1/β-gal activity, another cell senescence marker [29] was also induced in fibroblasts serum-starved for 7 d (Figure 1C). As reported previously [16], prolonged serum starvation decreased SQSTM1/p62 (sequestosome 1) protein level, a marker of autophagy induction, and increased ACTA2/αSMA protein level, a marker of myofibroblast differentiation (Figure 1A,B). These results suggest that the induction of autophagy is associated with the concomitant induction of senescence and myofibroblast differentiation in serum-starved fibroblasts. Adult human lung fibroblasts (HLF) exposed to prolonged serum starvation also displayed evidence of autophagy, senescence, and myofibroblast differentiation (Figure S1A).
Figure 1.
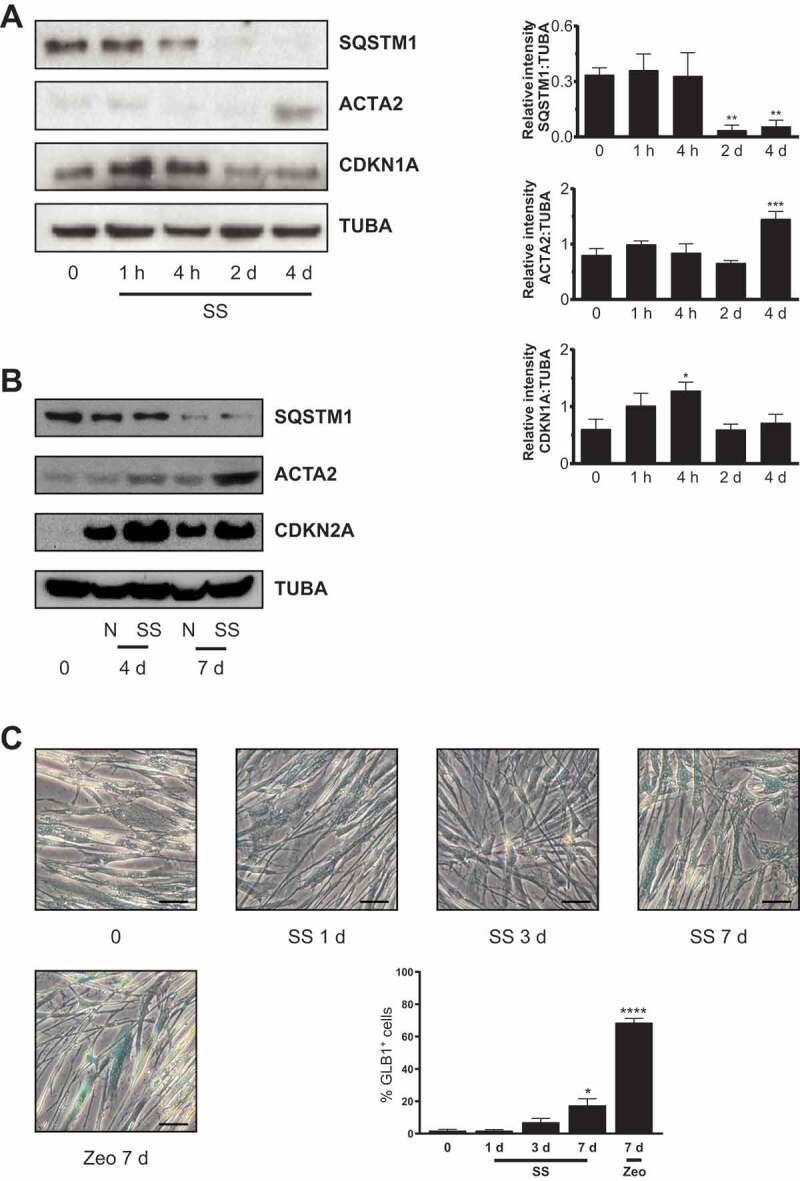
Serum starvation (SS) induces senescence in fibroblasts. (A) Left panel: Representative immunoblots of SQSTM1, ACTA2, CDKN1A and TUBA protein levels in WI-38 fibroblasts exposed to SS. Right panel: Densitometric analysis of SQSTM1 (**P < 0.01, 4 h vs 2 d (D); **P < 0.01, 4 h vs 4 d, n = 5), ACTA2 (***P < 0.005, 2 d vs 4 d, n = 5) and CDKN1A (*P < 0.05, 0 vs 4 h, n = 4) relative to TUBA. Data are presented as mean ± SEM (B) Representative immunoblots of SQSTM1, ACTA2, CDKN2A and TUBA protein levels in WI-38 fibroblasts exposed to SS or grown under N at 4 and 7 d (n = 2). (C) Cytochemical evaluation of the senescence marker SA-GLB1/β-gal activity of cells grown in N or maintained SS for 1, 3 or 7 d. Zeocin (Zeo) in N (50 ug/ml) served as a positive control. Data are presented as % of SA-GLB1/β-gal-positive cells (mean ± SEM; *P < 0.05, 0 vs SS 7 d; ****P < 0.0001, 0 vs zeocin 7 d, n = 3) Scale bar: 50 µm
We next evaluated whether markers of senescence were directly modulated by autophagy. Class III phosphatidylinositol 3-kinase (PtdIns3K) activity is necessary for autophagosome formation [30]. Therefore, we used PtdIns3K inhibitors 3-methyladenine (3-MA) and LY294002 (LY), 2 inhibitors that curtail both class I phosphoinositide 3-kinase/PI3K and Ptdlns3K activity in starved cells [31–33]. As expected, 3-MA and LY prevented the enhancement of lipidated MAP1LC3B (microtubule associated protein 1 light chain 3 beta) to nonlipidated (MAP1LC3B-II:I) ratios, increased SQSTM1 expression and blocked ACTA2 upregulation in WI-38 cells (Figure 2A,B). Starved HLF cells showed a similar response (Figure S1B). 3-MA and LY also inhibited CDKN1A and CDKN2A upregulation as well as SA-GLB1/β-gal activity in serum-starved fibroblasts (Figure 2A,B,D,E, and S1B). To further assess the importance of sustained autophagy in the induction of senescence markers, we silenced ATG7 [34] in serum-starved fibroblasts. siATG7 decreased MAP1LC3B-II:I ratios, increased SQSTM1 protein level and prevented ACTA2 and CDKN2A overexpression (Figure 2C). These results indicate that autophagy is instrumental in triggering both senescence and myofibroblast differentiation.
Figure 2.
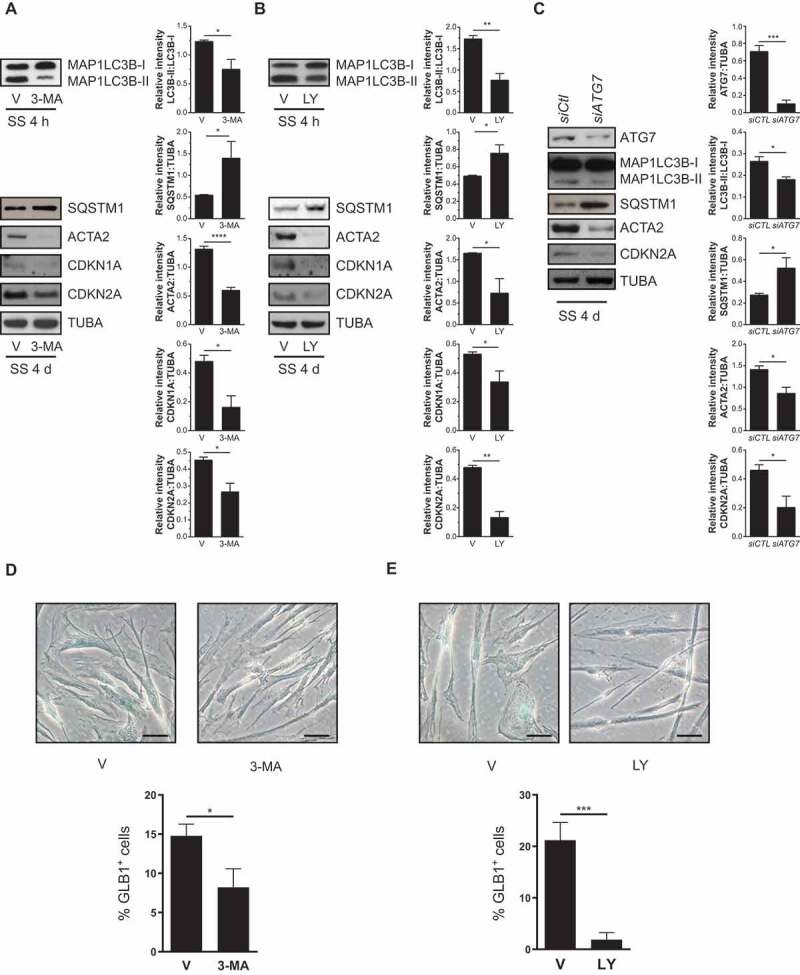
Autophagy induces senescence in serum-starved (SS) fibroblasts. (A) Upper left panel: Representative immunoblots of MAP1LC3B-I and -II protein levels in WI-38 fibroblasts starved in the presence of 3-MA (1 mM) or vehicle (V) for 4 h. Upper right panel: Densitometric analysis of MAP1LC3B-II relative to MAP1LC3B-I (*P < 0.05, n = 3). Lower left panel: Representative immunoblots of SQSTM1, ACTA2, CDKN1A, CDKN2A and TUBA protein levels in SS WI-38 fibroblasts and incubated with 3-MA (1 mM) or V for 4 d. Lower right panel: Densitometric analysis of SQSTM1 (*P < 0.05), ACTA2 (****P < 0.0001), CDKN1A (*P < 0.05) and CDKN2A (*P < 0.05) relative to TUBA (n = 3). (B) Upper left panel: Representative immunoblots of MAP1LC3B-I and -II protein levels in SS WI-38 fibroblasts in the presence of LY (5 µM) or V for 4 h. Upper right panel: Densitometric analysis of MAP1LC3B-II relative to MAP1LC3B-I (**P < 0.01, n = 3). Lower left panel: Representative immunoblots of SQSTM1, ACTA2, CDKN1A, CDKN2A and TUBA protein levels in SS WI-38 fibroblasts and incubated with LY (5 µM) or V for 4 d. Lower right panel: Densitometric analysis of SQSTM1 (*P < 0.05), ACTA2 (*P < 0.05), CDKN1A (*P < 0.05), CDKN2A (**P < 0.01) relative to TUBA (n = 3). (C) Left panel: Representative immunoblots of ATG7, MAP1LC3B-I and -II, SQSTM1, ACTA2, CDKN2A and TUBA protein levels in SS WI-38 fibroblasts for 4 d post-nucleofection with control siRNA (siCtl) or siATG7. Right panel: Densitometric analysis of ATG7 (***P < 0.001), MAP1LC3B-II:I ratios (*P < 0.05), SQSTM1 (*P < 0.05), ACTA2 (*P < 0.05) and CDKN2A (*P < 0.05) protein levels relative to TUBA in WI-38 fibroblasts silenced for ATG7 expression (n = 4). All densitometric analysis are presented as mean ± SEM (D) Cytochemical evaluation of the senescence marker SA-GLB1/β-gal activity in SS cells and incubated with 3-MA (1 mM) or V for 7 d. Data are presented as % of SA-GLB1/β-gal-positive cells (mean ± SEM; *P < 0.05, n = 3) Scale bar: 50 µm. (E) Cytochemical evaluation of the senescence marker SA-GLB1/β-gal activity in SS cells and incubated with LY (5 µM) or V for 7 d. Data are presented as % of SA-GLB1/β-gal-positive cells (mean ± SEM; ***P < 0.001, n = 3) Scale bar: 50 µm
MTORC2 signaling regulates autophagy-induced senescence
MTORC2 is responsible for AKT1 (AKT serine/threonine kinase 1) phosphorylation at Ser473 [35]. We previously showed that prolonged autophagy activates MTORC2 leading to AKT1 phosphorylation at Ser473 [16]. Inhibiting MTORC2 with rapamycin (R) [35] or by silencing RICTOR (RPTOR independent companion of MTOR complex 2), an essential component of MTORC2 [36] suppresses AKT1 phosphorylation at Ser473 in serum-starved fibroblasts [16]. These results prompted us to investigate whether the expression of senescence markers in fibroblasts exposed to prolonged SS is also under MTORC2 control.
Prolonged exposure of serum-starved fibroblasts to rapamycin prevented phosphorylation of the MTORC2 target AKT1 without reducing MAP1LC3B-II:I ratios in WI-38 (Figure 3A). Serum-starved fibroblasts exposed to R showed lowered CDNK1A and CDKN2A protein levels and decreased SA-GLB1/β-gal activity (Figure 3A,C, and S1C). Long-term R treatment of serum-starved fibroblasts also reduced ACTA2 expression (Figure 3A and S1C). To tease out the respective roles of MTORC2 and MTORC1 complexes, we silenced either RICTOR, an integral component of MTORC2 or RPTOR (regulatory associated protein of MTOR complex 1) an essential component of MTORC1 in serum-starved fibroblasts (Figure 3). RICTOR silencing suppressed AKT1 phosphorylation at Ser473 along with repression of myofibroblast differentiation inhibition of CDKN1A and CDKN2A expression, and inhibition of SA-GLB1/β-gal activity (Figure 3B,D). Silencing RPTOR did not inhibit AKT1 phosphorylation or ACTA2 overexpression and did not reduce levels of CDKN1A and CDKN2A (Figure 3B). RPTOR silencing led, however, to inhibition of SA-GLB1/β-gal activity (Figure 3D). This result suggested that both MTORC1 and MTORC2 activities control senescence through distinct downstream signaling pathways. To further test this possibility, we silenced RICTOR and RPTOR concomitantly in serum-starved fibroblasts. This silencing led to a further reduction in SA-GLB1/β-gal activity, confirming that RICTOR and RPTOR modulate distinct and additive pathways (Figure 3D). These results suggest that MTORC2 activation induced by prolonged autophagy concomitantly controls the expression of senescence markers and myofibroblast differentiation through signaling pathways that are independent of MTORC1.
Figure 3.
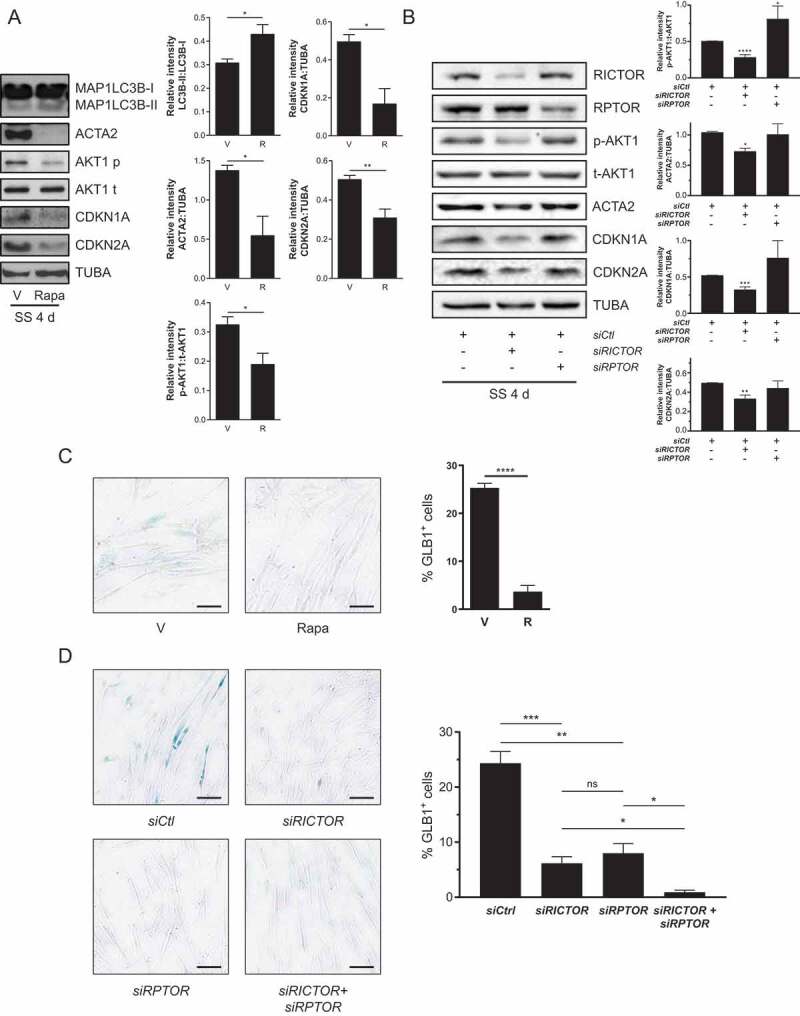
Senescence induced by serum starvation (SS) depends on MTORC2 signaling. (A) Left panel: Representative immunoblots of western blots showing MAP1LC3B-I and – II, ACTA2, AKT1 Ser473 phosphorylation (p-AKT1), total AKT1 (t-AKT1), CDKN1A, CDKN2A and TUBA protein levels in WI-38 fibroblast exposed to SS for 4 d in the presence of R (10 nM) or V. Right panel: Densitometric analysis of MAP1LC3B-II relative to MAP1LC3B-I (*P < 0.05), ACTA2 relative to TUBA (*P < 0.05), p-AKT1 relative to t-AKT1 (*P < 0.05), CDKN1A (*P < 0.05) and CDKN2A (**P < 0.05) relative to TUBA (n = 3). (B) Left panel: Representative immunoblots of RICTOR, RPTOR, p-AKT1, t-AKT1, ACTA2, CDKN1A, CDKN2A and TUBA protein levels in SS WI-38 fibroblats for 4 d after transfection with siCtl, siRICTOR or siRPTOR. Right panel: Densitometric analysis of p-AKT1 relative to t-AKT1, ACTA2 relative to TUBA, CDKN1A and CDKN2A relative to TUBA (*P < 0.05, **P < 0.01, ***P < 0.001, and ****P < 0.0001 values compared to siCtl, n = 3). All densitometric analysis are expressed as mean ± SEM (C) Cytochemical evaluation of the senescence marker SA-GLB1/β-gal activity in SS cells and incubated with R (10 nM) or V for 7 d. Data are presented as % of SA-GLB1-positive cells (mean ± SEM; ****P < 0.0001, n = 3) Scale bar: 40 µm. (D) Cytochemical evaluation of the senescence marker SA-GLB1/β-gal activity in SS cells and transfected with siCtl, siRICTOR or siRPTOR for 7 d. Data are presented as % of SA-GLB1/β-gal-positive cells (mean ± SEM; *P < 0.05 between siRICTOR or siRPTOR and siRICTOR+siRPTOR and **P < 0.01, ***P < 0.001 values compared to siCtl, n = 3) Scale bar: 40 µm
ROS are involved in MTORC2-signaling, senescence and myofibroblast differentiation during sustained autophagy
ROS are well-described inducers of autophagy [37] and senescence [38] and are also known to regulate myofibroblast differentiation [39]. We sought to investigate the role played by ROS in autophagy-induced senescence and myofibroblast differentiation. First, we evaluated ROS production in serum-starved fibroblasts. Cells starved for 1 or 4 h showed increased ROS (Figure 4A). Incubating cells with N-acetyl-L-cysteine (NAC) or L-glutathione reduced (GSH), 2 ROS scavengers, during SS blocked ROS production in serum-starved cells (Figure 4A and S1D) and prevented mitochondrial fragmentation induced by long-term serum starvation (Figure S2). NAC and GSH restored SQSTM1 expression, prevented CDKN1A and CDKN2A overexpression, and inhibited the up-regulation of ACTA2 (Figure 4B and S1D). NAC and GSH also prevented increased SA-GLB1/β-gal activity (Figure 4C and S1D). We, therefore, tested whether ROS are central to MTORC2 activation in serum-starved fibroblasts. Scavenging ROS in serum-starved fibroblasts with NAC and GSH significantly reduced AKT1 phosphorylation at Ser473 (Figure 4D and S1D). These results indicate that, in serum-starved fibroblasts, increased ROS production is a central trigger for autophagy induction, which, in turn, activates MTORC2 and evokes downstream induction of senescence and myofibroblast differentiation.
Figure 4.
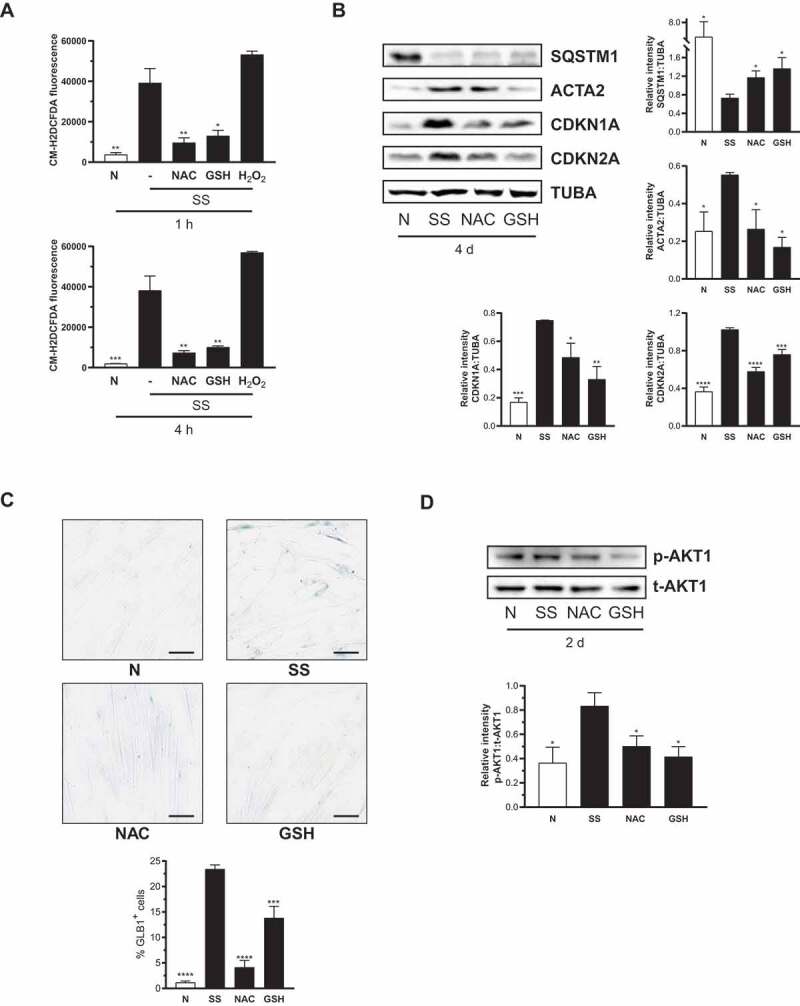
ROS are required for autophagy-induced MTORC2 activation leading to senescence. (A) Upper panel: Starvation elicits ROS production in WI-38 fibroblasts. Quantification of ROS production in WI-38 fibroblasts stained with CM-H2DCFDA and cultured for 1 h in the N, SS, SS + 10 mM NAC, SS + 100 µM GSH or 500 µM hydrogen peroxide (H2O2; as positive control). Fluorescence is expressed as mean ± SEM (**P < 0.01 N vs SS, NAC vs SS and *P < 0.05 GSH vs SS, in triplicate). Lower panel: Stained cells were incubated for 4 h in the conditions described in A before fluorescence was measured (***P < 0.001 N vs SS, **P < 0.01 NAC vs SS and GSH vs SS, in triplicate). (B) Left panel: Representative immunoblots of SQSTM1, ACTA2, CDKN1A, CDKN2A and TUBA protein levels in WI-38 fibroblasts exposed to N, SS, SS + NAC 10 mM or SS + 100 µM GSH for 4 d. Right panels: Densitometric analysis of SQSTM1, ACTA2, CDKN1A and CDKN2A relative to TUBA. Data are presented as mean ± SEM (*P < 0.05, **P < 0.01, ***P < 0.001, and ****P < 0.0001 values compared to SS condition, n = 4). (C) Cytochemical evaluation of the senescence marker SA-GLB1/β-gal activity in SS cells or SS + NAC 10 mM or SS + 100 µM GSH for 7 d. Data are presented as % of SA-GLB1/β-gal-positive cells (mean ± SEM; ***p < 0.001 and ****P < 0.0001 compared to SS cells, n = 3) Scale bar: 40 µm. (D) Upper panel: Representative immunoblots of p-AKT1 and t-AKT1 in WI-38 fibroblasts exposed to N, SS, SS + 10 mM NAC or SS + 100 µM GSH for 2 d. Lower panel: Densitometric analysis of p-AKT1 relative to t-AKT1 compared to serum starved cells (*P < 0.05, n = 3). Data are presented as mean ± SEM
Inhibition of senescence leads to enhanced myofibroblast differentiation
To explore the relationship between senescence pathways and myofibroblast differentiation, we used RNA interference to stably suppress the expression of the 2 key senescence genes CDKN2A and TP53 (tumor protein p53), the upstream regulator of CDKN1A, in serum-starved fibroblasts [5,26,40]. Using lentiviral vectors, we sequentially introduced 2 short hairpin RNA (shRNA), shRNACDKN2A and shRNATP53, into proliferating WI38 cells to create shTP53CDKN2A cells, and alternatively created control cells that express a nonspecific shRNA (shGFP cells). Unlike shGFP cells, serum-starved shTP53CDKN2A fibroblasts showed significant suppression of CDKN2A and CDKN1A expression (Figure 5A), and inhibition of senescence, as demonstrated by decreased SA-GLB1/β-gal activity (Figure 5B). Blocking activation of senescence prevented MTORC2 activation as demonstrated by reduced AKT1 phosphorylation at Ser473 (Figure 5A). We then evaluated the impact of senescence inhibition on myofibroblast differentiation. Intriguingly, we found that serum-starved shTP53CDKN2A fibroblasts displayed increased myofibroblast differentiation, as shown by increased ACTA2. This observation occurred in spite of decreased MTORC2 activation (Figure 5A). These results suggest that autophagy-induced senescence activation favors MTORC2 activation but represses myofibroblast differentiation.
Figure 5.
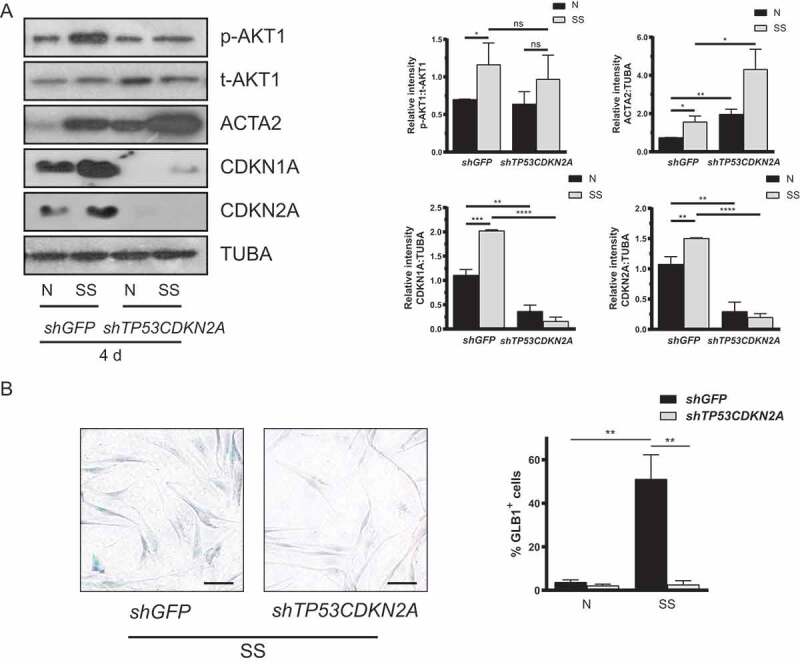
Inhibition of senescence leads to upregulated myofibroblast differentiation. (A) Left panel: Representative immunoblots of p-AKT1, t-AKT1, ACTA2, CDKN1A, CDKN2A and TUBA protein levels in WI-38 fibroblasts transfected with shGFP or shTP53CDKN2A plasmids exposed to N or SS for 4 d. Right panels: Densitometric analysis of p-AKT1 relative to t-AKT1, ACTA2, CDKN1A and CDKN2A relative to TUBA. Data are presented as mean ± SEM (*P < 0.05, **P < 0.01, ***P < 0.001, and ****P < 0.0001 values compared to shGFP-SS condition, n = 5). (B) Cytochemical evaluation of the senescence marker SA-GLB1/β-gal activity in transfected cells serum-starved for 7 d. Data are presented as % of SA-GLB1/β-gal-positive cells (mean ± SEM; **P < 0.001 value compared to shGFP-SS condition, n = 3) Scale bar: 50 µm
Cellular senescence and myofibroblast differentiation are not concomitantly activated in the same cells
We then evaluated whether senescence and myofibroblast differentiation occur in the same cells or distinct cell subpopulations in response to autophagic stress. C12FDG (5-dodecanoylaminofluorescein di-β-D-galactopyranoside) is a β-galactosidase substrate, and its cleavage by β-galactosidase produces a fluorescent product retained by the cells. Using C12FDG and immunofluorescent staining of ACTA2, we found that increased SA-GLB1/β-gal activity and ACTA2 overexpression are generally found in distinct cell subpopulations in serum-starved fibroblasts (Figure 6 and S3). These results suggest that chronic autophagy evokes either senescence or differentiation responses and that both pathways tend to inhibit one another.
Figure 6.
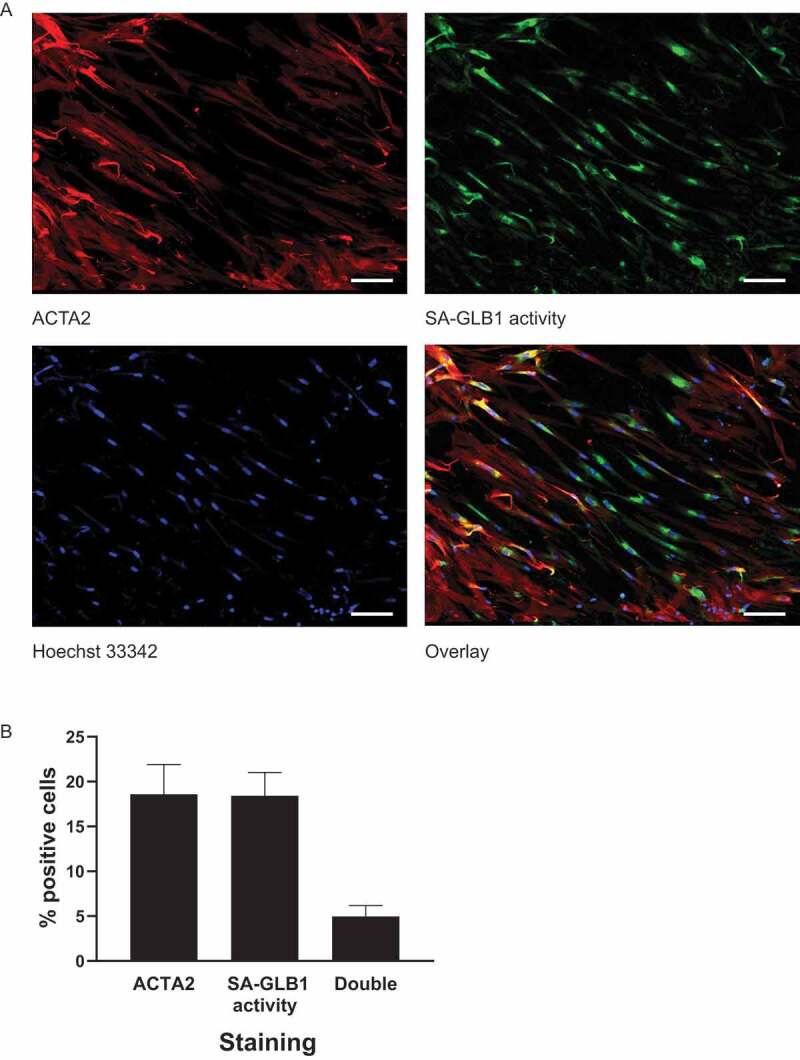
Cellular senescence and myofibroblast differentiation are not concomitantly activated in the same cells. (A) Representative photo of C12FGD and ACTA2 costaining in SS WI38 for 7 d, showing ACTA2 staining (upper left panel), SA-GLB1/β-gal activity (upper right panel), cell nuclei staining by Ho (lower left panel) and overlap of 3 images (lower right panel). Scale bar: 100 µm (B) Quantification of C12FGD and ACTA2 costaining. Numbers of nuclei stained by Ho were used as total numbers of cells. Data were shown as mean percentage of ACTA2, SA-GLB1/β-gal or double-positive cell in total cells (n = 4)
Discussion
Previous work has shown that autophagy and senescence affect tissue repair that can, in turn, result in fibrosis [6,8,14,41]. In the present study, we focus on fibroblasts and the links between autophagy, senescence, and myofibroblast differentiation. We found that ROS and sustained autophagy induce MTORC2 activity and that MTORC2 signaling concomitantly activates senescence and myofibroblast differentiation. We also show that senescence favors sustained MTORC2 activation while at the same time preventing myofibroblast differentiation.
The role of autophagy in cellular senescence has been studied in the context of oncogene activation [20,42], replicative senescence [22], and telomere dysfunction [43]. Here, we show that autophagy favors the induction of senescence in serum-starved fibroblasts. Inhibiting autophagy with 3-MA, LY, or siATG7 lowered the expression of senescence markers. We also identified a novel signaling pathway linking autophagy to senescence. We previously showed that the inhibition of autophagy with ATG7 silencing in serum-starved fibroblasts reduced MTORC2 activity [16]. We are now showing that MTORC2 activity, induced by prolonged SS, is pivotal to the expression of senescence markers. Inhibiting MTORC2 activity with rapamycin or siRICTOR lowered the expression of senescence markers. Thirdly, we demonstrated the importance of ROS in this process. Inhibition of ROS production in serum-starved fibroblasts with NAC or GSH, 2 ROS scavengers, curbed MTORC2 activation, and concomitantly limited senescence activation. ROS production occurs rapidly after the initiation of the autophagic response, whereas MTORC2 activation develops as a long-term response, suggesting a series of molecular intermediates between the two. Characterizing the detailed molecular machinery linking autophagy-induced ROS production to AKT1 phosphorylation will be the scope of future studies.
ROS are essential for the regulation of many cellular processes, and they are known inducers of autophagy [44]. For example, they are essentials for ATG4A (autophagy related 4A cysteine peptidase) activation and phagophore elongation [45]. ROS act as signaling molecules, and many enzymatic activities are known to be regulated by their redox status. They also control protein phosphatases and protein kinases, such as PTEN (phosphatase and tensin homolog) and AKT1 [46]. MTORC2 activity is also sensitive to the redox state [47]. Based on these observations and our present findings, it is plausible that MTORC2 activation, in long-term serum-starved fibroblasts, is linked with cellular ROS levels. This finding is in line with previously described roles of the MTOR pathway in regulating senescence-associated phenotypes [42]. We also noted that ROS production is rapidly and sustainably elevated in serum-starved fibroblasts while MTORC2 activation develops after 2 d of SS, suggesting a complex signaling cascade between autophagy, ROS production, and MTORC2 activation.
Nonetheless, ROS chelation with NAC and GSH inhibits MTORC2 activity, myofibroblast differentiation, and senescence, demonstrating the pivotal role for ROS in triggering this complex cascade. The mechanisms of ROS production after prolonged SS remain uncertain. Mitochondria are considered the principal source of ROS required for autophagy induction, and nutrient deprivation induces energetic stress, which, in turn, increases ATP demand and causes mitochondrial overburden in the face of adverse conditions [44]. Consequently, electron leakage and ROS production increase. Conversely, long-term ROS production may culminate in mitochondrial dysfunction. Indeed, high ROS levels are associated with oxidative stress, a known stimulus of senescence [25], and myofibroblast differentiation [39,48].
Consequently, mitochondria depolarize and fragment to facilitate their elimination by mitophagy to reduce ROS production and promote cell survival [49]. In our model, we showed that long-term serum-starvation induces mitochondrial fragmentation. NAC restored the mitochondrial hyperfused network suggesting that increased ROS production induced by serum-starvation damages mitochondria, while treatment with an ROS scavenger can prevent mitochondrial dysfunction in autophagic fibroblasts. Oxidative stress harms cellular components, such as proteins, lipids, and DNA. The DNA damage is sensed by TP53, which activates DNA damage response signaling that can potentially lead to senescence, often via CDKN1A induction [38,50].
In the present experimental setting, NAC and GSH inhibited senescence induction and myofibroblast differentiation. NAC and GSH also suppressed autophagy induction. These data highlight the dichotomic impact of autophagy on senescence induction and myofibroblast differentiation. As mentioned earlier, oxidative stress causes damage. It is possible that cumulative mitochondrial DNA damage causes mitochondrial dysfunction and enhances ROS levels, with autophagy being insufficient to restrain it. ROS then continuously damages nuclear DNA leading to senescence and myofibroblast differentiation.
The link between cellular senescence and myofibroblast differentiation has long remained elusive. By using genetic inhibition of senescence pathways, we demonstrated negative regulation of senescence on myofibroblast differentiation, as inhibition of senescence significantly increased the expression of ACTA2. Also, evaluation of senescence and myofibroblast markers in chronically serum-starved fibroblasts showed that the 2 programs occur in largely mutually exclusive cell subpopulations. These results are in line with the study showing that mice with ccn1 (cellular communication network factor 1)-null hepatocytes have non-senescent hepatic stellate cells (HSC) and increased fibrotic response [10]. It has also been demonstrated, in a murine skin wound closure model, that senescent fibroblasts appear early in the wound and accelerate wound closure by inducing myofibroblasts differentiation via secretion of PDGFA (platelet derived growth factor subunit A) [8]. However, in the same study, depletion of senescent cells resulted in excessive fibrosis, suggesting a role of cellular senescence in limiting excessive myofibroblast differentiation [8]. Our results can also reconcile the work of Hernandez-Gea et al., showing that autophagy enhances liver fibrosis with the work of Araya and colleagues [51] demonstrating an inhibitory function for autophagy in myofibroblast differentiation of pulmonary fibroblasts. We described a new signaling pathway linking autophagy to senescence and myofibroblast differentiation. MTORC2 activity induced by persistent SS determines the fate of cells either toward senescence or myofibroblast differentiation independently of MTORC1. Further studies will be needed to delineate the MTORC2 target signaling pathways leading to either senescence or myofibroblast differentiation.
In summary, our results demonstrate that in a serum-depleted environment, fibroblasts induce cell cycle arrest and autophagy to adapt to stress. If these stressful conditions are sustained, ROS production persists, favoring MTORC2 activation, and leading to long-term cell cycle arrest, senescence induction, or myofibroblast differentiation in distinct cell subpopulations. Activation of cellular senescence negatively regulates myofibroblast differentiation, likely as a means of avoiding excessive myofibroblast accumulation and fibrosis (Figure 7).
Figure 7.
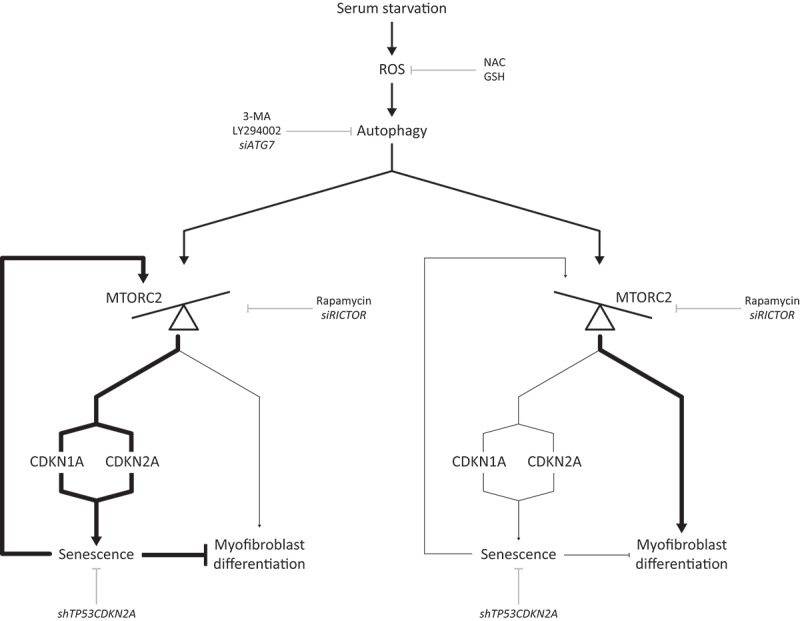
Proposed working model. Serum starvation induces ROS production which leads to increased autophagy. Sustained autophagy induces MTORC2 activity in fibroblasts. The activation of MTORC2 determines the fate of cells either toward senescence or myofibroblast differentiation. The factors downstream of MTORC2 that control the choice between either senescence or myofibroblast differentiation remain to be delineated. Senescence sustains MTORC2 activation while preventing myofibroblast differentiation
Materials and methods
Cell culture
WI-38 human fibroblasts from normal embryonic lung tissue were purchased from the American Type Culture Collection (CCL-75), grown in fibroblast basal medium (Lonza, CC-3131) supplemented with 10% inactivated fetal bovine serum (Wisent, 090150; normal growth medium [N]) and used between passages 6 and 8. Human Lung Fibroblast (HLF) from adult were purchased from Cell Applications (506-05A), grown in fibroblast basal medium supplemented with 10% inactivated fetal bovine serum and used at passage 6. For growth factor deprivation, the fibroblasts were washed twice with phosphate-buffered saline (PBS; Wisent, 311-425-CL) before being exposed to serum-free medium (SS). Media were replaced every other day. The cells were plated at a density of 20,000 cells/cm2 in 6-well plates and exposed to experimental conditions or vehicle (V) when they reached 80-90% confluence.
Immunoblotting
Cellular proteins were extracted, separated by electrophoresis, transferred to nitrocellulose membranes (Bio-Rad Laboratories, 162–0115) and probed, as described previously [16,52–54]. The antibodies used for immunoblotting were anti-ACTA2/αSMA (Sigma-Aldrich, A2547), anti-MAP1LC3B/LC3B (Novus, NB600-1384), anti-human SQSTM1/p62 (Cell Signaling Technology, 8025), anti-p-AKT1 (Ser473; Cell Signaling Technology, 9271), anti-AKT1 (Cell Signaling Technology, 9272), anti-RICTOR (Cell Signaling Technology, 2114), anti-RPTOR (Cell Signaling Technology, 2280), anti-ATG7 (R&D Systems, MAB6608), anti-CDKN1A/p21 (BD Biosciences, BD556430) and anti-CDKN2A/p16 (BD Biosciences, BD551153). Membranes were stained with Ponceau S Red (Sigma, P-3504) as loading control, and after initial probing, they were stripped and re-probed with anti-TUBA (tubulin alpha; Calbiochem, CP06). Densitometric analysis were conducted with AlphaImager, version 3.2 (Alpha Innotech Corporation, San Leandro, CA, USA). Data are expressed in arbitrary units.
SA-GLB1/β-gal staining
Cytochemical SA-GLB1/β-gal detection was done as described previously [29]. In brief, cells were washed with PBS, fixed in formalin (Sigma-Aldrich, HT5014), washed, and incubated overnight at 37°C with staining solution containing X-gal at 1 mg/ml (Invitrogen, 15520–034), pH 6.0.
Analysis of ROS production
ROS production was measured on adherent cells by fluorescence microplate reader after staining with CM-H2DCFDA (Molecular Probes, C6827), a dye which becomes fluorescent after oxidation by ROS. Briefly, cells were plated at 25,000 cells/well in 96-well dark-clear bottom plates. The next day, the wells were washed twice with PBS, and the cells were stained with 5 μM CM-H2DCFDA in PBS at 37°C for 30 min, then the wells were washed once with PBS and incubated with treatment medium for the desired time period (1 or 4 h). The plates were read by fluorescence plate reader (BMG Labtech, FLUOstar OPTIMA) at excitation wavelength of 495 nm and emission wavelength of 525 nm.
Immunofluorescence microscopy
WI38 were grown in 96-well fluorescence black plate (Corning, 29444–008), after serum-starved for 7 d, they were rinsed twice with PBS and fixed with 2% formaldehyde + 0.2% glutaraldehyde. Plates were then incubated in 33 mM C12FDG (Invitrogen, I2904) in PBS to determinate SA-GLB1/β-gal activity. Nuclei were stained with Hoechst 33342 (2′‐[4‐ethoxyphenyl]‐5‐[4‐methyl‐1‐piperazinyl]‐2.5′‐bi‐1H‐benzimidazole) (Ho; Sigma-Aldrich, B2261). The cells were then visualized under a Zeiss cell observer SD microscope (Carl Zeiss Canada Ltd, Toronto, ON, Canada) and the locations of captured area were saved. The cells were permeabilized with 0.1% Triton X-100 (Sigma-Aldrich, T9284) in PBS for 15 min. Plates were blocked with PBS-10% goat serum (Sigma-Aldrich, D9759), 0.1% Tween 20 (Sigma-Aldrich, P1379) for 15 min. For ACTA2 staining, cells were incubated with mouse monoclonal antibody (Sigma-Aldrich, A2547) 2 h and then Alexa Fluor 555-labeled anti-mouse antibody (Molecular Probes, A21203) for 40 min at room temperature in blocking buffer. The cells were then visualized under a Zeiss cell observer SD microscope at the same locations as C12FDG staining. The images taken at the same locations were then aligned using Olympus Visiomorph (Pittsburgh, PA, USA), and FIJI softwares. Quantification was done using FIJI softwares.
For assessment of mitochondrial morphology, WI38 were plated at 25,000 cells/well in 6-well plate. Once the cells reached confluence, they were incubated under serum starvation in the presence of NAC or vehicle for 4 or 7 d. Thirty minutes before the end of the treatment, 500 nM of MitoTracker Deep Red FM (Cell Signaling Technology, 8778S) was added to the wells. The cells were then washed with PBS and fixed with 4% paraformaldehyde for 15 min. Nuclei were stained with DAPI (4ʹ,6-Diamidino-2-Phenylindole, Dilactate; Invitrogen, D3571). Confocal images were acquired on an Olympus FV1000MPE confocal microscope (Pittsburgh, PA, USA) using a UPLSAPO 60x/1.35 Oil objective. Excitation system was performed using a 405 diode laser for DAPI, and a 635 nm diode laser for MitoTracker Deep Red FM (Invitrogen, M7513) using a sequential acquisition at 400 Hz scan speed. Detection bandwidth was 415–478 nm for DAPI and 571–765 nm for MitoTracker Deep Red FM. Images were acquired with the Fluoview 1000 MP software. Final images are 12 bits, 2048 × 2048 with a zoom factor 3 and scale is specified in the figure’s legends. Images were analyzed using FIJI software (NIH).
Small interfering RNAs
For ATG7 silencing, fibroblasts grown in normal conditions were harvested by trypsinization and separated in aliquots of 1.5 million cells. Separate aliquots were transfected with siATG7 (Dharmacon, L-020112-00), or siControl (Dharmacon, D-001810-03). We used the Amaxa Nucleofector electroporator (Amaxa, Gaithersburg, MD, USA) and Nucleofector electroporation kit for WI-38 cells (Lonza, VCA-1001) according to the manufacturer’s guidelines. The final concentration of siRNA was 150 pmol of siRNA/reaction. After electroporation, each cellular aliquot was plated in 2 wells of a 6-well plate in normal medium for 24 h. The media were then changed for the experimental condition (media without serum) after 2 washes with PBS. For 4 d in SS, the media were changed on day 2. For RICTOR and RPTOR silencing, fibroblasts were plated in 6-well plated at 20000 cells/cm2, after grown in normal condition for 24 h, transfection solution with oligofectamine (Invitrogen, 12252–011) and siRNA was prepared in RPMI according to the manufacturer’s guidelines, final concentrations of siRICTOR (Dharmacon, L-016984-00), siRPTOR (Dharmacon, L-004107-00) or siControl (Ctl; Dharmacon, D-001810-03) were 200 nM, cells were washed with 2X PBS and incubated with RPMI-based transfection solution, for 4 d in SS, the transfection solution was changed on day 2.
Viral infections
Gene depletion lenti-vectors were generated by inserting W51-1 shRNA cassettes (gateway transfer) inserted into the W17-1 destination lentivector (Addgene, 17387, Éric Campeau and 17295, Éric Campeau respectively [55]). The W51-1 shRNA cassettes containing either shRNATP53 (target 5-GACTCCAGTGGTAATCTAC-3 [56]), shRNACDKN2A (target 5-AACTATTCGGTGCGTTG-3 [5]) (Addgene, 22258, Eric Campeau) or shRNAGFP (5-GCTGGAGTACAACTACAAC-3 [56]). Lentivirus production and infection was done as previously described [55,57]. Briefly, packaging vectors and shRNA lenti-vectors were co-transfected into 293FT cells to produce infectious virus. Virus titers were adjusted to infect ~90% of the target proliferating WI38 cells at PD35. Following shRNAGFP or shRNATP53 infections, shRNATP53-infected cells were infected a second time with shRNACDKN2A to generate shTP53CDKN2A cells. The infected cell populations were selected using 100 μg/ml hygromycin B (Roche Life Science, 10843555001) for 2–3 d and used immediately afterward.
Reagents
LY294002 (LY, 440202) and 3-methyladenine (3-MA, 189490) were purchased from Calbiochem. Rapamycin (R; R0395), N-acetyl-L-cysteine (NAC; A9165), and L-glutathione reduced (GSH; G6013) were purchased from Sigma-Aldrich and zeocin (46–0509) from Invitrogen. All other reagents were purchased from Sigma Chemicals.
Statistical analysis
The results, expressed as means ± SEM, were analyzed by unpaired Student’s t-test, the Mann-Whitney test or ANOVA with post-hoc Bonferroni as appropriate. P < 0.05 was considered significant for all tests.
Supplementary Material
Acknowledgments
This work was supported by research grants from the Canadian Institutes of Health Research (CIHR, MOP-123436) to MJH, holder of the Shire Chair in Nephrology, Transplantation and Renal Regeneration of Université de Montréal. MJH is also supported by the Canadian Donation and Transplantation Research Program (CDTRP). MB is the recipient of a fellowship from Fonds de la recherche en santé du Québec (FRQS). FR is supported by a FRQS junior I-II career awards (22624, 33070) and a CIHR research grant (MOP114962). MAO received an Institut du cancer de Montréal Canderel fellowship. The authors thank the J.-L. Lévesque Foundation for renewed support, the members of the Rodier and Hébert laboratories for valuable comments and discussions, and the CRCHUM microscopy platform. Special thanks to Sophie Poirier for her help in quantification of immunofluorescence staining.
Funding Statement
This work was supported by the Canadian Institutes of Health Research [MOP-123436].
Disclosure statement
No potential conflict of interest was reported by the authors.
Supplementary material
Supplemental data for this article can be accessed here.
References
- [1].Tomasek JJ, Gabbiani G, Hinz B, et al. Myofibroblasts and mechano-regulation of connective tissue remodelling. Nat Rev Mol Cell Biol. 2002;3:349–363. [DOI] [PubMed] [Google Scholar]
- [2].Hinz B. Formation and function of the myofibroblast during tissue repair. J Invest Dermatol. 2007;127:526–537. [DOI] [PubMed] [Google Scholar]
- [3].Hinz B, Gabbiani G.. Fibrosis: recent advances in myofibroblast biology and new therapeutic perspectives. F1000 Biol Rep. 2010;2:78. [DOI] [PMC free article] [PubMed] [Google Scholar]
- [4].Regulski MJ. Cellular senescence: what, why, and how. Wounds. 2017;29:168–174. [PubMed] [Google Scholar]
- [5].Beausejour CM, Krtolica A, Galimi F, et al. Reversal of human cellular senescence: roles of the p53 and p16 pathways. Embo J. 2003;22:4212–4222. [DOI] [PMC free article] [PubMed] [Google Scholar]
- [6].Rodier F, Campisi J. Four faces of cellular senescence. J Cell Biol. 2011;192:547–556. Epub 2011 Feb 14. [DOI] [PMC free article] [PubMed] [Google Scholar]
- [7].Coppe JP, Patil CK, Rodier F, et al. Senescence-associated secretory phenotypes reveal cell-nonautonomous functions of oncogenic RAS and the p53 tumor suppressor. PLoS Biol. 2008;6:2853–2868. [DOI] [PMC free article] [PubMed] [Google Scholar]
- [8].Demaria M, Ohtani N, Youssef SA, et al. An essential role for senescent cells in optimal wound healing through secretion of PDGF-AA. Dev Cell. 2014;31:722–733. [DOI] [PMC free article] [PubMed] [Google Scholar]
- [9].Kodama T, Takehara T, Hikita H, et al. Increases in p53 expression induce CTGF synthesis by mouse and human hepatocytes and result in liver fibrosis in mice. J Clin Invest. 2011;121:3343–3356. Epub 2011 Jul 11. [DOI] [PMC free article] [PubMed] [Google Scholar]
- [10].Kim KH, Chen CC, Monzon RI, et al. Matricellular protein CCN1 promotes regression of liver fibrosis through induction of cellular senescence in hepatic myofibroblasts. Mol Cell Biol. 2013;33:2078–2090. Epub 2013 Mar 18. [DOI] [PMC free article] [PubMed] [Google Scholar]
- [11].Krizhanovsky V, Yon M, Dickins RA, et al. Senescence of activated stellate cells limits liver fibrosis. Cell. 2008;134:657–667. [DOI] [PMC free article] [PubMed] [Google Scholar]
- [12].Cheng S, Rodier F. Manipulating senescence in health and disease: emerging tools. Cell Cycle. 2015;14:1613–1614. [DOI] [PMC free article] [PubMed] [Google Scholar]
- [13].Codogno P, Meijer AJ. Autophagy and signaling: their role in cell survival and cell death. Cell Death Differ. 2005;12(Suppl 2):1509–1518. [DOI] [PubMed] [Google Scholar]
- [14].Hernandez-Gea V, Friedman SL. Autophagy fuels tissue fibrogenesis. Autophagy. 2012;8:849–850. .Epub 2012 May 1 [DOI] [PMC free article] [PubMed] [Google Scholar]
- [15].Kuwano K, Araya J, Hara H, et al. Cellular senescence and autophagy in the pathogenesis of chronic obstructive pulmonary disease (COPD) and idiopathic pulmonary fibrosis (IPF). Respir Investig. 2016;54:397–406. [DOI] [PubMed] [Google Scholar]
- [16].Bernard M, Dieude M, Yang B, et al. Autophagy fosters myofibroblast differentiation through MTORC2 activation and downstream upregulation of CTGF. Autophagy. 2014;10:2193–2207. [DOI] [PMC free article] [PubMed] [Google Scholar]
- [17].Kim SW, Kim HI, Thapa B, et al. Critical role of mTORC2-Akt signaling in TGF-beta1-induced myofibroblast differentiation of human pterygium fibroblasts. Invest Ophthalmol Vis Sci. 2019;60:82–92. [DOI] [PubMed] [Google Scholar]
- [18].Gewirtz DA. Autophagy and senescence: a partnership in search of definition. Autophagy. 2013;9:808–812. .Epub 2013 Feb19 [DOI] [PMC free article] [PubMed] [Google Scholar]
- [19].Kang C, Elledge SJ. How autophagy both activates and inhibits cellular senescence. Autophagy. 2016;12:898–899. [DOI] [PMC free article] [PubMed] [Google Scholar]
- [20].Young AR, Narita M, Ferreira M, et al. Autophagy mediates the mitotic senescence transition. Genes Dev. 2009;23:798–803. Epub 2009 Mar 11. [DOI] [PMC free article] [PubMed] [Google Scholar]
- [21].Goehe RW, Di X, Sharma K, et al. The autophagy-senescence connection in chemotherapy: must tumor cells (self) eat before they sleep? J Pharmacol Exp Ther. 2012;343:763–778. Epub 2012 Aug 27. [DOI] [PMC free article] [PubMed] [Google Scholar]
- [22].Kang HT, Lee KB, Kim SY, et al. Autophagy impairment induces premature senescence in primary human fibroblasts. PLoS One. 2011;6:e23367. Epub 2011 Aug 8. [DOI] [PMC free article] [PubMed] [Google Scholar]
- [23].Malaquin N, Martinez A, Rodier F. Keeping the senescence secretome under control: molecular reins on the senescence-associated secretory phenotype. Exp Gerontol. 2016;82:39–49. Epub May 25. [DOI] [PubMed] [Google Scholar]
- [24].Itahana K, Dimri GP, Hara E, et al. A role for p53 in maintaining and establishing the quiescence growth arrest in human cells. J Biol Chem. 2002;277:18206–18214. Epub 2002 Mar 5. [DOI] [PubMed] [Google Scholar]
- [25].Collado M, Serrano M. The power and the promise of oncogene-induced senescence markers. Nat Rev Cancer. 2006;6:472–476. [DOI] [PubMed] [Google Scholar]
- [26].Narita M, Nunez S, Heard E, et al. Rb-mediated heterochromatin formation and silencing of E2F target genes during cellular senescence. Cell. 2003;113:703–716. [DOI] [PubMed] [Google Scholar]
- [27].Zhang R, Poustovoitov MV, Ye X, et al. Formation of MacroH2A-containing senescence-associated heterochromatin foci and senescence driven by ASF1a and HIRA. Dev Cell. 2005;8:19–30. [DOI] [PubMed] [Google Scholar]
- [28].Rayess H, Wang MB, Srivatsan ES. Cellular senescence and tumor suppressor gene p16. Int J Cancer. 2012;130:1715–1725. Epub 2011 Dec 5. [DOI] [PMC free article] [PubMed] [Google Scholar]
- [29].Debacq-Chainiaux F, Erusalimsky JD, Campisi J, et al. Protocols to detect senescence-associated beta-galactosidase (SA-betagal) activity, a biomarker of senescent cells in culture and in vivo. Nat Protoc. 2009;4:1798–1806. Epub. [DOI] [PubMed] [Google Scholar]
- [30].Klionsky DJ, Abdalla FC, Abeliovich H, et al. Guidelines for the use and interpretation of assays for monitoring autophagy. Autophagy. 2012;8:445–544. [DOI] [PMC free article] [PubMed] [Google Scholar]
- [31].Wu YT, Tan HL, Shui G, et al. Dual role of 3-methyladenine in modulation of autophagy via different temporal patterns of inhibition on class I and III phosphoinositide 3-kinase. J Biol Chem. 2010;285:10850–10861. Epub 2010 Feb 1. [DOI] [PMC free article] [PubMed] [Google Scholar]
- [32].Blommaart EF, Krause U, Schellens JP, et al. The phosphatidylinositol 3-kinase inhibitors wortmannin and LY294002 inhibit autophagy in isolated rat hepatocytes. Eur J Biochem. 1997;243:240–246. [DOI] [PubMed] [Google Scholar]
- [33].Petiot A, Ogier-Denis E, Blommaart EF, et al. Distinct classes of phosphatidylinositol 3ʹ-kinases are involved in signaling pathways that control macroautophagy in HT-29 cells. J Biol Chem. 2000;275:992–998. [DOI] [PubMed] [Google Scholar]
- [34].Komatsu M, Waguri S, Ueno T, et al. Impairment of starvation-induced and constitutive autophagy in Atg7-deficient mice. J Cell Biol. 2005;169:425–434. Epub 2005 May 2. [DOI] [PMC free article] [PubMed] [Google Scholar]
- [35].Sarbassov DD, Ali SM, Sengupta S, et al. Prolonged rapamycin treatment inhibits mTORC2 assembly and Akt/PKB. Mol Cell. 2006;22:159–168. Epub 2006 Apr 6. [DOI] [PubMed] [Google Scholar]
- [36].Laplante M, Sabatini DM. mTOR signaling in growth control and disease. Cell. 2012;149:274–293. [DOI] [PMC free article] [PubMed] [Google Scholar]
- [37].Gibson SB. Investigating the role of reactive oxygen species in regulating autophagy. Methods Enzymol. 2013;528:217–235. [DOI] [PubMed] [Google Scholar]
- [38].Gambino V, De Michele G, Venezia O, et al. Oxidative stress activates a specific p53 transcriptional response that regulates cellular senescence and aging. Aging Cell. 2013;12:435–445. Epub 2013 Mar 27. [DOI] [PMC free article] [PubMed] [Google Scholar]
- [39].Barnes JL, Gorin Y. Myofibroblast differentiation during fibrosis: role of NAD(P)H oxidases. Kidney Int. 2011;79:944–956. Epub 1 Feb 9. [DOI] [PMC free article] [PubMed] [Google Scholar]
- [40].Paddison PJ, Caudy AA, Bernstein E, et al. Short hairpin RNAs (shRNAs) induce sequence-specific silencing in mammalian cells. Genes Dev. 2002;16:948–958. [DOI] [PMC free article] [PubMed] [Google Scholar]
- [41].Hernandez-Gea V, Ghiassi-Nejad Z, Rozenfeld R, et al. Autophagy releases lipid that promotes fibrogenesis by activated hepatic stellate cells in mice and in human tissues. Gastroenterology. 2012;142:938–946. Epub 2 Jan 10. [DOI] [PMC free article] [PubMed] [Google Scholar]
- [42].Laberge RM, Sun Y, Orjalo AV, et al. MTOR regulates the pro-tumorigenic senescence-associated secretory phenotype by promoting IL1A translation. Nat Cell Biol. 2015;17:1049–1061. Epub 2015 Jul 6. [DOI] [PMC free article] [PubMed] [Google Scholar]
- [43].Mar FA, Debnath J, Stohr BA. Autophagy-independent senescence and genome instability driven by targeted telomere dysfunction. Autophagy. 2015;11:527–537. [DOI] [PMC free article] [PubMed] [Google Scholar]
- [44].Filomeni G, De Zio D, Cecconi F. Oxidative stress and autophagy: the clash between damage and metabolic needs. Cell Death Differ. 2015;22:377–388. Epub Sep 26. [DOI] [PMC free article] [PubMed] [Google Scholar]
- [45].Scherz-Shouval R, Shvets E, Fass E, et al. Reactive oxygen species are essential for autophagy and specifically regulate the activity of Atg4. Embo J. 2007;26: 1749–1760. Epub 2007 Mar 8. [DOI] [PMC free article] [PubMed] [Google Scholar]
- [46].Corcoran A, Cotter TG. Redox regulation of protein kinases. Febs J. 2013;280:1944–1965. Epub 2013 Mar 21. [DOI] [PubMed] [Google Scholar]
- [47].Nayak BK, Feliers D, Sudarshan S, et al. Stabilization of HIF-2alpha through redox regulation of mTORC2 activation and initiation of mRNA translation. Oncogene. 2013;32:3147–3155. Epub Aug 6. [DOI] [PMC free article] [PubMed] [Google Scholar]
- [48].Hecker L, Vittal R, Jones T, et al. NADPH oxidase-4 mediates myofibroblast activation and fibrogenic responses to lung injury. Nat Med. 2009;15:1077–1081. Epub 9 Aug 23. [DOI] [PMC free article] [PubMed] [Google Scholar]
- [49].Willems PH, Rossignol R, Dieteren CE, et al. Redox homeostasis and mitochondrial dynamics. Cell Metab. 2015;22:207–218. [DOI] [PubMed] [Google Scholar]
- [50].Muteliefu G, Shimizu H, Enomoto A, et al. Indoxyl sulfate promotes vascular smooth muscle cell senescence with upregulation of p53, p21, and prelamin A through oxidative stress. Am J Physiol Cell Physiol. 2012;303:C126–34. Epub 2012 May 2. [DOI] [PubMed] [Google Scholar]
- [51].Araya J, Kojima J, Takasaka N, et al. Insufficient autophagy in idiopathic pulmonary fibrosis. Am J Physiol Lung Cell Mol Physiol. 2013;304:L56–69. [DOI] [PubMed] [Google Scholar]
- [52].Laplante P, Raymond MA, Gagnon G, et al. Novel fibrogenic pathways are activated in response to endothelial apoptosis: implications in the pathophysiology of systemic sclerosis. J Immunol. 2005;174:5740–5749. [DOI] [PubMed] [Google Scholar]
- [53].Cailhier JF, Sirois I, Laplante P, et al. Caspase-3 activation triggers extracellular cathepsin L release and endorepellin proteolysis. J Biol Chem. 2008;283:27220–27229. Epub 2008 Jul 24. [DOI] [PubMed] [Google Scholar]
- [54].Laplante P, Sirois I, Raymond MA, et al. Caspase-3-mediated secretion of connective tissue growth factor by apoptotic endothelial cells promotes fibrosis. Cell Death Differ. 2010;17:291–303. Epub Sep 4. [DOI] [PubMed] [Google Scholar]
- [55].Campeau E, Ruhl VE, Rodier F, et al. A versatile viral system for expression and depletion of proteins in mammalian cells. PLoS One. 2009;4:e6529. [DOI] [PMC free article] [PubMed] [Google Scholar]
- [56].Rodier F, Coppe JP, Patil CK, et al. Persistent DNA damage signalling triggers senescence-associated inflammatory cytokine secretion. Nat Cell Biol. 2009;11:973–979. [DOI] [PMC free article] [PubMed] [Google Scholar]
- [57].Rodier F, Munoz DP, Teachenor R, et al. DNA-SCARS: distinct nuclear structures that sustain damage-induced senescence growth arrest and inflammatory cytokine secretion. J Cell Sci. 2011;124:68–81. [DOI] [PMC free article] [PubMed] [Google Scholar]
Associated Data
This section collects any data citations, data availability statements, or supplementary materials included in this article.