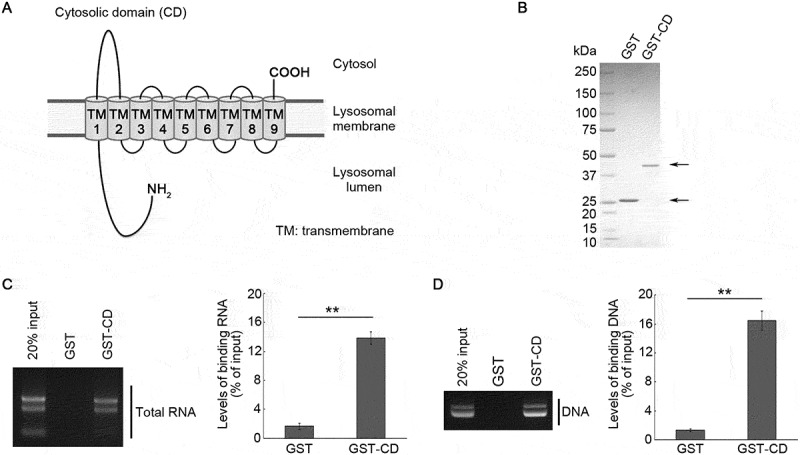
Figure 1.

Interaction of SIDT2 CD with RNA and DNA. (A) Schematic diagram of the SIDT2 structure. (B) GST and GST-CD purified from Rosetta 2 competent cells were separated by SDS-PAGE. Following separation, we stained the resolved proteins with CBB. (C, D) Affinity-isolation assays were performed using GST or GST-CD and 1 μg of total RNA extracted from mice brains (C) or 1 μg of plasmid DNA (D). After elution, levels of affinity-isolated RNA or DNA were analyzed by agarose gel electrophoresis, followed by EtBr staining. The intensities of nucleic acid signals were quantified. **, P < 0.01 (n = 3)
