Int J Mol Med 41: 2150-2158, 2018; DOI: 10.3892/ijmm.2018.3431
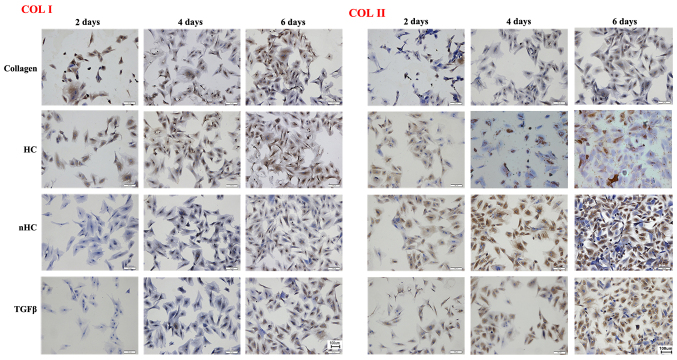
During the preparation of the figures in the above article, the authors regret that errors occurred during the assembly of Figs. 3, 5 and 6. An incorrect image for the calcein-AM/PI staining data panel for nHC and transforming growth factor-β (TGF-β) group at 6 days was shown in Fig. 3A; similarly, in both Figs. 5A and 6, images were selected incorrectly for safranin O and collagen type II (COL II) staining for the hydroxyapatite/collagen (HC) group at 4 and 6 days, and also COL II staining for the TGF-β group at 4 days in Fig. 6. Each of these errors were attributed to an accidental mix-up of the data during the image compilation process.
Figure 3.
Cell viability. (A) Cell viability was examined by calcein-AM/PI staining. Cells seeded on nHC, HC and pure collagen film are shown. Cells in green are alive and cells in red are dead. (B) The quantities of live and dead cells were calculated and analyzed from the results of the calcein-AM/PI staining images. The cell numbers were counted using the 'cell calculating' toolbar in nikon a1 software. the data are reported as the mean ± standard deviation. *P<0.05, **P<0.01 and ***P<0.001 vs. the collagen-based groups; #P<0.05, ##P<0.01 and ###P<0.001 for comparisons between the collagen-based groups and the TGF-β group. TGF-β, transforming growth factor-β; C, collagen; HC, hydroxyapatite/collagen; nHc, nano-HC; calcein-AM/PI, acetoxymethyl/propidium iodide.
Figure 5.
Aggrecan secretion. (A) AGC appeared orange following reaction with safranin O. The results of the safranin O staining show that the orange color is more evident in the nHC group than in the HC and collagen groups. (B) The histograms show that the GAGs and DNA contents were highest in the nHC group than in the other collagen-based groups and even the positive group, which was TGF-β added to culture medium. However, the ratio of GAG to DNA in the nHC group was lower than in the TGF-β group. The data are reported as the mean ± standard deviation. *P<0.05, **P<0.01 and ***P<0.001 vs. the collagen-based groups; #P<0.05, ##P<0.01 and ###P<0.001 for comparisons between the collagen-based groups and the TGF-β group. TGF-β, transforming growth factor-β; C, collagen; HC, hydroxyapatite/collagen; nHC, nano-HC; calcein-AM/PI, acetoxymethyl/propidium iodide; GAGs, glycosaminoglycans.
Figure 6.
Immunohistochemical staining. Stronger positive expression (brown-yellow color) of COL-II and weaker expression of COL-I was observed in the nHC group compared with that in the HC and pure collagen groups, indicating that the chondrcocyte phenotype and biological functions could be maintained effectively when cells were cultured on nHC film for a long time period. HC, hydroxyapatite/collagen; nHC, nano-HC; calcein-AM/PI, acetoxymethyl/propidium iodide; TGF-β, transforming growth factor-β; COL-I, collagen type I; COL-II, collagen type II.
Corrected versions of Figs. 3, 5 and 6 are shown on the next two pages. These errors did not affect the major conclusions reported in the paper. All the authors have agreed to this Corrigendum, and thank the Editor of International Journal of Molecular Medicine for allowing them the opportunity to publish this. The authors regret these errors went unnoticed during the compilation of the three figures in question, and apologize to the readership for any confusion that it may have caused.


