

Abstract
Purpose
Several patients experience unexplained persistent symptoms after SARS-CoV-2 recovering. We aimed at evaluating if 2-deoxy-2-[18F]fluoro-D-glucose ([18F]FDG) was able to demonstrate a persistent inflammatory process.
Methods
Recovered adult COVID-19 patients, who complained unexplained persisting symptoms for more than 30 days during the follow-up visits, were invited to participate in the study. Patients fulfilling inclusion criteria were imaged by [18F]FDG positron emission tomography/computed tomography ([18F]FDG-PET/CT). Whole-body [18F]FDG-PET/CT, performed according to good clinical practice, was qualitatively (comparison with background/liver) and semi-quantitatively (target-to-blood pool ratio calculated as average SUVmax artery/average SUVmean inferior vena cava) analyzed. Negative follow-up [18F]FDG-PET/CT images of oncologic patients matched for age/sex served as controls. Mann-Whitney test was used to test differences between groups. SPSS version 26 was used for analyses.
Results
Ten recovered SARS-CoV-2 patients (seven male and three females, median age 52 years, range 46–80) with persisting symptoms were enrolled in the study. Common findings at visual analysis were increased [18F]FDG uptake in bone marrow and blood vessels (8/10 and 6/10 cases, respectively). [18F]FDG uptake in bone marrow did not differ between cases and controls (p = 0.16). The total vascular score was similar in the two groups (p = 0.95). The target-to-blood pool ratio resulted higher in recovered SARS-CoV-2 patients than in controls.
Conclusion
Although the total vascular score was similar in the two groups, the target-to-blood pool ratio was significantly higher in three vascular regions (thoracic aorta, right iliac artery, and femoral arteries) in the recovered COVID-19 cohort than in controls, suggesting that SARS-CoV-2 induces vascular inflammation, which may be responsible for persisting symptoms.
Keywords: SARS-CoV-2, Vasculitis, [18F]FDG-PET/CT, Infection, Inflammation, Long COVID
Introduction
The SARS-CoV-2 infection manifests with a broad spectrum of clinical patterns ranging from minimally or asymptomatic cases to mild illness, to severe infection, to critical disease [1]. Evidence suggests that hyperinflammation magnifies the clinical manifestations of COVID-19 infection [2], and it may lead to a syndrome similar to Kawasaki disease in children [3]. Moreover, several patients experience unexplained persistent symptoms including fatigue, dyspnea, joint, and/or chest pain, after SARS-CoV-2 recovering. A recent study reported long COVID in up to 87% patients (≥ 3 symptoms in 55% of cases), with a negative impact on the quality of life in 44% of cases [4]. Persistent symptoms partially overlap with the typical syndromes—including the chronic fatigue syndrome—which can occur after viral infections and community-acquired pneumonia [4]. However, it is not yet known if persistent symptoms are virus-related (i.e., persistent infection undetectable by commonly used tests), hyperinflammation-related (i.e., cytokines storm alter the immune response function resulting in a preserving “energy strategy” of the host), or injury related (e.g., alveolar damage and/or epithelial damage caused by the infection). The long COVID includes a wide range of symptoms, suggesting an underlining systemic disease. [18F]FDG-PET/CT, originally introduced in clinical practice for oncological indications and currently recommended in many infectious and inflammatory conditions [5], represents a valuable tool to characterize patients with persisting symptoms. We aimed at evaluating if 2-deoxy-2-[18F]fluoro-D-glucose ([18F]FDG) was able to demonstrate a persistent inflammatory process in the vascular epithelium or in any other site.
Methods
Study population
Beginning in June 2020, recovered adult COVID-19 patients, who complained unexplained persisting symptoms for more than 30 days during the follow-up visits (regardless of the severity of acute infection), were invited to participate in the study. The Ethics Committee of the Humanitas Clinical and Research Centre approved the study, and patients provided written informed consent before being enrolled. Patients fulfilling inclusion criteria were imaged by [18F]FDG positron emission tomography/computed tomography ([18F]FDG-PET/CT). Until August 10, 2020, we enrolled in the study 10 recovered SARS-CoV-2 patients (seven male and three females, mean age ± standard deviation = 58 ± 13 years, median age 52 years, range 46–80) with persisting unexplained symptoms (one or two symptoms and ≥ 3 symptoms in six and four cases, respectively). At onset, 9/10 patients experienced fever associated to other symptoms including dyspnea (n = 6), cough (n = 7), fatigue (n = 4), anosmia and/or ageusia (n = 3), respiratory failure (n = 2), joint pain (n = 2), delirium (n = 1), acute renal failure (n = 1), chest pain (n = 1), cardiac rhythm abnormalities (n = 1), headache (n = 1), and otalgia (n = 1). Pneumonia was confirmed in 8/10 cases. Five patients were hospitalized. Five patients took drugs for symptom relief (paracetamol and/or antimicrobial treatment). Three patients were medically treated with hydroxychloroquine and low molecular weight heparin in addition to symptomatic treatment, and one of them required also oxygen. Two patients referred to intensive care unit were intubated. Persisting symptoms including dyspnea (n = 7), fatigue (n = 7), ageusia (n = 2), anosmia (n = 2), joint pain (n = 2), chest pain (n = 1), headache (n = 1), and trembling hands (n = 1). None of the recovered SARS-CoV-2 patients took steroids at the time of PET/CT. Negative follow-up [18F]FDG-PET/CT images of oncologic patients (lymphoma n = 7, melanoma n = 2, head and neck cancer = 1) matched for age and sex were used as controls.
[18F]FDG-PET/CT
Whole-body [18F]FDG-PET/CT was performed according to EANM/SNMMI Guidelines for [18F]FDG in inflammation and infection [5]. Briefly, image acquisition was performed approximately 60 min after intravenous [18F]FDG administration (activity 2.5–4 MBq per kilogram bodyweight), using a Discovery PET/CT 690 scanner (General Electric Healthcare, Waukesha, WI, USA) EARL accredited (http://earl.eanm.org/cms/website.php). Clinical data including date and stage of infection, onset and persistent symptoms, recovery date, duration of persistent symptoms, laboratory tests, and concomitant medications were collected at the time of [18F]FDG-PET/CT. Negative follow-up [18F]FDG-PET/CT of oncologic patients were acquired as total-body images according to good clinical practice [6]. Qualitative and semi-quantitative analysis was performed. All images were assessed visually and defined negative when no area of increased [18F]FDG uptake compared with background was observed. The criterion for positivity was at least one abnormal area of radiopharmaceutical uptake outside the physiological [18F]FDG distribution or higher than the surrounding physiological activity. Vascular [18F]FDG uptake was assessed according to the procedural recommendation of the EANM for [18F]FDG-PET/CT(A) imaging in large vessel vasculitis and polymyalgia rheumatic [7]. The total vascular score (range from 0 to 21) was calculated at seven different vascular regions (carotid arteries, subclavian arteries, axillary arteries, thoracic and abdominal aorta, iliac arteries, and femoral arteries). Whenever [18F]FDG uptake was equal or lower than mediastinum, vascular regions were defined negative. Positive regions were scored as 1, 2, or 3 based on the [18F]FDG grade of uptake compared with liver (lower, similar, and higher, respectively). The target-to-blood pool ratio was calculated for the same vascular regions (twice for bilateral arteries and distinguishing the three parts of the thoracic aorta), normalizing the arterial wall uptake to the background activity of inferior vena cava (average SUVmax artery/average SUVmean vein) [7]. Overall, 14 target-to-blood pool ratios were calculated. The size of the proximal ascending aorta was measured on the non-enhanced CT component of PET/CT and indexed for the body surface area (Mosteller method).
Statistical analysis
Descriptive statistics were used to summarize patient characteristics. Mann-Whitney test was used to test differences between the two groups. A p value ≤ 0.05 was considered statistically significant. SPSS version 26 was used for analyses.
Results
We observed mild [18F]FDG lung uptake in 2/10 cases corresponding to mild fibrosis areas at CT images. This typical finding of recovered SARS-CoV-2 pneumonia patients was observed in the CT component of other 4/10 cases without any tracer uptake. Common findings at visual analysis in the COVID-19 group were increased [18F]FDG uptake in bone marrow and blood vessels (8/10 and 6/10 cases, respectively). Table 1 summarizes semi-quantitative analysis. [18F]FDG uptake in bone marrow was semi-quantitatively higher in controls than in the long COVID group, even if not statistically different (p = 0.16). The total vascular score was ≥ 10 (maximum value = 14) in 5/10 and 4/10 patients in the COVID-19 and the control group, respectively (Fig. 1a). The target-to-blood pool ratio resulted higher in recovered SARS-CoV-2 patients than in controls in 13 out of 14 analyzed arteries (Fig. 1b). The only exception was observed in the right subclavian artery where the median value of the target-to-blood pool ratio was higher in the control group than in COVID-19 patients. Correlation with laboratory tests and ascending aorta target-to-blood pool ratio is provided in Fig. 2 for a subset of patients. The size of the proximal ascending aorta indexed for the body surface area did not differ in the two groups (Fig. 3). Figure 4 shows some examples of recovered SARS-CoV-2 patients imaged by [18F]FDG-PET/CT.
Table 1.
Results of semi-quantitative analysis in the COVID-19 and control group
| COVID-19 | Controls | p value | |
|---|---|---|---|
| Bone marrow, [18F]FDG uptake (SUVmax) | |||
| Mean | 1.26 | 1.90 | 0.165 |
| Median | 1.29 | 2.00 | |
| Standard deviation | 0.59 | 1.06 | |
| Range | 0.57–2.47 | 0.38–3.55 | |
| Total visual score | |||
| < 5 | 1 | 1 | 0.956 |
| 5–9 | 4 | 5 | |
| ≥ 10 | 5 | 4 | |
| Right carotid artery target-to-blood pool ratio | |||
| Mean | 1.33 | 1.22 | 0.393 |
| Median | 1.32 | 1.16 | |
| Standard deviation | 0.24 | 0.21 | |
| Range | 1.00–1.74 | 0.98–1.67 | |
| Left carotid artery target-to-blood pool ratio | |||
| Mean | 1.28 | 1.32 | 0.481 |
| Median | 1.30 | 1.17 | |
| Standard deviation | 0.23 | 0.53 | |
| Range | 0.87–1.71 | 0.94–2.76 | |
| Right subclavian artery target-to-blood pool ratio | |||
| Mean | 1.06 | 1.04 | 1.000 |
| Median | 0.94 | 1.07 | |
| Standard deviation | 0.41 | 0.34 | |
| Range | 0.41–1.81 | 0.54–1.60 | |
| Left subclavian artery target-to-blood pool ratio | |||
| Mean | 1.07 | 1.01 | 0.353 |
| Median | 1.10 | 1.04 | |
| Standard deviation | 0.20 | 0.16 | |
| Range | 0.65–1.30 | 0.70–1.19 | |
| Right axillar artery target-to-blood pool ratio | |||
| Mean | 1.03 | 0.98 | 0.968 |
| Median | 0.89 | 0.83 | |
| Standard deviation | 0.42 | 0.34 | |
| Range | 0.51–1.76 | 0.64–1.70 | |
| Left axillar artery target-to-blood pool ratio | |||
| Mean | 1.04 | 0.95 | 0.968 |
| Median | 1.03 | 0.87 | |
| Standard deviation | 0.21 | 0.24 | |
| Range | 0.72–1.40 | 0.61–1.29 | |
| Ascending aorta target-to-blood pool ratio | |||
| Mean | 1.88 | 1.33 | 0.002 |
| Median | 1.85 | 1.20 | |
| Standard deviation | 0.23 | 0.32 | |
| Range | 1.63–2.31 | 1.00–1.92 | |
| Aortic arch target-to-blood pool ratio | |||
| Mean | 1.91 | 1.29 | 0.001 |
| Median | 1.96 | 1.22 | |
| Standard deviation | 0.37 | 0.23 | |
| Range | 1.19–2.52 | 1.05–1.78 | |
| Descending aorta target-to-blood pool ratio | |||
| Mean | 1.66 | 1.35 | 0.007 |
| Median | 1.61 | 1.36 | |
| Standard deviation | 0.31 | 0.14 | |
| Range | 1.24–2.24 | 1.16–1.53 | |
| Abdominal aorta target-to-blood pool ratio | |||
| Mean | 1.86 | 1.58 | 0.143 |
| Median | 1.79 | 1.59 | |
| Standard deviation | 0.46 | 0.24 | |
| Range | 1.20–2.75 | 1.09–1-90 | |
| Right iliac artery target-to-blood pool ratio | |||
| Mean | 1.66 | 1.27 | 0.029 |
| Median | 1.62 | 1.23 | |
| Standard deviation | 0.37 | 0.28 | |
| Range | 1.24–2.38 | 0.87–1.66 | |
| Left iliac artery target-to-blood pool ratio | |||
| Mean | 1.58 | 1.38 | 0.123 |
| Median | 1.41 | 1.27 | |
| Standard deviation | 0.38 | 0.42 | |
| Range | 1.15–2.23 | 1.05–2.49 | |
| Right femoral artery target-to-blood pool ratio | |||
| Mean | 1.72 | 1.31 | 0.015 |
| Median | 1.71 | 1.28 | |
| Standard deviation | 0.34 | 0.32 | |
| Range | 1.29–2.30 | 0.77–1.92 | |
| Left femoral artery target-to-blood pool ratio | |||
| Mean | 1.64 | 1.23 | 0.007 |
| Median | 1.53 | 1.19 | |
| Standard deviation | 0.34 | 0.29 | |
| Range | 1.25–2.24 | 0.74–1.74 | |
| Ascending aorta, size (mm) | |||
| Mean | 35 | 31 | 0.016 |
| Median | 35 | 31 | |
| Standard deviation | 3 | 4 | |
| Range | 30–39 | 24–37 | |
| Ascending aorta indexed for the body surface area (mm/m2) | |||
| Mean | 17.99 | 16.69 | 0.436 |
| Median | 16.95 | 16.57 | |
| Standard deviation | 2.95 | 1.73 | |
| Range | 15.39–24.49 | 13.99–19.55 | |
Fig. 1.

[18F]FDG uptake in blood vessels (title). Box-and-whisker plot of the total vascular uptake (a) and of the target-to-blood pool ratio (b) (significance is reported only for p values ≤ 0.05)
Fig. 2.

Scatterplot of the correlation between target-to-blood pool ratio and laboratory tests in a subset of recovered SARS-CoV-2 patients: a C-reactive protein (CRP) peak, d lactate dehydrogenase (LDH) peak, c D-dimer peak
Fig. 3.
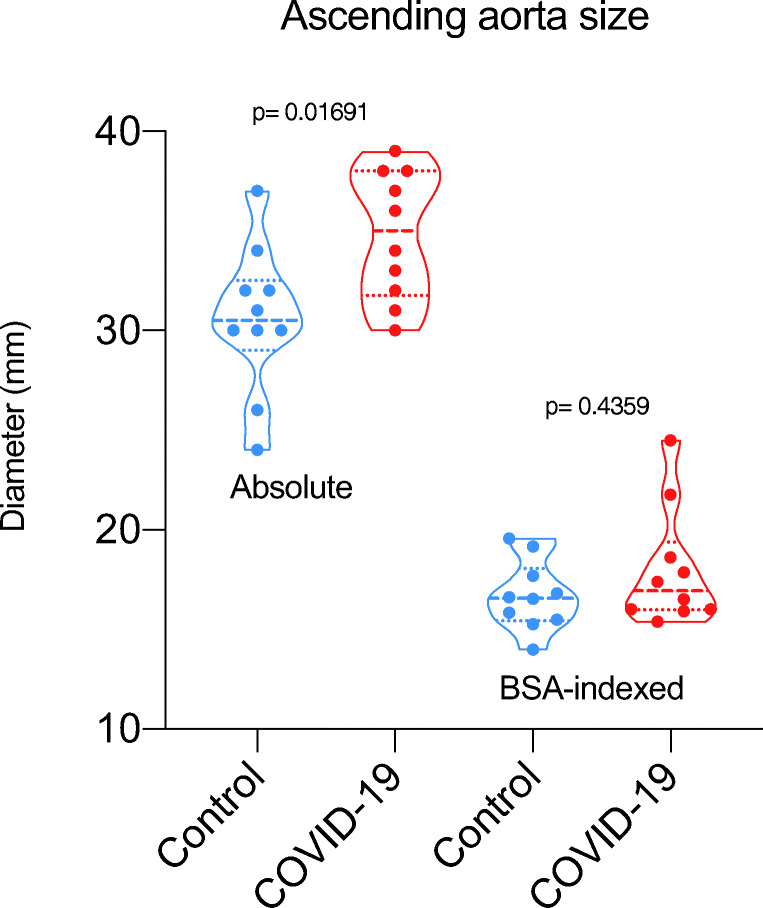
Box-and-whisker of the size of the proximal ascending aorta (significance is reported only for p values ≤ 0.05)
Fig. 4.

[18F]FDG-PET/CT in recovered SARS-CoV-2 patients (title). Example of [18F]FDG bone marrow uptake in a 50-year-old female patient with persisting symptoms (dyspnea and fatigue) lasting for almost 3 months (MIP in a). She took only symptomatic treatment during the acute phase of infection. Example of [18F]FDG vascular uptake in a 51-year-old male patient with persisting symptoms (fatigue) lasting for almost 4 months. He developed an acute respiratory distress syndrome, which finally required endotracheal intubation and invasive ventilation. Visually, the [18F]FDG uptake was scored as grade 2 at the ascending aorta, the aortic arch (b) and the descending aorta (c)
Discussion
Although the total vascular score was similar in the two groups, the target-to-blood pool ratio was significantly higher in three vascular regions (thoracic aorta, right iliac artery, and femoral arteries) in the long COVID than in controls. These data suggest that SARS-CoV-2 induces vascular inflammation, which may be responsible for persisting symptoms. To the best of our knowledge, this is the first report on [18F]FDG-PET/CT suggesting that COVID-19 associated vasculitis as cause of persisting symptoms after SARS-CoV-2 recovering. Becker [8, 9] and Libby and Lüscher [10] have recently explored the hypothesis that COVID-19 represents an endothelial disease, providing a unifying pathophysiological description of this stormy infection. Our data, even if preliminary, supported this hypothesis. The distinct feature of [18F]FDG vascular uptake in long COVID was the smooth linear pattern, similar to that observed in large vessel vasculitis. The size of ascending aorta indexed for the body surface area did not differ between the two groups. However, the exact mechanism underlying a possible long-lasting COVID-19-associated vasculitis in recovered SARS-CoV-2 patients is still unknown, and the inflammation in these very late phases of the disease is expected to progressively improve until complete remission. We evaluated the correlation between some of the laboratory tests proven to have a prognostic role and the ascending aorta target-to-background ratio. The observed trend prevents to draw any conclusion, but supports that more data are worth to be collected. Furthermore, we observed [18F]FDG uptake in bone marrow, even if it did not differ between cases and controls (p = 0.16). However, it should be acknowledged that oncologic patients may have treatment-related bone marrow [18F]FDG uptake. The majority of controls were lymphoma patients studied after chemotherapy, and in this setting, bone marrow uptake is a typical treatment-related finding. Therefore, data on bone marrow—higher in controls than in long COVID—should be carefully interpreted. Limitations of this preliminary experience include the small sample size, the availability of laboratory tests for only a subset of patients, the lack of accurate morphological data on vessels (size and wall thickening of all vascular regions), and the use of oncological patients as controls. Confirmation of these results might drive a change in the treatment of SARS-CoV-2 infection and an additional insight in COVID-19 pathophysiology.
Acknowledgments
We thank Dr. Silvia Chiola and Mr. Lorenzo Leonardi for assistance in patients’ enrollment. Further, we are grateful to physicians and healthcare personnel who has taken care of COVID-19 patients.
Authors’ contributions
AC and MS conceptualized the study; AC, AA, MC, MC, MS designed the study; PM, MC, MS, and AA screened patients; FG and AC enrolled; PM, MC, and FG collected the clinical data; MS, AC, and FG performed image and data analysis; AC; MS, PM, MC, AA, and MC critically interpreted results; MS and AC drafted the paper. All the authors critically revised the paper and approved the submitted version of the manuscript.
Data availability
The manuscript represents valid work and neither this manuscript nor one with substantially similar content under the same authorship has been published or is being considered for publication elsewhere. Arturo Chiti had full access to all the data in the study and takes responsibility for the integrity of the data and the accuracy of the data analysis. Raw data are available on specific request to the corresponding author.
Compliance with ethical standards
Conflict of interest
Sollini, Ciccarelli, Morelli, Aghemo, and Gelardi had no conflicts of interest. Cecconi MC reports personal fees from Edwards Lifesciences, Directed Systems, and Cheetah Medical, outside the submitted work. Chiti received speaker honoraria from General Electric and Blue Earth Diagnostics, acted as scientific advisor for Blue Earth Diagnostics and Advanced Accelerator Applications, and benefited from an unconditional grant from Sanofi to Institution. All honoraria and grants are outside the scope of the submitted work.
Consent to participate and consent for publication
Written informed consent was obtained from patients for participation in the clinical study and data publication.
Ethical approval
The Ethics Committee of the Humanitas Clinical and Research Centre approved the study on June 12, 2020, with the authorization number 2587.
Footnotes
This article is part of the Topical Collection on Infection and inflammation.
Publisher’s note
Springer Nature remains neutral with regard to jurisdictional claims in published maps and institutional affiliations.
References
- 1.Pascarella G, Strumia A, Piliego C, Bruno F, Del Buono R, Costa F, et al. COVID-19 diagnosis and management: a comprehensive review. J Intern Med Wiley. 2020;288:192–206. doi: 10.1111/joim.13091. [DOI] [PMC free article] [PubMed] [Google Scholar]
- 2.Manson JJ, Crooks C, Naja M, Ledlie A, Goulden B, Liddle T, et al. COVID-19-associated hyperinflammation and escalation of patient care: a retrospective longitudinal cohort study. Lancet Rheumatol. 2020;2:594–602. doi: 10.1016/S2665-9913(20)30275-7. [DOI] [PMC free article] [PubMed] [Google Scholar]
- 3.Feldstein LR, Rose EB, Horwitz SM, Collins JP, Newhams MM, Son MBF, et al. Multisystem inflammatory syndrome in U.S. Children and adolescents. N Engl J Med. 2020;383:334–346. [DOI] [PMC free article] [PubMed]
- 4.Carfì A, Bernabei R, Landi F. Persistent Symptoms in Patients After Acute COVID-19. JAMA American Medical Association. 2020;324:603. doi: 10.1001/jama.2020.12603. [DOI] [PMC free article] [PubMed] [Google Scholar]
- 5.Jamar F, Buscombe J, Chiti A, Christian PE, Delbeke D, Donohoe KJ, et al. EANM/SNMMI guideline for 18F-FDG use in inflammation and infection. J Nucl Med. 2013;54:647–658. doi: 10.2967/jnumed.112.112524. [DOI] [PubMed] [Google Scholar]
- 6.Boellaard R, Delgado-Bolton R, Oyen WJG, Giammarile F, Tatsch K, Eschner W, et al. FDG PET/CT: EANM procedure guidelines for tumour imaging: version 2.0. Eur J Nucl Med Mol Imaging. 2014;42:328–354. doi: 10.1007/s00259-014-2961-x. [DOI] [PMC free article] [PubMed] [Google Scholar]
- 7.Slart RHJA. FDG-PET/CT(A) imaging in large vessel vasculitis and polymyalgia rheumatica: joint procedural recommendation of the EANM, SNMMI, and the PET Interest Group (PIG), and endorsed by the ASNC. Eur J Nucl Med Mol Imaging Springer. 2018;45:1250–1269. doi: 10.1007/s00259-018-3973-8. [DOI] [PMC free article] [PubMed] [Google Scholar]
- 8.Becker RC. COVID-19-associated vasculitis and vasculopathy. J Thromb Thrombolysis Springer. 2020;50:499–511. doi: 10.1007/s11239-020-02230-4. [DOI] [PMC free article] [PubMed] [Google Scholar]
- 9.Becker RC. COVID-19 update: Covid-19-associated coagulopathy. J Thromb Thrombolysis Nature Publishing Group. 2020;50:54–67. doi: 10.1007/s11239-020-02134-3. [DOI] [PMC free article] [PubMed] [Google Scholar]
- 10.Libby P, Lüscher T. COVID-19 is, in the end, an endothelial disease. Eur Heart J Eur Heart J. 2020;41:3038–3044. doi: 10.1093/eurheartj/ehaa623. [DOI] [PMC free article] [PubMed] [Google Scholar]
Associated Data
This section collects any data citations, data availability statements, or supplementary materials included in this article.
Data Availability Statement
The manuscript represents valid work and neither this manuscript nor one with substantially similar content under the same authorship has been published or is being considered for publication elsewhere. Arturo Chiti had full access to all the data in the study and takes responsibility for the integrity of the data and the accuracy of the data analysis. Raw data are available on specific request to the corresponding author.