
Figure 6.
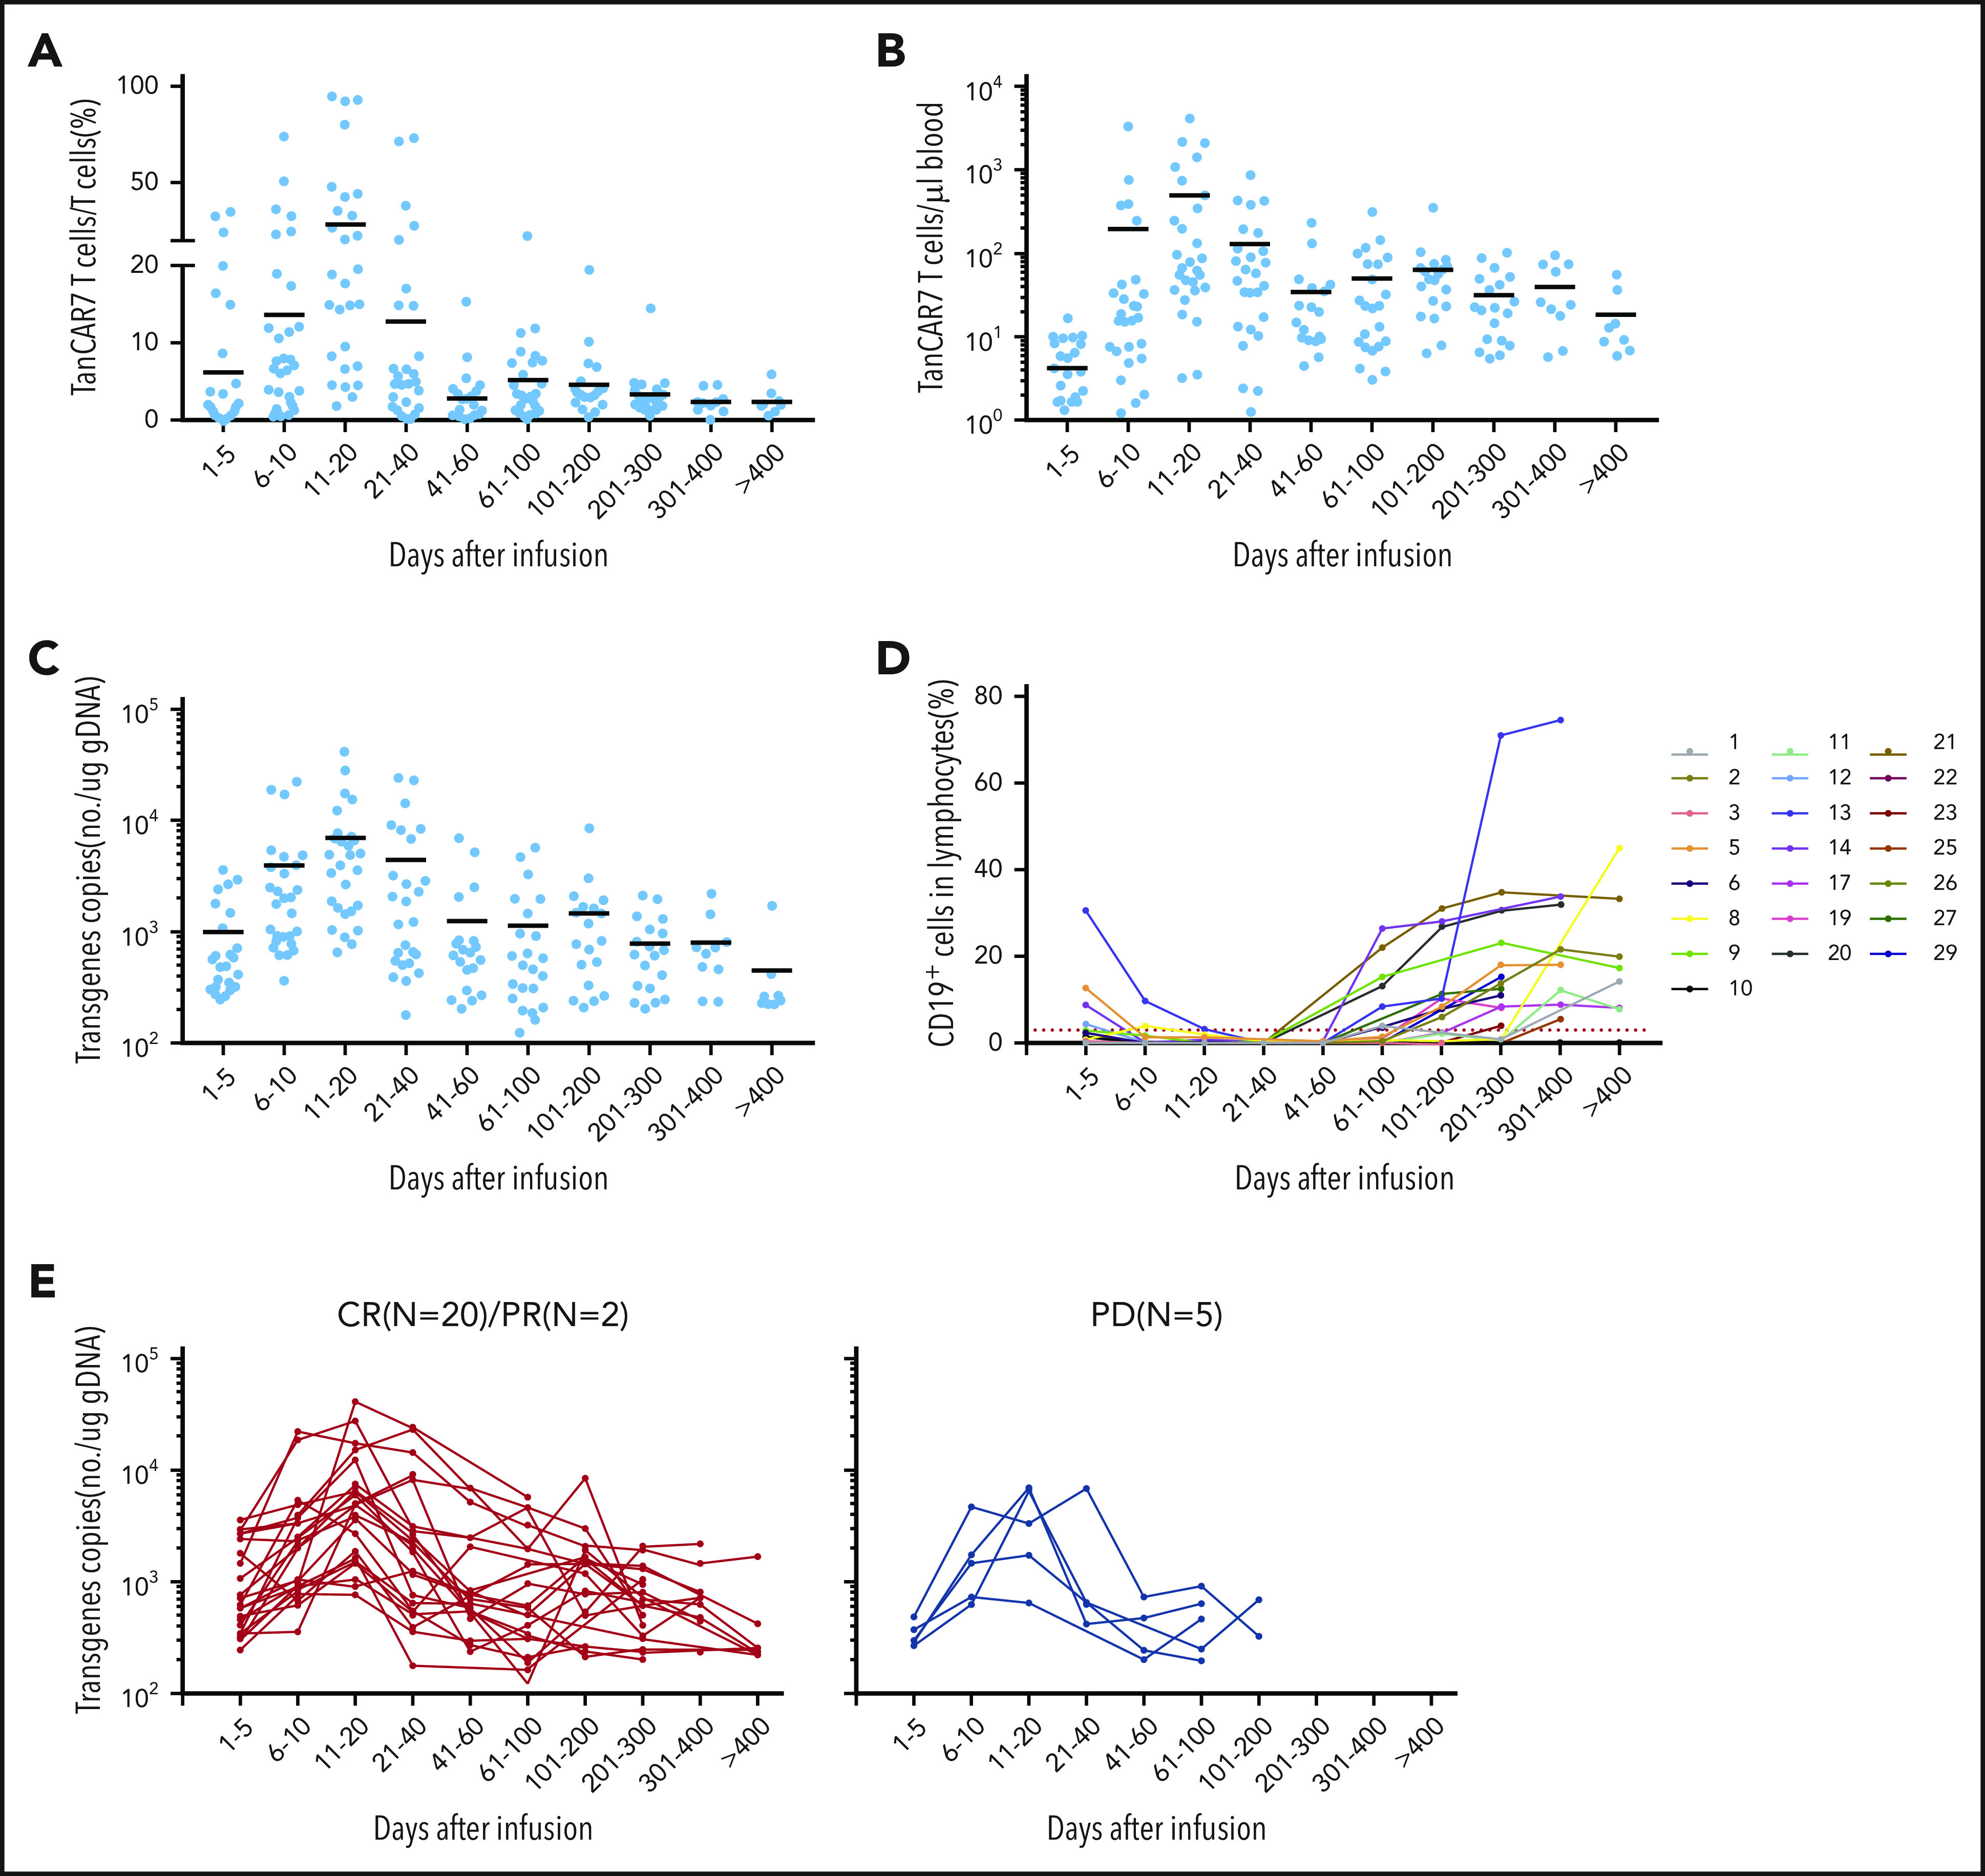
Expansion of peripheral blood CAR T cells and B-cell recovery. Percentage (A) and absolute number (B) of circulating TanCAR7 T cells, as determined by flow cytometry, and transgene copy number (C), as determined by qPCR. Horizontal solid lines show the mean at each time point. (D) Percentage of CD19+ cells in lymphocytes in blood. Red dotted line is 3%. (E) Individual concentration-time profiles in responding patients (left panel) and in nonresponding patients (right panel). gDNA, genomic DNA.