

Abstract
Cannabis is the most frequently used illicit psychoactive substance worldwide, and around on in ten users become dependent. The risk for cannabis use disorder (CUD) has a strong genetic component, with twin heritability estimates ranging from 51-70%. Here we performed a genome-wide association study (GWAS) of CUD in 2,387 cases and 48,985 controls, followed by replication in 5,501 cases and 301,041 controls. We report the first genome-wide significant risk locus for CUD (P=9.31X10⁻¹²) that replicates in an independent population (Preplication=3.27X10⁻³, Pmetaanalysis=9.09x10⁻¹²). The index variant (rs56372821) is a strong eQTL for CHRNA2 and analyses of the genetically regulated gene expression identified a significant association of CHRNA2 expression with CUD in brain tissue. At the polygenic level, analyses revealed a significant decrease in the risk of CUD with increased load of variants associated with cognitive performance. The results provide novel biological insights and inform on the genetic architecture of CUD.
Introduction
Cannabis use is increasing in the population1 and around 9% of users become dependent2. Genetic factors explain a large proportion of the risk for cannabis use disorder (CUD) with twin heritability estimates in the range of 513-70%4. The prevalence of diagnosed CUD in the population has been estimated to 1-1.5% among Europeans5 and Americans1. CUD is associated with a range of adverse health problems6 including risk of psychosis7, bipolar disorder8, anxiety disorder9 and cognitive impairment with more persistent use associated with greater decline10. Estimates of the heritability for cannabis use initiation and life-time cannabis use, with respect to the amount of variance explained by common variants (i.e. the single nucleotide polymorphism (SNP) heritability), has been estimated to 0.0611-0.212. Four GWASs related to cannabis use initiation or lifetime use have been conducted; three studies without genome-wide significant findings11-13 and a large GWAS meta-analysis of life-time cannabis use including 184,765 individuals, wich identified eight genome-wide significant independent risk loci14. Four GWASs of problematic use or diagnosed CUD have been conducted; two without genome-wide significant findings15,16 and two recent reporting genome-wide significant associations, albeit with negative or ambiguous replication results: a study of DSM-IV cannabis dependence criterion counts in a combined sample of 14,754 European Americans and African Americans17, which reported three genome-wide significant loci associated with cannabis use severity; and a GWAS of cannabis dependence of 2,080 European cases and 6,435 controls which identified one genome-wide significant locus18.
Here we present results from a GWAS and subsequent replication based on analyses of the largest cohorts of diagnosed CUD reported so far. Individuals included in the discovery GWAS come from the Danish nation-wide population based cohort collected by the Lundbeck Foundation Initiative for Integrative Psychiatric Research (iPSYCH). The iPSYCH cohort was ascertained to study six major psychiatric disorders (schizophrenia, bipolar disorder, major depressive disorder, attention-deficit hyperactivity disorder (ADHD), anorexia nervosa and autism spectrum disorder) and consists of 79,492 genotyped individuals. The present GWAS included 2,387 individuals with a diagnosis of CUD. In this study CUD was defined by individuals having an ICD10 diagnosis reflecting a problematic and persistent use of cannabis (ICD10 F12.1-12.9; see Supplementary Table 1, 2 and 3 for information on number of cases in each diagnostic subcategory and distribution over diagnostic subcategories in relation to comorbid psychiatric disorders) and 48,985 individuals not diagnosed with CUD, all from the iPSYCH cohort. We identify a genome-wide significant risk locus on chromosome 8, which replicates in an independt cohort from deCODE genetics. The index variant is a strong eQTL for CHRNA2, which encodes the neuronal acetylcholine receptor (nAChR) alpha-2 subunit, and in analyses of the genetically regulated gene expression we find reduced expression of CHRNA2 in brain tissue in individuals with CUD compared to the control group in cerebellum. At the polygenic level, we show that increased load of CUD variants associates with decreased cognitive performance and increased risk of schizophrenia and ADHD.
Results
GWAS of CUD and replication in an independt cohort from Iceland
Data analysis was conducted using the Ricopili pipeline19, including stringent quality control of genotyped variants and individuals (Methods). Information about non-genotyped markers was obtained by imputation using the 1000 genomes phase 3 as reference panel. GWAS was performed using imputed marker dosages and an additive logistic regression model using the following covariates: relevant principal components to correct for confounders such as population stratification, presence of the major psychiatric disorders studied in iPSYCH and genotyping wave. Only markers with an imputation INFO score >0.7, minor allele frequency (maf) >0.01 and bi-allelic variants were retained, in total 8,971,679 genetic variants were included. We identified 26 genome-wide significant variants (P<5x10⁻⁸), located in a single locus on chromosome 8 (Figure 1 and 2). The index variant, rs56372821, showed an odds ratio of 0.73 (P=9.31x10⁻¹²) with respect to the minor allele A (Table 1, Figure 1 and 2). We found no signs of contributions from confounding factors like population stratification and cryptic relatedness to the inflation in the distribution of the test statistics (lambda=1.033; see quantile-quantile plot, Figure 1.B.) using LD score regression, since the intercept was practically one (intercept=0.996; SE=0.0079) (Methods). There was no evidence of association of previously identified genome-wide significant cannabisuse risk variants with CUD in our analyses17,18 (Supplementary Table 5). This might be due to different phenotype definitions among the studies as Sherva et al.17 analysed association with cannabis use criterion counts, and Agrawal et al.18 used cannabis exposed (but not dependent) individuals as controls in their study. Additionally, the composition of the cohorts analysed also differ as the previous GWASs were based on cohorts established to study substance use disorders while the iPSYCH cohort was ascertained for major mental disorders.
Figure 1. Genome-wide association results from the CUD GWAS results.

A) Manhattan plot of the results from the GWAS of CUD (2,387 individuals with CUD and 48,985 controls). Results are from logistic regression and P-values are two-sided. The red horizontal line indicates the threshold for genome-wide significance (P=5x10⁻⁸). The index variant is highlighted as a green diamond and SNPs in high LD with the index SNP are marked in green. B) Quantile-quantile plot of the expected and observed P-values from GWAS of CUD (2,387 individuals with CUD and 48,985 controls). The blue line indicates the distribution under the null hypothesis and the shaded area indicates the 95% confidence band.
Figure 2. Association results for the geneomic region with the CUD risk locus.

Regional association plot of the local association results for the risk locus at chromosome 8 based analysis of 2,387 individuals with CUD and 48,985 controls. Results are from logistic regression and P-values are two-sided. The index variant (rs56372821) and additional three correlated genome-wide significant variants (LD with index variant: 0.2 < r2 < 0.7) are marked with letters (a-d), the triangle represents the two-sided P-value from meta-analysis (inverse variance weighted fixed effects model) with the replication cohort from deCODE (5,501 individuals with CUD and 301,041 controls). The location and orientation of the genes in the region and the local estimates of recombination rate is shown. The association P-value (p), odds ratio (or), minor allele frequency (maf) and imputation info-score (info) is presented in upper right corner. The horizontal green line represents the threshold for genome-wide significant (P=5x10⁻⁸).
Table 1. Genome-wide significant SNPs associated with CUD.
Results for variants passing the threshold for genome-wide significance (P=5x10⁻⁸) in the associated locus at chromosome 8 in the primary GWAS (2,387 individuals with CUD and 48,985 controls) and/or in the meta-analysis with results from an independent cohort collected by deCODE (5,501 cases with CUD and 301,041 controls). Results for the index SNP (Index SNP) is shown together with results from supporting correlated SNPs in the locus (0.2 < r2 < 0.7) (LD SNPs). Alleles for the variants (A1 and A2), frequency of A1 in controls (Frq A1 con), the odds ratio (OR) for the effect of A1, and P-values (P) are given. Two-sided P-values from logistic regression of the iPSYCH and deCODE cohorts and from inverse variance weighted fixed effects meta-analysis. Bolding of P values indicates genome-wide significance
| iPSYCH |
deCODE |
meta-analysis |
|||||||||||||||
|---|---|---|---|---|---|---|---|---|---|---|---|---|---|---|---|---|---|
| Index SNP | LD SNPs | CHR | BP (hg19) | A1 | A2 | Frq A1 con | OR | P | A1 | A2 | Frq A1 con | OR | P | A1 | A2 | OR | P |
| rs56372821 | 8 | 27436500 | A | G | 0.163 | 0.728 | 9.31x10⁻¹² | A | G | 0.144 | 0.878 | 3.27 x10−03 | A | G | 0.803 | 9.09 x10⁻¹² | |
| rs4732724 | 8 | 27423062 | C | G | 0.324 | 0.820 | 1.34 x10−08 | C | G | 0.367 | 0.905 | 1.60 x10−03 | C | G | 0.866 | 7.74 x10⁻¹⁰ | |
| rs6558008 | 8 | 27438306 | A | C | 0.755 | 1.237 | 2.54 x10−08 | C | A | 0.228 | 0.915 | 1.45 x10−02 | A | C | 1.159 | 1.97 x10−08 | |
| rs73229090 | 8 | 27442127 | A | C | 0.110 | 0.702 | 7.41 x10⁻¹⁰ | A | C | 0.105 | 0.881 | 1.30 x10−02 | A | C | 0.797 | 2.82 x10−09 | |
| rs937220 | 8 | 27429730 | A | G | 0.259 | 0.8258 | 2.46 x10−07 | A | G | 0.269 | 0.912 | 7.56 x10−03 | A | G | 0.871 | 4.53 x10−08 | |
| rs17466060 | 8 | 27422740 | A | G | 0.418 | 0.8594 | 3.94 x10−06 | A | G | 0.430 | 0.900 | 5.11 x10−04 | A | G | 0.881 | 1.29 x10−08 | |
The genome-wide significant locus on chromosome 8 was replicated in an independent Icelandic sample consisting of 5,501 cases with CUD and 301,041 population controls (deCODE cohort). The cases were diagnosed with CUD while undergoing inpatient treatment at the SSA National Center of Addiction Medicine, Vogur Hospital in Iceland (www.saa.is). SAA treats around ~80% of individuals with substance abuse in Iceland which makes the deCODE CUD cohort nearly population-wide20. We tested nine variants located in the risk locus in the Icelandic sample; the index variant and eight correlated variants (0.2< r2 <0.7) with P-values less than 1x10⁻⁶ (four genome-wide significant). All variants demonstrated consistent direction of association. The most strongly associated variant (rs56372821) in the discovery GWAS showed a P-value of 3.27x10⁻³ in the deCODE cohort , however with a slightly smaller effect size (Table 1). In the meta-analysis, rs56372821 showed a little stronger association with CUD (P=9.09x10⁻¹²), and additional two variants became genome-wide significant (Table 1).
We performed polygenic risk score (PRS) analysis in order to evaluate the consistency between the deCODE and the iPSYCH CUD phenotypes. When using the iPSYCH cohort as discovery, we observed a significant association of CUD PRS in the deCODE cohort with CUD (e.g P-value=2.17x10⁻⁹; P-value threshold <0.01 in the discovery GWAS) but not with schizophrenia or bipolar disorder (Supplementary Table 4), supporting that the associations in the iPSYCH cohort primarily are driven by CUD and not the comorbid psychiatric disorders.
To assess the proportion of phenotypic variance in the iPSYCH data explained by common variants we applied LD score regression and the GREML method implemented in GCTA, assuming a population prevalence of 1% for cannabis use disorder (Methods). Estimates of the liability-scale SNP heritability were h2snp=0.09 (SE=0.03) and h2snp=0.042 (SE=0.014; P=0.0012) using LD score regression and GCTA, respectively. This result suggest a smaller contribution from common variants than was previously found for cannabis use12. The estimate will probably increase with larger sample size as a result of a decrease in the size of the error terms of the SNP effect estimates21.
The role of the CUD risk locus in other psychiatric disorders
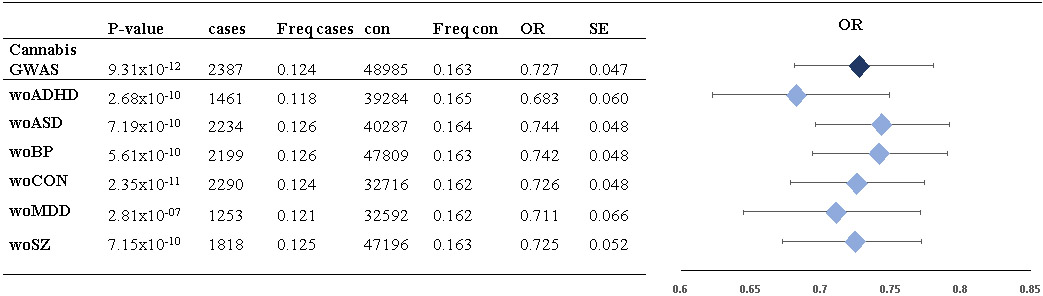
In the GWAS we corrected for diagnoses of the major psychiatric disorders studied in iPSYCH (see Supplementary Table 1 for distribution of psychiatric disorders among CUD cases and the control group). In addition, we evaluated the impact on the odds ratio for the index variant by leave-one-out analyses excluding psychiatric phenotypes one at a time in the association analysis (Methods). The odds ratio remained stable (Table 2), supporting that the association was independent of a diagnosis of the psychiatric disorders evaluated.
Table 2. The effect on the odds ratio of rs56372821 of leave-one-phenotype out association analyses.
In the analyses, individuals with a psychiatric diagnosis in the iPSYCH cohort were excluded, one disorder at a time, and an analysis without the controls was also conducted: without ADHD (woADHD), without autism spectrum disorder (woASD), without bipolar disorder (woBP), without the iPSYCH control cohort (woCON), without major depressive disorder (woMDD), without schizophrenia (woSZ). GWASs were done using logistic regression and P-values are two-sided. The P-value for association with CUD (P-value), number of cases (cases), frequency of the minor allele in cases (Freq cases), number of controls (con), frequency of the minor allele in controls (Freq con), odds ratio (OR) and standard error (SE), are given. For illustration OR and the corresponding standard error.
 |
The risk locus on chromosome 8 is also genome-wide significantly associated with schizophrenia19. In our leave-one-phenotype out analysis the locus remained genome-wide significant when individuals with schizophrenia were removed, excluding any potential confounding from schizophrenia (Table 2). Additionally, we tested the possibility of the locus being broadly associated with psychiatric disorders by performing a cross disorder GWAS including 35,006 individuals with one of the five major psychiatric disorders and 16,366 controls. In this analysis the index variant (rs56372821) showed a P-value of 0.058 (OR=0.966). When redoing the GWAS while excluding all individuals with CUD, the analysis revealed a cross-disorder P-value=0.33, OR=0.982 for rs56372821 (32,716 cases and 16,269 controls). The close to nominal significant signal observed in the cross-disorder GWAS including all cases disappeared when excluding individuals having a CUD diagnosis. This reinforces that the association signal in the CUD GWAS is caused by CUD, and not by a general association with psychiatric disorders.
The signal observed for the index variant in the GWAS meta-analysis of schizophrenia19 (rs73229090) is consistent with the direction of association observed in our analysis. Since individuals with schizophrenia often use cannabis (around 13-16%22) it could be speculated that the significant signal observed in schizophrenia is driven by a sub-group of schizophrenia cases also having CUD. This hypothesis is supported by analysis of the association of rs56372821 with schizophrenia in the iPSYCH sample. We found a nominal significant association of the variant with schizophrenia when including individulas with co-morbid CUD (2,281 schizophrenia cases and 23,134 controls; OR=0.9; P=0.036), while after exclusion of individuals with CUD (556 cases and 101 controls excluded) the association signal disappeared (1,727 cases, 23,033 controls; OR=0.97, P=0.63). To further to evaluate the impact of CUD comorbidity on the odds ratio of rs56372821 in schizophrenia a null distribution for the odds ratio was generated by performing 10,000 permutations randomly removing 556 and 101 individuals among the cases and controls, respectively (Supplementary Figure 1). The observed odds ratio for rs56372821, when excluding individuals with comorbid CUD was 0.97, and differed significantly from random removal of the same number of cases and controls (Ptwo-sided=0.0027, Pone-sided=0.0015). Thus the permutation test supports the hypothesis that the subgroup diagnosed with CUD among schizophrenia cases drives the nominal association observed for rs56372821 in the iPSYCH schizophrenia sample.
Association of risk locus witn age at first CUD diagnosis
We performed a case-only analysis testing all variants in LD with the index variant (19 SNPs; r2 >0.7) for association with age at first CUD diagnosis. This analysis suggested the risk alleles to be associated with earlier age at first diagnosis (most significant SNP: rs35236974, P=0.020). On average CUD cases homozygous for the protective allele got their diagnosis (mean age: 22.41; st.dev=3.63) one year later than CUD cases having at least one risk allele (mean age: 21.01; st.dev=3.56).
Transcriptome-wide association study implicates CHRNA2 in CUD
Among the brain tissues analysed in GTEx (https://gtexportal.org/home/) the index variant rs56372821 was found to be a strong eQTL for CHRNA2 in cerebellum (P-value in GTEx=2.1x10⁻⁷), with the risk allele (rs56372821-G) being associated with decreased expression of the gene (Supplementary Figure 2). CHRNA2 is expressed in the brain and encodes the neuronal acetylcholine receptor (nAChR) alpha-2 subunit, which is incorporated in heteropentameric neuronal nAChRs mainly with the beta-2 or beta-4 subunits23. Candidate gene studies of common variants have linked this gene to e.g. substance abuse24 and nicotine dependence25 but no genome-wide significant findings have connected CHRNA2 to any substance abuse or psychiatric disorder, besides a fuctional link between schizophrenia risk variants and CHRNA2 expression identified by Won et al26 (described below).
To further evaluate the potential regulatory impact of the identified locus on chromosome 8 as well as genome-wide gene expression differences between cases and controls, we imputed the genetically regulated gene expression in 11 brain tissues using PrediXcan (Methods). The SNP weights used were derived from models trained on reference transcriptome data sets including 10 brain tissues from GTEx and transcriptome data from dorsolateral prefrontal cortex generated by the CommonMind Consortium.. We tested for association of expression of 2,460-10,930 protein coding genes depending on the tissue (Supplementary Table 6) with CUD using logistic regression corrected by the same covariates as in the GWAS. One gene, CHRNA2, was significantly differently expressed between cases and controls (P=2.713x10⁻⁶; beta=−0.21; SE=0.045) in the cerebellum. The expression model for CHRNA2 in cerebellum was based on 47 SNPs including four genome-wide significant SNPs rs59724122, rs73229093, rs7838316 and rs11783093 (Figure 3). CHRNA2 expression was predicted with a valid model in two other brain tissues showing nominal significant under-expression in cases compared to controls (dorsolateral prefrontal cortex, P=5.19x10⁻⁴; cerebellar hemisphere P=5.30x10⁻³). That the risk locus for CUD can be linked to CHRNA2 expression is also supported by Won et al.26 who generated high-resolution 3D maps of chromatin contacts (by Hi-C sequencing approach) to capture functional relationships between regulatory and transcribed elements during human corticogenesis. They applied their map to a set of credible SNPs from the large PGC schizophrenia GWAS19 and found physical interaction of the genome-wide significant risk locus on chromosome 8 with the regulatory region of CHRNA2.
Figure 3. Association of CHRNA2 expression with CUD.

Association of the imputed genetically regulated expression of CHRNA2 with CUD in three brain tissues with a valid model (cerebellar hemisphere, dorsolateret prefrontal contex and cerebellum). The two-side P-value from logistic regression for the association of gene expression with CUD (−log10(PrediXcan:P-value) and two-side P-value from logistic regression from the CUD GWAS (−log10(GWAS:P-value)) is given on the y-axis, with a red dotted line indicating statistical significance. Both analyses include 2,387 individuals with CUD and 48,985 controls. Chromosome position is given on the x-axis and the light grey lines indicate which SNPs that are included in the models used to predict gene expression. The thin red lines indicate genetic predictors that are genome-wide significantly associated with CUD.
Examination of smoking behavior as a confounder
CHRNA2 is related to other nicotine receptor genes that have been identified as risk loci for nicotine dependence and smoking behavior27. It is therefore relevant to question if our finding is confounded by smoking. In the iPSYCH cohort there is no avaible information about smoking behavior. As much as 70-90% of cannabis users are reported also to smoke cigarettes28, which impose the risk of confounding. However, smoking is also highly comorbid with psychiatric disorders29, which is prevalent among the control group (66,79% were diagnosed with at least one of the major psychiatric disorders studied in iPSYCH; Supplementary Table 1). Since we expect smoking to be prevalent both among cases and the control group, it is unlikely that smoking alone would generate the high effect size we observe for the risk locus on chromosome 8. However, in the recent GWAS meta-analysis of smoking30 including more than 1.2 mill people the CUD risk locus is genome-wide significantly associated with smoking, with the CUD risk allele increasing risk for smoking initiation, younger age at smoking initiation and continuation of smoking, but it is associated with decreasing number of cigarettes per day (Supplementary Table 7). The strongest association is observed for smoking initiation with an effect size of OR=0.954 (rs11783093), which is significantly lower than the effect size observed for CUD in iPSYCH (OR=0.73 (rs56372821); P=7.964873x10−09; Z=5.767) and smaller than in deCODE (OR=0.88; P=0.061; Z=1.87). This suggests that the locus has a pleiotropic effect on the risk of both smoking and CUD in the general population, with greatest impact on CUD risk. In order to rule out that smoking behavior is not the main factor driving the association signal on chromosome 8 in the present study, we performed several additional analyses.
I) First the results from the CUD GWAS were adjusted by conditioning on the effects of a set of independent associated variants with smoking initiation30 using mtCOJO (Methods). The results, which are robust to confounding by shared genetic and environmental factors with smoking, supports that the CUD association is not strongly confounded by smoking (OR_corrected=0.759; P=4.44x10−09, Supplementary Table 8).
II) Furthermore, we evaluated by elementary simulation analysis how likely it would be to observe an odds ratio of 0.728 if the signal was primarily driven by tobacco smoking, by assuming a true odds ratio of smoking = 0.95430. We assigned plausible values for the prevelance of tobacco smoking among minor and major allele carriers of rs5637282 as well as CUD among tobacco users and non-users, and empirically approximated the probability of observing an odds ratio of 0.728. The largest P-value encountered was 8.69x10⁻³ (212 scenarios were tested), supporting that it is very unlikely that the OR we observe for CUD could be caused by tobacco smoking alone (Methods and Supplementary Table 9).
III) We performed a GWAS of CUD cases against schizophrenia cases in the iPSYCH cohort (2,387 CUD cases and 1,789 individuals with schizophrenia (ICD10 F20) without a CUD diagnosis). Smoking rates among schizophrenia cases is in the range of 60-90%31, so comparable with the rates among CUD cases. By comparing the two groups with comparable smoking rates we would expect the association signal to disappear if smoking is the driving factor. The index variant rs56372821 was associated with CUD with P=1.68x10⁻⁵, OR=0.76. The observed strong association with only a slight increase in OR from 0.73 in the original CUD GWAS to 0.76 supports that the signal is primarily driven by CUD and not confounded by tobacco smoking.
IV) Finally, no strong confounding of tobacco smoking at the polygenic level in the CUD GWAS was observed. This was evaluated using the iPSYCH CUD GWAS as training for generating CUD-PRS in deCODE. The score explained more of the variance and was associated with a higher effect size for CUD risk (R2=0.24%; OR=1.17) than was found for tobacco smoking (R2=0.10%, OR=1.07) (Supplementary Table 10).
In summary all four approaches support that the results reflect association with CUD without a strong confounding from smoking, both with respect to the identified CUD risk locus and at the polygenic level.
Genetic overlap with other phenotypes
To evaluate the genetic overlap between CUD and a range of other phenotypes at the polygenic level, we conducted analyses of PRS for 22 phenotypes related to cognition, personality, psychiatric disorders, reproduction and smoking behaviour (Methods; list of references to the GWASs of the 22 phenotypes and results can be found in Supplementary Table 11). PRS for eight phenotypes (three measures of cognitive perfomance, age at first birth, life time smoking, ADHD, depressive symptoms and schizophrenia) demonstrated strong association with CUD (4.33x10⁻⁴< P <7.44x10⁻¹⁵; Figure 4 and Supplementary Table 11). Strikingly, PRS for measures of educational attainment by the Social Science Genetic Association Consortium (SSGAC) (educational years: z-score=−7.78; P=7.44x10⁻¹⁵; college completion: z-score=−5.10; P=3.33x10⁻⁷), were strongly negatively associated with the risk of CUD, a finding which was reinforced by the significant negative association of PRS for human intelligence with CUD (z-score=−3.51; P=4.33x10⁻⁴). Our results suggest an overlap in genetic risk factors with a decrease in the odds ratio for CUD with increased number of educational years/cognitive performance (Supplementary Figure 3A-C.). The observed decreased risk of CUD with increased age at first birth (z-score=−7.41; P=1.26x10⁻¹³) is supporting the relationship with educational attainment as number of educational years is known to correlate genetically with later birth of the first child32. In order to avoid confounding in the PRS analyses of psychiatric disorders we excluded individuals among CUD cases and the control group with a diagnosis of the psychiatric disorder being analysed. PRS for ADHD (z-score=5.10; P=3.45x10⁻⁷), depressive symptoms (z-score=4.34; P=6.58x10⁻⁶) and schizophrenia (z-score=5.47; P=4.45x10⁻⁸) were all associated with an increased risk for CUD (Figure 4).
Figure 4. Association of PRS with CUD.

PRSs was generated for phenotypes related to cognition, personality, psychiatric disorders, reproduction and smoking behavior based on summary statistics from 22 published GWASs. The variance explained by the scores (Nagelkerke-R2) is given on the x-axis and the P-value from logistic regression for association of the PRS with CUD on the y-axis (based on analyses of 2,387 individuals with CUD and 48,985 controls). The vertical blue line indicate statistical significance (P=0.0023; correcting for 22 test). In PRS analyses of psychiatric disorders, individuals having a diagnosis of the respective psychiatric disorder being analysed (ADHD, schizophrenia, depressive symptoms and major depressive disorder) were excluded in the CUD target sample.
Discussion
This is the first study to report a genome-wide significant risk locus, for diagnosed CUD replicated in an independent cohort. The locus is located intergenic on chromosome 8 (index variant rs56372821) and has an odds ratio of 0.73, an effect size in line with findings for other complex disorders19,33. PRS supported a high consistency of the CUD phenotypes analysed in the discovery and replication cohorts from iPSYCH and deCODE, respectively, and supported that the GWAS results reflect association with CUD and not comorbid psychiatric disorders in the iPSYCH cohort. This also holds for the risk locus, where carefull dissection with respect to the distribution of effect sizes for the index variant (rs56372821) over co-morbid subgroups revealed no confounding from psychiatric disorders. This included exclusion of individuals with schizophrenia, which still revelaed genome-wide significant association of rs56372821 with CUD. This supports the proposed hypothesis that the genome-wide significant signal observed for the CUD risk locus in schizophrenia19 could be driven by a sub-group of schizophrenia cases having CUD.
Analysis of the imputed genetically regulated gene expression suggested CHRNA2 underexpression in cerebellum (and probably other brain regions), to be involved in CUD. Cerebellum may play a role in addiction with respect to reward and inhibitory control34, and reward-anticipating responses35. Cerebellum has high density of cannabinoid receptor 1 (CB1), which mediates the effect of delta9-tetrahydrohydrocannabinol (THC), the psychoactive compound in cannabis and has also been found to be affected by cannabis use in neuroanatomic studiese.g.36.
CHRNA2 encodes the neuronal acetylcholine receptor (nAChR) alpha-2 subunit, and there is no reported functional link between cannabis use and alpha-2 subunit containing nAChRs. We hypothesize three potential ways of the involvement of CHRNA2 in CUD: 1) Substances in cannabis might interact directly with the alpha-2 subunit containing nAChRs as studies have found cannabidiol, a non-psychoactive component of cannabis, to inhibit the alpha-7 containing nAChRs37. 2) Cannabis could indirectly affect the alpha-2 subunit containing nAChRs. After binding of an agonist (e.g. acetylcholine), the nAChR responds by opening of an ion-conducting channel across the plasma membrane. This causes depolarization of the membrane and can result in presynaptic neurotransmitter release including dopamine38. Since the psychoactive active compound of cannabis THC has been found to affect the release of acetylcholine in various brain regions39 it could be speculated that this, through alpha-2 subunit containing nAChRs, could affect dopamine release, a known neurotransmitter involved in addiction. 3) There could be a strong biological link between expression of CHRNA2 and the cannabinoid receptor 1 gene (CNR1). This hypothesis is based on evaluation of gene-expression correlations from genome-wide microarray gene expression profiles in the Allan Brain Atlas (http://www.brain-map.org/). We found that of all genes evaluated (58,692 probes analyzed), CNR1 demonstrated the strongest negative correlation with CHRNA2 expression (rmax=−0.498; Supplementary Figure 4). The signal was driven by opposite expression patterns in a large number of brain tissues, e.g in cerebellum where CNR1 had a relatively high expression in the cerebellar cortex and CHRNA2 had a relatively low expression and the opposite was observed for cerebellar nuclei (Supplementary Figure 4). This suggests the existence of a currently uncharacterized biological interaction between the endocannabinoid system and alpha-2 subunit containing nAChRs, by which the identified risk locus which is associated with decreased CHRNA2 expression could be related to increased CNR1 expression.
The observed association of CHRNA2 unerexpression with CUD, also implies that the alpha-2 subunit can be a potential drug target in the treatment of CUD, by the use of an agonist selective for alpha-2 subunit containing nAChRs. The impact of some compounds with an agonistic effect on the alpha-2 subunit containing nAChRs, like NS928340, ABT-41841 and TC-173442, have already been studied primarily due to their potential impact on memory and cognitive processese.g. 40,42.
Since CHRNA2 and other nicotine receptor genes that have been identified as risk loci for nicotine dependence and smoking behavior27,30, the potential confounding from smoking was evaluated carefully, and all our approaches supported that the results reflect CUD without strong confounding from smoking. Furthermore our results suggested that the identified CUD risk locus, which is also genome-wide significantly associated with smoking30 however with significant lower effect size than observed for CUD, has a pleiotropic effect on both smoking and CUD in the general population, with greatest impact on CUD risk. Additionally a recent GWAS of lung cancer identified a genome-wide significant locus just upstream CHRNA243. This locus is LD distinct from the locus identified in the present study, but the risk allele was also found to be associated with decreased CHRNA2 expression in cerebellum. In analyses of smoking behavior, the lung cancer risk allele, was reported nominally associated with smoking and age of initiation43. This result is in line with our observation of the CUD risk variant, and thus decreased CHRNA2 expression, being associated with younger age at first diagnosis of CUD.
Finally it should be mentioned that we cannot exclude other relevant genes in the region like EPHX2. This gene encodes soluble epoxide hydrolase involved in xenobiotic metabolism by degrading potentially toxic epoxides. While EPXH2 is not one of the main metabolizers of THC, some involvement is possible, as soluble epoxide hydrolase may act on at least some endocannabinoid metabolites and metabolites of Δ8-THC44.
At the polygenic level, increased load of variants associated with measures of decreased cognitive performance was associated with CUD. This suggests an underlying genetic component causing the observations of decreased educational performance being related to cannabis use in numerous epidemiological studiese.g.45. The direction of causation is unclear and it is unknown if the relationship is caused by cannabis use and subsequent disengagement from education or wether and to what extent the two share overlapping genetic factors46.
The overlap in common genetic risk factors for cannabis use disorder with depressive symptoms is in line with recent observations47 and the association of CUD with increased load of ADHD risk variants suggests that the epidemiological observations of high comorbidity of ADHD with CUD48 are influenced by shared genetic risk components. Likewise, the overlap in common genetic risk variants between CUD and schizophrenia (in line with epidemiological observations22,49 and PRS studies50). However we cannot rule out whether the overlap involves variants with pleiotropic effects, or if the overlap in general is caused by heterogeneity among schizophrenia cases due to a subgroup comorbid with CUD, in line with the CUD risk locus identified here.
In summary, we identified a genome-wide significant CUD locus, which replicated in an independent sample. An impact of the locus on earlier age of first diagnosis was further suggested. CHRNA2 was implicated in CUD through analyses of the imputed genetically regulated gene expression, showing decreased CHRNA2 expression in cerebellum (and other brain regions) of individuals with CUD. An intriguing result, which suggests further studies to evaluate if CHRNA2 could be a pontential therapeutic target for CUD treatment. The identified locus is located in a region previously associated with schizophrenia19, smoking30 and lung cancer43. Our GWAS result with respect to the identified risk locus did not seem to be confounded by either smoking or psychiatric disorders. Larger GWASs and functional studies are needed in order to further explain the biological mechanisms underlying the phenotypic associations observed for this region.
Methods
Samples
The individuals in this study is a part of the large Danish nation-wide population based sample collected by iPSYCH51. The iPSYCH sample was originally designed for studying major psychiatric disorders and includes genotypes from 79,492 individuals, including 54,249 cases diagnosed with at least one of six mental disorders (schizophrenia, bipolar disorder, major depressive disorder, ADHD, anorexia and autism spectrum disorder) and 25,243 individuals not having any of the six psychiatric disorders. The iPSYCH sample was selected from a birth cohort comprising individuals born in Denmark between May 1, 1981, and December 31, 2005, who were residents in Denmark on their first birthday and who have a known mother (N =1,472,762). The iPSYCH cases were identified based on information in the Danish Psychiatric Central Research Register52, and 30,000 randomly selected controls were identified from the same nationwide birth cohort in the Danish Civil Registration System53. Subseqeuntly blood spot samples (Guthrie cards) were identified in the in the Danish Newborn Screening Biobank (DNSB) from the included individuals54. Processing of DNA, genotyping and genotype calling as well as imputing of genotypes (see below) of the samples were done in 23 waves of approximately 3,500 individuals each.
Individuals with CUD were identified in the iPSYCH sample through information in the Danish Psychiatric Central Research Register52 as well as in the Danish National Patient Register55 using information up to 2013. All individuals with an ICD10 diagnosis of F12.1-12.9, were included (Supplementary Table 1 and 2). Individuals with acute intoxication (diagnosis code F12.0) were not included among cases (41 individuals had an F12.0 diagnosis; 0.084% of the controls). The F12.0 diagnosis is related to the acute pharmacological effects of cannabis use and resolve with time, and does not necessary reflect long term problematic cannabis use, which is the focus of this study. All individuals in the iPSYCH sample not having a diagnosis of CUD were used as controls and covariates for the major psychiatric disorders studied by iPSYCH were used in the analyses in order to correct for the presence of mental disorders. Only 54 individuals had a diagnosis of CUD and anorexia, and all individuals having a diagnosis of anorexia among cases and the control group were excluded. After QC the study included 2,387 cases and 48,985 in the control group. Supplementary Table 1 gives an overview of the distribution of individuals with a psychiatric disorder among the CUD cases and the control group. None of the comorbid psychiatric disorders deviated with respect to the distribution of individuals over CUD diagnosis sub-categories (Supplementary Table 3).
Processing of samples, genotyping, QC and imputing was done in 23 waves. In this study individuals from the first four waves were excluded as only a few cannabis use disorder cases were present in these waves (range 0-15 cases). The waves represent approximate birth years and the four waves that were excluded represent to a large extend individuals, which in 2013 (the time of extraction of register diagnoses) were children. Mean age of cases is 24,77 years (standard deviation =5.32) and mean age of controls is 22,67 years (standard deviation =3.86). The control group is younger and the age span wider than for the cases. The presence of younger individuals among the controls could reduce power since some controls eventually will become cases, and it also reduces the risk of discovering a false positive association.
The study was approved by the Danish Data Protection Agency and the Scientific Ethics Committee in Denmark.
Statistical analyses
Genotyping, quality control and GWAS
DNA was extracted from dried blood spot samples and whole genome amplified in triplicates as described previously56,57. Genotyping was performed at the Broad Institute of Harvard and MIT (Cambridge, MA, USA) using Illumina’s Beadarrays (PsychChip; Illumina, CA, San Diego, USA) according to the manufacturer’s protocols. Genotypes were a result of merging call sets from three different calling algorithms (GenCall, Birdseed and Zcall). GenCall58 and Birdseed59 were used to call genotypes with minor allele frequency (maf) > 0.01 and zCall60 was used to call genotypes with maf <0.01. The merging was done after pre-QC on individual call sets.
Stringent quality control was applied and only samples with individual call rate (> 0.98) and genotypes with high call rate (>0.98), no strong deviation from Hardy-Weinberg equilibrium (P >1x10⁻⁶ in controls or P >1x10⁻¹⁰ in cases) and low heterozygosity rates (∣ Fhet ∣ <0.2) were included. Genotypes were phased and imputed using the 1000 Genomes Project phase 3 (1KGP3)61,62 imputation reference panel and SHAPEIT63 and IMPUTE264. Relatedness and population stratification were evaluated using a set of high quality markers (genotyped autosomal markers with minor allele frequency (maf) >0.05, HWE P >1x10⁻⁴ and SNP call rate >0.98), which were pruned for linkage disequilibrium (LD) (r2 <0.075) resulting in a set of 37,425 pruned markers (markers located in long-range LD regions defined by Price et al.65 were excluded). Genetic relatedness was estimated using PLINK v1.966,67 to identify first and second-degree relatives ( >0.2) and one individual was excluded from each related pair (cases preferred kept over controls). Genetic outliers were identified for exclusion based on principal component analysis (PCA) using EIGENSOFT68,69. A genetic homogenous sample was defined based on a subsample of individuals being Danes for three generations (identified based on register information about birth country of the individuals, their parents and grandparents). The subsample of Danes was used to define the center based on the mean values of principal component (PC) 1 and PC2. Subsequently PC1 and PC2 were used to define a genetic homogenous population by excluding individuals outside an ellipsoid with axes greater than six standard deviations from the mean. After outlier exclusion PCA was redone and PCs from this analysis were included in the association analysis (see below).
Association analysis was done using logistic regression and the imputed marker dosages. The following covariates were used: principal component 1-4 and principal components from the PCA associated with case-control status, the 19 data-processing waves and diagnosis of major psychiatric disorders studied by iPSYCH (Supplementary Table 1). Results for 9,729,295 markers were generated, subsequently markers with imputation info score <0.7 (n=608.367), markers with maf <0.01 (n=10.220) and multi-allelic markers (n=143,083) were removed. In total after filtering 8,969,939 markers remained for further analysis. All analyses of the iPSYCH sample were performed at the secured national GenomeDK high performance-computing cluster in Denmark (https://genome.au.dk).
We evaluated the impact of age on the main identified risk locus on chromosome 8. We corrected for age using age coded as a binary variable with the mean age of cases (24,77 years (standard deviation =5.32)) as a guideline for the cut-off, grouping all individuals with age < 25 into one group (1,164 cases; 29,818 controls) and age >24 into another group (1,223 cases; 19,167controls). Due to the low age-span among cases it did not make sense biologically to divide the cases into smaller age-bins. Correcting for age did not have an impact on the strong association of the risk locus on chromosome 8 (rs5637282; P=1.082x10⁻¹¹).
Replication
The genome-wide significant locus on chromosome 8 was replicated in an independent European cohort consisting of 5,501 cases with diagnosed CUD and 301,041 population controls collected by deCODE genetics. The characteristics of the SAA treatment sample have been described previously20 and currently diagnoses at Vogur Hospital are made using DSM-V, but most of the diagnoses in this study are based on DSM-IV or DSM-IIIR. The genotypes were obtained based on SNP array data and whole genome sequences using long range phasing and two types of imputations70. For the replication study, markers were looked up in the results of a GWAS performed by logistic regression treating disease status as the response and genotype counts as covariates. Other available individual characteristics that correlate with disease status were also included in the model as nuisance variables, using previously described methods71. The resulting P-values were corrected for inflation by the method of genomic controls (correction factor=1.42). Nine genetic variants all representing the same association signal on chromosome 8 with P-values less than 1x10⁻⁶ were looked up in the deCODE results. The variants in the locus were selected based on LD (0.2 < r2 < 0.7). We included additional markers besides the index SNP in order to be able to evaluate the consistency of direction of association in the replication cohort over a set of variants located in the associated risk locus. The data were meta-analyzed using summary statistics and inverse variance weighted fixed effects model, implemented in the software METAL72. All tested variants demonstrated consistent direction of association in the replication cohort.
CUD PRS analysis in deCODE
A PRS was computed from the iPSYCH CUD GWAS summary data using the LD-pred method73. Only markers with a single rs-name from the GWAS were used. Associations between the PRS and CUD (2,257 cases and 145,069 controls), schizophrenia (729 cases and 153,007 controls), bipolar disorder (1,751 cases and 151,923 controls) and smoking (46,941 individuals reporting being a regular smoker in their life and 20,602 controls that has never been regular smokers) was computed using linear regression. Covariates were sex, age and the first 10 principal components. Association P-values were corrected for inflation using LD-score regression.
Heritability
SNP heritability (h2SNP) was estimated by LD score regression74 using summary statistics from the GWAS of CUD and pre-computed LD scores (available on https://github.com/bulik/ldsc). The SNP heritability was calculated on the liability scale using a prevalence of CUD of 1% in the population. The h2SNP estimated by LD score regression was inaccurate as the ratio between the estimated h2SNP and the standard error was less than four (h2SNP/SE=2,86). Therefore, the h2SNP was also estimated using GCTA75. A genomic relationship matrix (GRM) between all pairwise combinations of individuals was estimated for each autosome separately and subsequently merged using the GCTA software. The strict best-guess-genotypes (i.e. 4,299,887 SNPs with info score >0.8, missing rate <0.01 and MAF >0.01) from imputation with phase 3 of 1000 genomes were used for GRM estimation. Univariate GREML analyses in GCTA was used to estimate h2SNP on the liability scale, using the combined GRM and the same covariates as in the GWAS.
Leave-one phenotype out GWAS
In the GWAS of CUD we corrected, by covariates, for five major psychiatric disorders analysed in iPSYCH (Supplementary Table 1). However, in order to further evaluate the potential impact on the association signal of the index variant from the psychiatric phenotypes, sensitivity analyses were performed where one phenotype at a time was excluded from the association analysis. The phenotypes evaluated were schizophrenia, bipolar disorder, major depressive disorder, attention-deficit hyper activity disorder, autism and individuals not having any of the five diagnoses. GWASs were performed as previously described excluding one of the six phenotypes one at a time (sample size for number of cases and controls is shown in Supplementary Table 1).
Cross disorder GWAS for evaluation of the general association of rs56372821 with psychiatric disorders
In order to investigate the possibility of the risk locus at chromosome 8, being a general risk locus for psychiatric disorders we conducted a cross-disorder GWAS based on the same individuals as included in the CUD GWAS. All individuals with a diagnosis of schizophrenia (ICD10 code F20), bipolar disorder (ICD10 codes F30-F31), attention-deficit hyperactivity disorder (ICD10 code F90.0), autism spectrum disorder (ICD10 codes F84.0, F84.1, F84.5, F84.8, F84.9) and major depressive disorder (ICD10 codes F32-F33) were used as cases, in total 35,006 individuals and 16,366 individuals without any of the listed psychiatric disorders were used as controls. The GWAS was conducted using wave as covariates and PCs from PCA (generated as described for the CUD GWAS).
We re-did the cross-disorder GWAS excluding all individuals with a CUD diagnosis (removing 2,290 individuals from the case group and 97 individuals from the control group), reducing the sample size to 32,716 cases and 16,269 controls. The GWAS was conducted using the PCs from PCA and wave as covariates.
Permutation based evaluation of the odds ratio of rs56372821 for schizophrenia with and without CUD
We applied a permutation based approach in order to evaluate how the inclusion and exclusion of individuals with CUD affected the association of our index variant rs56372821 with schizophrenia. The analyses were based on the iPSYCH sample consisting of 2,281 schizophrenia cases and 23,134 population based controls (genotyping, QC and imputation were done using the same procedures as explained above). Odds ratios were obtained by the glm() function in R using dosage data from the imputed SNP rs56372821, and including principle components PC1-PC4 and PCs signicantly associated with SZ and/or CUD and genotyping wave as covariates.
In the association analysis of schizophrenia the odds ratio of 56372821(CI95%) was OR=0.9 (0.81-0.99). When excluding all individuals with CUD, among cases and controls (1,727 cases and 23,033 controls) the odds ratio of rs56372821(CI95%) was OR=0.97 (0.87-1.09). To evaluate whether this change in the odds ratio is due to removal of individuals with CUD (554 cases and 101 control with CUD removed) or due to reduction in sample size, a null distribution of OR's was generated by randomly removing 554 individuals among schizophrenia cases and 101 individuals among controls (removing a total of 655 individuals). This permutation of sample exlcusion was done 9,999 times to generate the null distribution of the odds ratio for rs56372821. To obtain a two-sided P-value, the observed ln(ORrs56372821)=−0.03 was mirrored around the mean ln(ORrs56372821) of the null distribution, as shown in Supplementary Figure 1. Removal of individuals with CUD (554 SZ cases and 101 controls) changed the OR of rs56372821 significantly, compared to random removal of the same number of schizophrina cases and controls (Ptwo-sided=0.0027), producing a significant increase of ORrs56372821 compared to random removal (Pone-sided=0.0015).
mtCOJO conditioning for the effect of smoking
The analysis was performed using summary statistics from the CUD GWAS and summary statistics from GWAS of smoking intiation30 (excluding 23andMe data, 547,219 individuals, 11,733,344 variants).The conditional analysis was run using mtCOJO46 (implemented in GCTA75) using standard procedures. Variants selected for conditioning were genome-wide significant in the smoking GWAS (P < 5x10⁻⁸) and not in linkage disequilibrium (r2< 0.05) with a variant with a lower P-value (61 variants). One variant was removed due to evidence of pleiotropy (HEIDI-outlier threshold of P= 0.01).
Simulations analysis to evaluate confounding by tobacco smoking
A simulation analysis was conducted to evaluate how likely it is to observe an odds ratio of 0.728 if the association signal primarily is driven by smoking by assuming a true odds ratio of smoking = 0.95430.
We divided individuals into six strata by assigning them a unique phenotype using the hierarchy: 1) schizophrenia (SZ), 2) bipolar disorder (BP), 3) autism spectrum disorder (ASD), 4) attention deficit hyperactivity disorder (ADHD), 5) major depressive disorder (MDD) and 6) controls (ICON). We assumed a dominant model, where homozygous and heterozygous carriers of the minor allele of rs56372821 were treated equally. See Supplementary Table 9 for distribution of individuals having the major allele or at least one minor allele among the strata.
The null hypothesis was that rs56372821 only affects CUD via its effect on tobacco smoking, which has an odds ratio 0.954 (TOR)30. We assumed a prevalence of CUD among tobacco users of 0.045 (CT)76 and a CUD prevalence among tobacco non-users of 0.01 (Ct)5, independently of the six groups. Given the prevalence of tobacco smoking (PRE) among one of the six groups, we could calculate the probability of tobacco smoking for minor allele carriers (Tm) and for major allele carriers (TM) among the groups, using the formulae of total probability PRE = MAF Tm + (1 - MAF)TM and odds ratio TOR = (Tm(1 - TM))/(TM(1 - Tm)). Then we simply simulated first the tobacco use status of each individual using the probabilities Tm and TM, and further the CUD status using the probabilities CT and Ct, and computed the simulated common Cochran-Mantel-Haenszel odds ratio for CUD. We did not require the total number of simulated CUD cases per stratum to match the observed numbers, because we wanted to keep this approach as elementary as possible. We repeated the simulation 100,000 times and compared the results with the observed odds ratio 0.728 for CUD, obtaining an estimator of the P-value for the null hypothesis with variance less than 1/(4x100000) = 0.0000025. This was repeated for various estimates of PRE among the six groups: a total of 212 combinations from the six sets PRESZ ∈ {0.6, 0.7, 0.8, 0.9}, PREBP ∈ {0.3, 0.4, 0.5, 0.6}, PREASD ∈ {0.05, 0.1, 0.15, 0.2}, PREADHD ∈ {0.1, 0.2, 0.3, 0.4}, PREMDD ∈ {0.2, 0.3, 0.4, 0.5} and PREICON ∈ {0.1, 0.15, 0.2, 0.25}. The largest P-value encountered was 8.69x10⁻³, making the the null hypothesis very unlikely.
The simulation was also repeated including information about stratification of the six phenotypes (described above) over genotyping waves. The genotyping wave was assumed to have no effect on the various probability parameters of the simulation and this time simulations were repeated only 10,000 times. The largest P-value encountered was 4.0x10⁻⁴ and the variance of this estimator is less than 1/(4x10000) = 0.000025, thus rejecting the null hypothesis.
GWAS of CUD cases against schizophrenia cases
This GWAS was based on individuals in the iPSYCH cohort and compared 2,387 CUD cases (ICD10 F12.1-F12.9) against 1,789 individuals diagnosed with schizophrenia (ICD10 F20) without a CUD diagnosis. QC procedures with respect to individual and genotyping QC were the same as described of the CUD GWAS, and association was calculated using logistic regression, corrected for genotyping wave and PCs from PCA.
Association with age at first diagnosis
In order to test for a potential impact of the risk locus on age at first diagnosis, a case only study was performed testing for association of the index variant (rs56372821) and variants in LD with this (r2 > 0.7; 19 variants) with age at first diagnosis. Date of diagnosis was identified from register information in the Danish Psychiatric Central Research Register52. Analysis for association with age at first diagnosis (natural logarithm (age at first diagnosis)) was done using linear regression and the same covariates as used in the GWAS (PCs, wave and the psychiatric disorders). A dominant model with respect to the risk allele, was applied.
Analysis of the imputed genetically regulated gene expression
The genetically regulated gene expression was imputed in 11 brain tissues using PrediXcan77 (models downloaded from: https://github.com/hakyimlab/PrediXcan; version 6 data). PrediXcan was used to impute the transcriptome for cases and the control group using SNP weights derived from models trained on reference transcriptome data sets including 10 brain tissues from GTEx78 (https://www.gtexportal.org/home/) and transcriptome data from dorsolateral prefrontal cortex generated by the CommonMind Consortium79,80. The models were trained on 1000 genome SNPs and contained only gene expression prediction models with a false discovery rate less than 5%. Gene expression levels in the iPSYCH data were imputed wave-wise and subseqeuntly the imputed data were merged. We tested for association of 2,459 – 10,930 protein coding genes (depending on the tissue; see Supplementary Table 6) with CUD using logistic regression. The analysis was based on the same individuals which were included in the GWAS (thus, genetic outliers and related individuals were removed) and corrected using genotyping wave and psychiatric disorders as covariates as well as the same principal components from PCA which were used in the GWAS . Since gene expression among the different brain tissues is highly correlated, we corrected the P-value for each gene by the total number genes tested in all tissues with a valid model available for the gene, with respect to CHRNA2 we corrected for 13,166 genes tested in three tissues, thus P-values < 3.8x10⁻⁶ (0.05/13,166) were considered statistical significant for this gene. This is in line with recent approaches used to correct for multiple testing in transcriptome wide association studies using imputed gene expression81.
Polygenic risk score analyses
PRS analyses were done using GWAS summary statistics from 22 GWASs (Supplementary Table 11). The summary files were downloaded from public databases and processed using the munge script which is a part of the LDscore regression software74. All variants with INFO < 0.9, MAF < 0.01, missing values, out of bounds P-values, ambiguous strand alleles and duplicated rs-ids were removed using the munge script. In addition, mult-allelic variants and insertion and deletion (indels) were removed. The processed summary files were then LD-clumped using Plink, with the following parameter settings: --clump-p1 1 --clump-p2 1 --clump-r2 0.1 --clump-kb 500. The clumped file were used as the training dataset. Genetic risk scores were estimated at different P-value thresholds for SNP inclusion: 5x10⁻⁸, 1x10⁻⁶, 1x10⁻⁴, 1x10⁻³, 0.01, 0.05, 0.1, 0.2, 0.5 and 1.0 for all individuals in the target sample (CUD cases and the control group) from the genotype dosages using Plink’s ‘--score’ method, with default arguments. However the PRS scores for ADHD, were generated using the approach described Demontis et al.33. For each P-value threshold the variance in the phenotype explained by PRS was estimated using Nagelkerke’s R (R package ‘BaylorEdPsych’), and association of PRS with CUD was estimated using logistic regression including the same covariates used in the GWAS analysis (PCs from PCA and the psychiatric disorders listed in Supplementary Table 1). In PRS analyses of psychiatric disorders (ADHD, schizophrenia and depression related phenotypes) individuals with a diagnosis of the disorder being analysed were excluded. The number of individuals excluded with ADHD, schizophrenia and major depressive disorder are listed in Supplementary Table 1.
Reporting Summary.
Further information on research design is available in the Life Sciences Reporting Summary linked to this article.
Supplementary Material
Acknowledgements
The iPSYCH project is funded by the Lundbeck Foundation (grant numbers R102-A9118 and R155-2014-1724) and the universities and university hospitals of Aarhus and Copenhagen. Genotyping of iPSYCH samples was supported by grants from the Lundbeck Foundation, the Stanley Foundation, the Simons Foundation (SFARI 311789 to MJD), and NIMH (5U01MH094432-02 to MJD). The study was supported EC’s Horizon 2020 Programme grant 667302 (CoCA) to ADB. The Danish National Biobank resource was supported by the Novo Nordisk Foundation. Data handling and analysis on the GenomeDK HPC facility was supported by NIMH (1U01MH109514-01 to M. O’Donovan and A Børglum). High-performance computer capacity for handling and statistical analysis of iPSYCH data on the GenomeDK HPC facility was provided by the Centre for Integrative Sequencing, iSEQ, Aarhus University, Denmark (grant to A Børglum). Work at deCODE was supported in part by the National Institute of Health (R01DA034076).
We gratefully acknowledge all the studies and databases that made GWAS summary data available: GPC (Genetics of Personality Consortium), PGC (Psychiatric Genomics Consortium), SSGAC (Social Science Genetics Association Consortium), TAG (Tobacco and Genetics Consortium), UK Biobank, CTGLAB (Complex Traits Genetics Lab).
We gratefully acknowledge the data made available by the the Genotype-Tissue Expression (GTEx) Project (supported by the Common Fund of the Office of the Director of the National Institutes of Health, and by NCI, NHGRI, NHLBI, NIDA, NIMH, and NINDS). The data used for the analyses described in this manuscript were obtained from: https://www.gtexportal.org/home/ on 01/11/2017.
Footnotes
Competing Interests Statement
T. Werge has been a lecturer and advisor to H. Lundbeck A/S.
T. E. Thorgeirsson, D. F. Gudbjartsson, G. W. Reginsson, H. Stefansson and K. Stefansson are employees of deCODE genetics/Amgen.
Data availability
Summary statistics with the results from the CUD GWAS is available on the iPSYCH website (https://ipsych.au.dk/downloads/). For access to genotypes from the the iPSYCH cohort, interested researchers should contact A.D. Børglum.
References
- 1.Compton WM, Han B, Jones CM, Blanco C & Hughes A Marijuana use and use disorders in adults in the USA, 2002-14: analysis of annual cross-sectional surveys. Lancet Psychiatry 3, 954–964, doi: 10.1016/S2215-0366(16)30208-5 (2016). [DOI] [PubMed] [Google Scholar]
- 2.Lopez-Quintero C et al. Probability and predictors of transition from first use to dependence on nicotine, alcohol, cannabis, and cocaine: results of the National Epidemiologic Survey on Alcohol and Related Conditions (NESARC). Drug and alcohol dependence 115, 120–130, doi: 10.1016/j.drugalcdep.2010.11.004 (2011). [DOI] [PMC free article] [PubMed] [Google Scholar]
- 3.Verweij KJ et al. Genetic and environmental influences on cannabis use initiation and problematic use: a meta-analysis of twin studies. Addiction 105, 417–430, doi: 10.1111/j.1360-0443.2009.02831.x (2010). [DOI] [PMC free article] [PubMed] [Google Scholar]
- 4.Kendler KS et al. A population-based Swedish Twin and Sibling Study of cannabis, stimulant and sedative abuse in men. Drug and alcohol dependence 149, 49–54, doi: 10.1016/j.drugalcdep.2015.01.016 (2015). [DOI] [PMC free article] [PubMed] [Google Scholar]
- 5.European Monitoring Centre for Drugs and Drug Addiction. Treatment of cannabis-related disorders in Europe. (2015). [Google Scholar]
- 6.Arria AM, Caldeira KM, Bugbee BA, Vincent KB & O'Grady KE Marijuana use trajectories during college predict health outcomes nine years post-matriculation. Drug and alcohol dependence 159, 158–165, doi: 10.1016/j.drugalcdep.2015.12.009 (2016). [DOI] [PMC free article] [PubMed] [Google Scholar]
- 7.Marconi A, Di Forti M, Lewis CM, Murray RM & Vassos E Meta-analysis of the Association Between the Level of Cannabis Use and Risk of Psychosis. Schizophr Bull 42, 1262–1269, doi: 10.1093/schbul/sbw003 (2016). [DOI] [PMC free article] [PubMed] [Google Scholar]
- 8.Cougle JR, Hakes JK, Macatee RJ, Chavarria J & Zvolensky MJ Quality of life and risk of psychiatric disorders among regular users of alcohol, nicotine, and cannabis: An analysis of the National Epidemiological Survey on Alcohol and Related Conditions (NESARC). J Psychiatr Res 66-67, 135–141, doi: 10.1016/j.jpsychires.2015.05.004 (2015). [DOI] [PubMed] [Google Scholar]
- 9.Kedzior KK & Laeber LT A positive association between anxiety disorders and cannabis use or cannabis use disorders in the general population--a meta-analysis of 31 studies. BMC psychiatry 14, 136, doi: 10.1186/1471-244X-14-136 (2014). [DOI] [PMC free article] [PubMed] [Google Scholar]
- 10.Meier MH et al. Persistent cannabis users show neuropsychological decline from childhood to midlife. Proceedings of the National Academy of Sciences of the United States of America 109, E2657–2664, doi: 10.1073/pnas.1206820109 (2012). [DOI] [PMC free article] [PubMed] [Google Scholar]
- 11.Verweij KJ et al. The genetic aetiology of cannabis use initiation: a meta-analysis of genome-wide association studies and a SNP-based heritability estimation. Addict Biol 18, 846–850, doi: 10.1111/j.1369-1600.2012.00478.x (2013). [DOI] [PMC free article] [PubMed] [Google Scholar]
- 12.Stringer S et al. Genome-wide association study of lifetime cannabis use based on a large meta-analytic sample of 32 330 subjects from the International Cannabis Consortium. Transl Psychiatry 6, e769, doi: 10.1038/tp.2016.36 (2016). [DOI] [PMC free article] [PubMed] [Google Scholar]
- 13.Minica CC et al. Heritability, SNP- and Gene-Based Analyses of Cannabis Use Initiation and Age at Onset. Behav Genet 45, 503–513, doi: 10.1007/s10519-015-9723-9 (2015). [DOI] [PMC free article] [PubMed] [Google Scholar]
- 14.Pasman JA et al. GWAS of lifetime cannabis use reveals new risk loci, genetic overlap with psychiatric traits, and a causal influence of schizophrenia. Nature neuroscience 21, 1161–1170, doi: 10.1038/s41593-018-0206-1 (2018). [DOI] [PMC free article] [PubMed] [Google Scholar]
- 15.Agrawal A et al. A genome-wide association study of DSM-IV cannabis dependence. Addict Biol 16, 514–518, doi: 10.1111/j.1369-1600.2010.00255.x (2011). [DOI] [PMC free article] [PubMed] [Google Scholar]
- 16.Agrawal A et al. DSM-5 cannabis use disorder: a phenotypic and genomic perspective. Drug and alcohol dependence 134, 362–369, doi: 10.1016/j.drugalcdep.2013.11.008 (2014). [DOI] [PMC free article] [PubMed] [Google Scholar]
- 17.Sherva R et al. Genome-wide Association Study of Cannabis Dependence Severity, Novel Risk Variants, and Shared Genetic Risks. JAMA Psychiatry 73, 472–480, doi: 10.1001/jamapsychiatry.2016.0036 (2016). [DOI] [PMC free article] [PubMed] [Google Scholar]
- 18.Agrawal A et al. Genome-wide association study identifies a novel locus for cannabis dependence. Molecular psychiatry, doi: 10.1038/mp.2017.200 (2017). [DOI] [PMC free article] [PubMed] [Google Scholar]
- 19.Schizophrenia Working Group of the Psychiatric Genomics Consortium. Biological insights from 108 schizophrenia-associated genetic loci. Nature 511, 421–427, doi: 10.1038/nature13595 (2014). [DOI] [PMC free article] [PubMed] [Google Scholar]
- 20.Tyrfingsson T et al. Addictions and their familiality in Iceland. Ann N Y Acad Sci 1187, 208–217, doi: 10.1111/j.1749-6632.2009.05151.x (2010). [DOI] [PubMed] [Google Scholar]
- 21.Wray NR et al. Pitfalls of predicting complex traits from SNPs. Nat Rev Genet 14, 507–515, doi: 10.1038/nrg3457 (2013). [DOI] [PMC free article] [PubMed] [Google Scholar]
- 22.Toftdahl NG, Nordentoft M & Hjorthoj C Prevalence of substance use disorders in psychiatric patients: a nationwide Danish population-based study. Social psychiatry and psychiatric epidemiology 51, 129–140, doi: 10.1007/s00127-015-1104-4 (2016). [DOI] [PubMed] [Google Scholar]
- 23.Chavez-Noriega LE et al. Pharmacological characterization of recombinant human neuronal nicotinic acetylcholine receptors h alpha 2 beta 2, h alpha 2 beta 4, h alpha 3 beta 2, h alpha 3 beta 4, h alpha 4 beta 2, h alpha 4 beta 4 and h alpha 7 expressed in Xenopus oocytes. J Pharmacol Exp Ther 280, 346–356 (1997). [PubMed] [Google Scholar]
- 24.Corley RP et al. Association of candidate genes with antisocial drug dependence in adolescents. Drug and alcohol dependence 96, 90–98, doi: 10.1016/j.drugalcdep.2008.02.004 (2008). [DOI] [PMC free article] [PubMed] [Google Scholar]
- 25.Wang S et al. Significant associations of CHRNA2 and CHRNA6 with nicotine dependence in European American and African American populations. Hum Genet 133, 575–586, doi: 10.1007/s00439-013-1398-9 (2014). [DOI] [PMC free article] [PubMed] [Google Scholar]
- 26.Won H et al. Chromosome conformation elucidates regulatory relationships in developing human brain. Nature 538, 523–527, doi: 10.1038/nature19847 (2016). [DOI] [PMC free article] [PubMed] [Google Scholar]
- 27.Tobacco & Genetics Consortium. Genome-wide meta-analyses identify multiple loci associated with smoking behavior. Nature genetics 42, 441–447, doi: 10.1038/ng.571 (2010). [DOI] [PMC free article] [PubMed] [Google Scholar]
- 28.Agrawal A, Budney AJ & Lynskey MT The co-occurring use and misuse of cannabis and tobacco: a review. Addiction 107, 1221–1233, doi: 10.1111/j.1360-0443.2012.03837.x (2012). [DOI] [PMC free article] [PubMed] [Google Scholar]
- 29.Kutlu MG, Parikh V & Gould TJ Nicotine Addiction and Psychiatric Disorders. Int Rev Neurobiol 124, 171–208, doi: 10.1016/bs.irn.2015.08.004 (2015). [DOI] [PMC free article] [PubMed] [Google Scholar]
- 30.Liu M et al. Association studies of up to 1.2 million individuals yield new insights into the genetic etiology of tobacco and alcohol use. Nature genetics, doi: 10.1038/s41588-018-0307-5 (2019). [DOI] [PMC free article] [PubMed] [Google Scholar]
- 31.D'Souza MS & Markou A Schizophrenia and tobacco smoking comorbidity: nAChR agonists in the treatment of schizophrenia-associated cognitive deficits. Neuropharmacology 62, 1564–1573, doi: 10.1016/j.neuropharm.2011.01.044 (2012). [DOI] [PMC free article] [PubMed] [Google Scholar]
- 32.Barban N et al. Genome-wide analysis identifies 12 loci influencing human reproductive behavior. Nature genetics 48, 1462–1472, doi: 10.1038/ng.3698 (2016). [DOI] [PMC free article] [PubMed] [Google Scholar]
- 33.Demontis D et al. Discovery of the first genome-wide significant risk loci for attention deficit/hyperactivity disorder. Nature genetics 51, 63–75, doi: 10.1038/s41588-018-0269-7 (2019). [DOI] [PMC free article] [PubMed] [Google Scholar]
- 34.Miquel M et al. Have we been ignoring the elephant in the room? Seven arguments for considering the cerebellum as part of addiction circuitry. Neurosci Biobehav Rev 60, 1–11, doi: 10.1016/j.neubiorev.2015.11.005 (2016). [DOI] [PubMed] [Google Scholar]
- 35.Wagner MJ, Kim TH, Savall J, Schnitzer MJ & Luo L Cerebellar granule cells encode the expectation of reward. Nature 544, 96–100, doi: 10.1038/nature21726 (2017). [DOI] [PMC free article] [PubMed] [Google Scholar]
- 36.Stella N Chronic THC intake modifies fundamental cerebellar functions. J Clin Invest 123, 3208–3210, doi: 10.1172/JCI70226 (2013). [DOI] [PMC free article] [PubMed] [Google Scholar]
- 37.Mahgoub M et al. Effects of cannabidiol on the function of alpha7-nicotinic acetylcholine receptors. Eur J Pharmacol 720, 310–319, doi: 10.1016/j.ejphar.2013.10.011 (2013). [DOI] [PubMed] [Google Scholar]
- 38.Cachope R et al. Selective activation of cholinergic interneurons enhances accumbal phasic dopamine release: setting the tone for reward processing. Cell reports 2, 33–41, doi: 10.1016/j.celrep.2012.05.011 (2012). [DOI] [PMC free article] [PubMed] [Google Scholar]
- 39.Nava F, Carta G, Colombo G & Gessa GL Effects of chronic Delta(9)-tetrahydrocannabinol treatment on hippocampal extracellular acetylcholine concentration and alternation performance in the T-maze. Neuropharmacology 41, 392–399 (2001). [DOI] [PubMed] [Google Scholar]
- 40.Timmermann DB et al. Augmentation of cognitive function by NS9283, a stoichiometry-dependent positive allosteric modulator of alpha2- and alpha4-containing nicotinic acetylcholine receptors. Br J Pharmacol 167, 164–182, doi: 10.1111/j.1476-5381.2012.01989.x (2012). [DOI] [PMC free article] [PubMed] [Google Scholar]
- 41.Papke RL, Thinschmidt JS, Moulton BA, Meyer EM & Poirier A Activation and inhibition of rat neuronal nicotinic receptors by ABT-418. Br J Pharmacol 120, 429–438, doi: 10.1038/sj.bjp.0700930 (1997). [DOI] [PMC free article] [PubMed] [Google Scholar]
- 42.Frolich L, Ashwood T, Nilsson J, Eckerwall G & Sirocco I Effects of AZD3480 on cognition in patients with mild-to-moderate Alzheimer's disease: a phase IIb dose-finding study. J Alzheimers Dis 24, 363–374, doi: 10.3233/JAD-2011-101554 (2011). [DOI] [PubMed] [Google Scholar]
- 43.McKay JD et al. Large-scale association analysis identifies new lung cancer susceptibility loci and heterogeneity in genetic susceptibility across histological subtypes. Nature genetics 49, 1126–1132, doi: 10.1038/ng.3892 (2017). [DOI] [PMC free article] [PubMed] [Google Scholar]
- 44.Stout SM & Cimino NM Exogenous cannabinoids as substrates, inhibitors, and inducers of human drug metabolizing enzymes: a systematic review. Drug Metab Rev 46, 86–95, doi: 10.3109/03602532.2013.849268 (2014). [DOI] [PubMed] [Google Scholar]
- 45.Horwood LJ et al. Cannabis use and educational achievement: findings from three Australasian cohort studies. Drug and alcohol dependence 110, 247–253, doi: 10.1016/j.drugalcdep.2010.03.008 (2010). [DOI] [PubMed] [Google Scholar]
- 46.Verweij KJ, Huizink AC, Agrawal A, Martin NG & Lynskey MT Is the relationship between early-onset cannabis use and educational attainment causal or due to common liability? Drug and alcohol dependence 133, 580–586, doi: 10.1016/j.drugalcdep.2013.07.034 (2013). [DOI] [PMC free article] [PubMed] [Google Scholar]
- 47.Carey CE et al. Associations between Polygenic Risk for Psychiatric Disorders and Substance Involvement. Front Genet 7, 149, doi: 10.3389/fgene.2016.00149 (2016). [DOI] [PMC free article] [PubMed] [Google Scholar]
- 48.Kolla NJ et al. Adult attention deficit hyperactivity disorder symptom profiles and concurrent problems with alcohol and cannabis: sex differences in a representative, population survey. BMC psychiatry 16, 50, doi: 10.1186/s12888-016-0746-4 (2016). [DOI] [PMC free article] [PubMed] [Google Scholar]
- 49.Koskinen J, Lohonen J, Koponen H, Isohanni M & Miettunen J Rate of cannabis use disorders in clinical samples of patients with schizophrenia: a meta-analysis. Schizophr Bull 36, 1115–1130, doi: 10.1093/schbul/sbp031 (2010). [DOI] [PMC free article] [PubMed] [Google Scholar]
- 50.Reginsson GW et al. Polygenic risk scores for schizophrenia and bipolar disorder associate with addiction. Addiction biology 23, 485–492, doi: 10.1111/adb.12496 (2018). [DOI] [PMC free article] [PubMed] [Google Scholar]
Methods-only References
- 51.Pedersen CB et al. The iPSYCH2012 case-cohort sample: new directions for unravelling genetic and environmental architectures of severe mental disorders. Molecular psychiatry, doi: 10.1038/mp.2017.196 (2017). [DOI] [PMC free article] [PubMed] [Google Scholar]
- 52.Mors O, Perto GP & Mortensen PB The Danish Psychiatric Central Research Register. Scand J Public Health 39, 54–57, doi: 10.1177/1403494810395825 (2011). [DOI] [PubMed] [Google Scholar]
- 53.Pedersen CB The Danish Civil Registration System. Scand J Public Health 39, 22–25, doi: 10.1177/1403494810387965 (2011). [DOI] [PubMed] [Google Scholar]
- 54.Nørgaard-Pedersen B & Hougaard DM Storage policies and use of the Danish Newborn Screening Biobank. Journal of Inherited Metabolic Disease 30, 530–536 (2007). [DOI] [PubMed] [Google Scholar]
- 55.Lynge E, Sandegaard JL & Rebolj M The Danish National Patient Register. Scand J Public Health 39, 30–33, doi: 10.1177/1403494811401482 (2011). [DOI] [PubMed] [Google Scholar]
- 56.Borglum AD et al. Genome-wide study of association and interaction with maternal cytomegalovirus infection suggests new schizophrenia loci. Molecular psychiatry 19, 325–333, doi: 10.1038/mp.2013.2 (2014). [DOI] [PMC free article] [PubMed] [Google Scholar]
- 57.Hollegaard MV et al. Robustness of genome-wide scanning using archived dried blood spot samples as a DNA source. BMC Genet 12, 58, doi: 10.1186/1471-2156-12-58 (2011). [DOI] [PMC free article] [PubMed] [Google Scholar]
- 58.Illumina. illumina GenCall Data Analysis Software. Illumina Tech Note (2005). [Google Scholar]
- 59.Korn JM et al. Integrated genotype calling and association analysis of SNPs, common copy number polymorphisms and rare CNVs. Nature genetics 40, 1253–1260, doi: 10.1038/ng.237 (2008). [DOI] [PMC free article] [PubMed] [Google Scholar]
- 60.Goldstein JI et al. zCall: a rare variant caller for array-based genotyping: genetics and population analysis. Bioinformatics 28, 2543–2545, doi: 10.1093/bioinformatics/bts479 (2012). [DOI] [PMC free article] [PubMed] [Google Scholar]
- 61.Sudmant PH et al. An integrated map of structural variation in 2,504 human genomes. Nature 526, 75–81, doi: 10.1038/nature15394 (2015). [DOI] [PMC free article] [PubMed] [Google Scholar]
- 62.The 1000 Genomes Project Consortium. et al. A global reference for human genetic variation. Nature 526, 68–74, doi: 10.1038/nature15393 (2015). [DOI] [PMC free article] [PubMed] [Google Scholar]
- 63.Delaneau O, Marchini J & Zagury JF A linear complexity phasing method for thousands of genomes. Nature methods 9, 179–181, doi: 10.1038/nmeth.1785 (2011). [DOI] [PubMed] [Google Scholar]
- 64.Howie B, Marchini J & Stephens M Genotype imputation with thousands of genomes. G3 1, 457–470, doi: 10.1534/g3.111.001198 (2011). [DOI] [PMC free article] [PubMed] [Google Scholar]
- 65.Price AL et al. Long-range LD can confound genome scans in admixed populations. American journal of human genetics 83, 132–135; author reply 135-139, doi: 10.1016/j.ajhg.2008.06.005 (2008). [DOI] [PMC free article] [PubMed] [Google Scholar]
- 66.Purcell S et al. PLINK: a tool set for whole-genome association and population-based linkage analyses. American journal of human genetics 81, 559–575, doi: 10.1086/519795 (2007). [DOI] [PMC free article] [PubMed] [Google Scholar]
- 67.Chang CC et al. Second-generation PLINK: rising to the challenge of larger and richer datasets. Gigascience 4, 7, doi: 10.1186/s13742-015-0047-8 (2015). [DOI] [PMC free article] [PubMed] [Google Scholar]
- 68.Price AL et al. Principal components analysis corrects for stratification in genome-wide association studies. Nature genetics 38, 904–909, doi: 10.1038/ng1847 (2006). [DOI] [PubMed] [Google Scholar]
- 69.Galinsky KJ et al. Fast Principal-Component Analysis Reveals Convergent Evolution of ADH1B in Europe and East Asia. American journal of human genetics 98, 456–472, doi: 10.1016/j.ajhg.2015.12.022 (2016). [DOI] [PMC free article] [PubMed] [Google Scholar]
- 70.Gudbjartsson DF et al. Large-scale whole-genome sequencing of the Icelandic population. Nature genetics 47, 435–444, doi: 10.1038/ng.3247 (2015). [DOI] [PubMed] [Google Scholar]
- 71.Sveinbjornsson G et al. Rare mutations associating with serum creatinine and chronic kidney disease. Hum Mol Genet 23, 6935–6943, doi: 10.1093/hmg/ddu399 (2014). [DOI] [PubMed] [Google Scholar]
- 72.Willer CJ, Li Y & Abecasis GR METAL: fast and efficient meta-analysis of genomewide association scans. Bioinformatics 26, 2190–2191, doi: 10.1093/bioinformatics/btq340 (2010). [DOI] [PMC free article] [PubMed] [Google Scholar]
- 73.Vilhjalmsson BJ et al. Modeling Linkage Disequilibrium Increases Accuracy of Polygenic Risk Scores. American journal of human genetics 97, 576–592, doi: 10.1016/j.ajhg.2015.09.001 (2015). [DOI] [PMC free article] [PubMed] [Google Scholar]
- 74.Bulik-Sullivan BK et al. LD Score regression distinguishes confounding from polygenicity in genome-wide association studies. Nature genetics 47, 291–295, doi: 10.1038/ng.3211 (2015). [DOI] [PMC free article] [PubMed] [Google Scholar]
- 75.Yang J, Lee SH, Goddard ME & Visscher PM GCTA: a tool for genome-wide complex trait analysis. American journal of human genetics 88, 76–82, doi: 10.1016/j.ajhg.2010.11.011 (2011). [DOI] [PMC free article] [PubMed] [Google Scholar]
- 76.Goodwin RD et al. Trends in Daily Cannabis Use Among Cigarette Smokers: United States, 2002-2014. Am J Public Health 108, 137–142, doi: 10.2105/AJPH.2017.304050 (2018). [DOI] [PMC free article] [PubMed] [Google Scholar]
- 77.Gamazon ER et al. A gene-based association method for mapping traits using reference transcriptome data. Nature genetics 47, 1091–1098, doi: 10.1038/ng.3367 (2015). [DOI] [PMC free article] [PubMed] [Google Scholar]
- 78.Consortium, G. T. Human genomics. The Genotype-Tissue Expression (GTEx) pilot analysis: multitissue gene regulation in humans. Science 348, 648–660, doi: 10.1126/science.1262110 (2015). [DOI] [PMC free article] [PubMed] [Google Scholar]
- 79.Fromer M et al. Gene expression elucidates functional impact of polygenic risk for schizophrenia. Nature neuroscience 19, 1442–1453, doi: 10.1038/nn.4399 (2016). [DOI] [PMC free article] [PubMed] [Google Scholar]
- 80.Huckins LM et al. Gene expression imputation across multiple brain regions provides insights into schizophrenia risk. Nature genetics 51, 659–674, doi: 10.1038/s41588-019-0364-4 (2019). [DOI] [PMC free article] [PubMed] [Google Scholar]
- 81.Gusev A et al. Transcriptome-wide association study of schizophrenia and chromatin activity yields mechanistic disease insights. Nature genetics 50, 538–548, doi: 10.1038/s41588-018-0092-1 (2018). [DOI] [PMC free article] [PubMed] [Google Scholar]
Associated Data
This section collects any data citations, data availability statements, or supplementary materials included in this article.