

Abstract
BACKGROUND:
Chromosome instability (CIN) generates genetic and karyotypic diversity and is common in hematological malignancies. Low to moderate levels of CIN are well tolerated and can promote cancer proliferation; however, high levels of CIN are lethal. Thus, CIN may serve both as a prognostic factor to predict clinical outcome and as a predictive biomarker.
METHODS:
A retrospective study was performed to evaluate CIN in acute myeloid leukemia (AML). Chromosome mis-segregation frequency was correlated with clinical outcome in bone marrow core biopsy specimens from 17 AML cases. Additionally, we induced chromosome segregation errors in AML cell lines with AZ3146, an inhibitor of the Mps1 mitotic checkpoint kinase to quantify the phenotypic effects of high CIN.
RESULTS:
We observed a broad distribution of chromosome mis-segregation frequency in AML bone marrow core specimens. High CIN correlated with complex karyotype AML, as expected, although there was no clear survival effect. In addition to CIN, experimentally inducing chromosome segregation errors by Mps1 inhibition in AML cell lines causes DNA damage, micronuclei formation and upregulation of interferon stimulated genes (ISGs).
CONCLUSIONS:
High levels of CIN appear to be immunostimulatory, suggesting an opportunity to combine mitotic checkpoint inhibitors with immunotherapy in treatment of AML.
Keywords: Mitosis, aneuploidy, spindle assembly checkpoint, mitotic checkpoint, CIN, Mps1, cell cycle checkpoints
PRECIS FOR TABLE OF CONTENTS
Chromosome segregation errors are frequently encountered in acute myeloid leukemia. Weakening the mitotic checkpoint in AML cell lines leads to elevated chromosome mis-segregation, formation of micronuclei, DNA damage, and upregulation of interferon-stimulated genes.
BACKGROUND
Chromosome instability (CIN) refers to an increased rate of chromosome losses or gains due to mitotic errors. CIN arises from multiple mechanisms, including 1) weakened mitotic checkpoint signaling, 2) centrosome amplification, 3) impaired microtubule attachment error correction, 4) cohesion defects, and 5) telomere dysfunction1–3. The mitotic checkpoint (also called the spindle assembly checkpoint) monitors microtubule-kinetochore attachments and delays anaphase onset until all replicated chromosome pairs are properly bioriented (with sister chromatids attached to microtubules emanating from opposite spindle poles). Thus, checkpoint weakening permits premature entry into anaphase in cells with chromosomes that are unattached or improperly attached to the mitotic spindle. Centrosome amplification often results in multipolar spindles during early mitosis, which can generate inappropriate microtubule-kinetochore attachments, such as merotelic attachments (in which the kinetochore from a single chromatid is bound to microtubules emanating from both spindle poles). Notably, merotelic attachments satisfy the mitotic checkpoint, permitting anaphase onset4–6. Chromosome cohesion defects produce either premature sister chromatid separation or chromatid nondisjunction, depending on if cohesion loss occurs early or is delayed. Telomere erosion results in fusion of the chromosome lacking a telomere with an intact chromosome, producing one chromosome with two kinetochores, resulting in a chromosome bridge. Overall, these mechanisms of CIN can yield mitotic defects including misaligned or lagging chromosomes, chromatin bridges, and multipolar divisions. Lagging chromosomes and chromatin bridges are readily observable during late stages of mitosis (anaphase and telophase). Although lagging chromosomes do not always mis-segregate, they are useful indicators of chromosome mis-segregation events7–9. Therefore, quantification of chromosome segregation abnormalities by direct observation of tumor samples in anaphase and telophase can be used as a surrogate marker to assess CIN.
In addition to whole chromosome gains and losses, chromosome segregation errors can result in DNA damage. Lagging chromosomes can become damaged during cytokinesis10 or, if they fail to rejoin the bulk mass of segregating chromosomes, form a separate nucleus termed a micronucleus, in the ensuing interphase. DNA replication in these micronuclei is delayed, resulting in DNA fragmentation and catastrophic rearrangement of the one or two chromosomes in the micronucleus, termed “chromothripsis”11. Although DNA damage from segregation errors may be tumorigenic, these errors may also activate immune surveillance. Specifically, the nuclear envelopes of micronuclei are prone to rupture, which allows DNA to enter the cytoplasm, generating an innate immune response12–16.
In AML, CIN is thought to be an important mechanism for generating aberrant complex karyotypes, which carry a poor prognosis and confer resistance to chemotherapy in acute myeloid leukemia (AML)17. Yet a paradoxical relationship exists between CIN and tumor progression: low and intermediate levels of CIN are beneficial for tumor clonal evolution, whereas high levels of CIN can be detrimental for cell survival18–21. Thus, CIN could be both a prognostic factor (to predict clinical outcome) and may provide a targetable vulnerability22,23. The dual specificity protein kinase, Monopolar spindle 1 (Mps1, also known as TTK), critically regulates the mitotic checkpoint and proper microtubule binding to the kinetochore24–28. Inhibition of Mps1 causes anaphase chromosome mis-segregation, resulting in aneuploid daughter cells and, in many cases, cell death29–33. As a result, several Mps1 inhibitors are currently under investigation in clinical trials (NCT02792465, NCT02366949, NCT03328494).
Despite the promise of CIN as a potential biomarker and therapeutic target, little is known about CIN in acute myeloid leukemia (AML). Therefore, we performed a retrospective analysis of biopsy samples in 17 subjects with AML to determine if clinical outcome correlated with levels of CIN. We anticipated that a low frequency of chromosome segregation errors (low CIN) would predict worse outcome, while high frequency (high CIN) would predict better outcome. Additionally, we used the Mps1 inhibitor, AZ3146, to exacerbate chromosome segregation errors in AML cell lines, to evaluate if the high rate of CIN induced DNA damage and increased type I interferon signaling.
MATERIALS AND METHODS
Tissue Specimens
AML bone marrow core biopsy specimens were collected, fixed, and H&E stained with consent waived under the Institutional Review Board-approved research protocol UW16097 (MR-IRB 2016–1065). Slides from 30 patient samples were examined using a Nikon Eclipse Ti inverted microscope equipped with a 100x/1.4NA (Plan Apo) DIC oil immersion objective and ORCA Flash4.0 V2+ digital sCMOS camera (Hammamatsu). Samples were included only if > 4 anaphase cells were observed, and 17/30 samples met this inclusion criteria. Anaphase cells were surveyed for evidence of chromosome mis-segregation (Figure 1A) and percentage of anaphase cells exhibiting chromosome mis-segregation was calculated for each sample. The median value was used to classify samples into “high” or “low” mis-segregation frequency groups.
Patient clinical data (Supplementary Table 1) were obtained by chart review. Overall and cancer-specific survival was calculated by time period from the date of diagnosis to study endpoint (death or last follow-up). Survival curves were plotted using Prism 8 (GraphPad) using the Kaplan–Meier method, and log-rank (Mantel-Cox) tests were used to compare patients with high vs. low mis-segregation frequency.
Cell lines and culture conditions
Kasumi-1 cells were obtained from American Type Culture Collection (ATCC). MV4–11 and K562 cells were gifts from Emery Bresnick. THP-1 cells were a gift from David Beebe. All cell lines were validated at UW-Madison using polymorphic short tandem repeat loci and were free of mycoplasma. All cell lines were maintained at 37°C and 5% CO2 in a humidified incubator in RPMI 1640 medium containing 2 mM L-glutamine, supplemented with 100 units/mL penicillin-streptomycin and 10% (THP-1, K562 and MV4–11) or 20% (Kasumi-1) fetal bovine serum.
For thymidine synchronization, cells were challenged with 2.5 mM thymidine for 24 h, washed once with HBSS, then replenished with normal media for 8 h prior to further chemical treatments.
Chemicals, antibodies, and probes
Thymidine (#6060) was purchased from Calbiochem. Nocodazole (#M1404) was purchased from Sigma-Aldrich. AZ3146 (#S2731) was purchased from Selleck Chemicals. Stat1 (Cell Signaling, #9172S) and pStat1(Y701) (Cell Signaling, #9167S) were used at 1:1000 for western blotting. pH2AX (Millipore, #07–164) was used at 1:1000 for IF. FISH probes targeting alpha-satellite sequences of chromosome 6 (LPE006) and chromosome 8 (LPE008) were purchased from Cytocell.
Lentiviral production and transduction
Lentiviral particles were produced by seeding 4×10⁶ HEK 293T cells into a 10 cm dish. The day after plating, cells were transfected with 10 μg of pBobi-H2B-mScarlet vector together with 6.5 μg pMDLg/pRRE packaging vector, 3.5 μg pCMV-VSV-G and 5 μg pRSV-Rev using the calcium phosphate method. The medium was replaced after 10–12 h incubation, and 48 h later the supernatant containing viral particles was collected, centrifuged at 500g for 5 min and filtered through a 0.45 μm PES filter. 1 ml of filtered virus supernatant was then used to infect 50%–60% confluent cells in a 6-well plate. Transduced cells were collected and selected via FACS sorting after 48 h. Polyclonal populations were used in imaging experiments.
Imaging
FISH in Suspension.
K562 cells were grown in media untreated or containing 8 μM AZ3146 for 24 h and pelleted by centrifugation at 2000 rpm for 3 min. Media was removed, cell pellets were gently re-suspended in freshly prepared 3:1 methanol:acetic acid fixative, and allowed to incubate at room temperature (RT) for 10 min. After re-pelleting at 2000 rpm for 3 min, fixative was removed, and cells were washed twice in 5 ml 2xSSC + 0.05% Tween 20 (re-pelleting in between rinses). After 2nd rinse and pelleting, cells were resuspended in PBS and transferred to 1.5ml Eppendorf tubes. Cells were re-pelleted at 1000 rpm for 3 min, PBS was aspirated, and the cells were resuspended by adding staining mix (8 μL nuclease-free H2O, 4 μL probe, 28 μL hybridization solution B) dropwise to each pellet. The cell mixtures were then transferred to 0.2 ml, sterile PCR tubes and cycled in a thermal cycler using the following program: 5 min at 80 °C and then > 12 h at 42 °C. After cycling, 200 μl of 2x SSC + 0.05% Tween 20 was added to each PCR tube (at RT) and the contents were mixed by gentle pipetting. Cells were then transferred to 1.5ml Eppendorf tubes and pelleted at 1200 rpm for 3 min. Supernatant was removed and pellets were resuspended in 50 μl PBS (at RT) and stored in dark until cytocentrifugation
Cytocentrifugation.
Cells were grown in suspension, collected, pelleted and resuspended in PBS to a concentration of approximately 8×10⁴ cells/ml. 500 μl of each cell suspension was inserted into a funnel and then spun onto coverslips at 800 rpm for 3 min using a Cytopro cytocentrifuge (Wescor). Cells were allowed to air dry prior to fixation and staining.
Fixed Immunofluorescence.
Cells were fixed in 4% paraformaldehyde in PBS for 15 min at RT, washed 3 times in PBS, and then blocked for 30 min at RT in 3% bovine serum albumin (BSA) and 0.1% Triton X-100 in PBS (PBSTx+BSA). Primary antibodies were pooled and diluted in PBSTx+BSA. Coverslips were incubated in primary antibodies for 1 h at RT and washed 3 times in PBSTx. Alexa Fluor (Invitrogen) secondary antibodies were pooled and diluted at 1:350 in PBSTx+BSA. Coverslips were incubated in secondary antibody for 45 min at RT and then washed twice with PBSTx. Coverslips were counterstained with DAPI and mounted on glass slides with Prolong Diamond anti-fade medium (Invitrogen) and allowed to cure overnight. Image acquisition was performed on a Nikon Eclipse Ti inverted microscope equipped with motorized stage, LED epifluorescence light source (Spectra X), 60x/1.4 NA (Plan Apo) objective, and ORCA Flash4.0 V2+ digital sCMOS camera (Hamamatsu).
Live cell imaging.
For mitotic checkpoint experiments (Figure 2), AML cell lines stably expressing H2B-mScarlet were seeded onto poly-L-lysine coated glass-bottomed plates and grown to 90% confluency. Prior to imaging, cells were challenged with 0.2 μg/ml nocodazole for 4 h or left untreated. Image acquisition was performed on a Nikon Eclipse Ti inverted microscope equipped with motorized stage, LED epifluorescence light source (Spectra X), 20x/0.45 NA (Plan Apo) objective, and ORCA Flash4.0 V2+ digital sCMOS camera (Hamamatsu). Environmental control was maintained at 37 °C and 5% CO2. Images were acquired every 2 min for 10 h. For Mps1 inhibitor experiments (Figure 3), K562 cells stably expressing H2B-mScarlet were seeded onto poly-L-lysine coated glass-bottomed plates and grown to 90% confluency. Prior to imaging, cells were challenged with 2 μM AZ3146 for 2 h or left untreated. Image acquisition was performed as described above. Images were acquired every 3 min for 24 h.
RNA extraction and RT-qPCR
For each sample, 3 × 10⁶ cells were harvested, resuspended in 1 ml of TRI Reagent (Molecular Research Center, #TR11850ML) and RNA was extracted per manufacturer’s instructions. Up to 2 μg of RNA from each sample was then used to generate cDNA using the High Capacity cDNA Reverse Transcription kit (Applied Biosystems, #4368814) with random primers according to the manufacturer’s instructions. Quantitative PCR reactions were prepared using iQ SYBR Green Supermix (BioRad, #1708884) 100 ng cDNA, and 300 nM of each primer (See Supplementary Table 2 for sequences/annealing temps). Reactions were carried out in a MyiQ LiqhtCycler (BioRad) using the following program: 3 min 95°C; 40 x (15 sec 95 C, 60 sec 55°C or 57 °C); 60 sec 95°C; 60 sec 55°C. Fold changes in gene expression were assessed using the 2^-ΔΔCt method34. Significant upregulation or downregulation was determined by a 2-fold increase or decrease, respectively, against untreated control cells.
Western Blot
For all experiments, cells were lysed, frozen, and stored at −80°C prior to use. Cell pellets were lysed in buffer (50 mM HEPES pH 7.5, 100 mM NaCl, 0.5% NP-40, 10% glycerol) containing phosphatase inhibitors (10 mM sodium pyrophosphate, 5 mM β-glycerophosphate, 50 mM NaF, 0.3 mM Na3VO4), 1mM PMSF, 1x protease inhibitor cocktail (Thermo-Scientific) and 1 mM dithiothreitol. A 25-gauge syringe was used to provide additional mechanical lysis to the cell membrane before incubating lysate on ice and centrifuging at 4°C to remove insoluble pellet. Protein concentration was measured by Bradford assay. Proteins were separated by SDS-PAGE, transferred to Immobilon PVDF membrane (Millipore), and blocked for 30 min in 0.1% Tween-20 Tris buffered saline ph 7.4 supplemented with 5% BSA or 5% milk. Membranes were incubated with gentle agitation for 24 h at 4°C with primary antibodies diluted in TBST supplemented with 5% BSA or 5% milk, washed 3x with TBST, incubated for 1 h at room temperature in secondary antibodies conjugated to horseradish peroxidase diluted 1:10,000 in TBST supplemented with 5% milk. Membranes were washed and developed with luminol/peroxide (Millipore) and visualized with film.
Chromosome analysis
Chromosome analysis was performed on K562 cells untreated or 24 h post-challenge with 2 μM AZ3146. Colcemid was added to a final concentration of 0.05 μg/mL for the final 20 min. Cells were swollen in a hypotonic solution (0.075 M KCl) for 20 min at 37 °C, and then fixed three times in fresh Carnoy’s fixative. Cells were dropped onto slides and dried in a drying chamber. Slides were banded by GTG banding technique. Chromosomal abnormalities were identified and described according to the 2016 International System of Human Cytogenetic Nomenclature35. For each condition, twenty cells were fully analyzed and additional nineteen cells were counted for chromosome number only (Supplementary Table 3).
Statistical analysis
Data analysis was performed using Prism 8 (GraphPad). Statistical significance was determined using two-tailed Mann-Whitney tests.
RESULTS
Chromosome mis-segregation frequency is variable in AML with higher rates suggestive of better overall survival
To understand the effects of CIN on immunogenicity in AML, we first surveyed the incidence of CIN in AML patient samples. There are several different methodologies to assess CIN36. We chose direct observation of anaphase segregation errors in bone marrow core biopsy specimens to assess CIN because of easy access to samples and relatively high proliferative indices in AML. We defined chromosome mis-segregation frequency as the number of anaphase cells with lagging chromosomes (a chromosome that lags between the two masses of segregating DNA) or chromatin bridges (a chromosome that completely spans the segregating masses) divided by the total number of anaphase cells observed.
We analyzed bone marrow core biopsy tissue slides from 17 AML patients treated in the hematology clinic at the University of Wisconsin Hospital and Clinics. Clinical outcomes including overall survival, recurrence-free survival and cancer-specific survival were obtained by chart review with a follow up time of 3 years. We observed both lagging chromosomes and chromosome bridges in the samples (Figure 1A), with frequencies ranging from 0–67% (Figure 1B). To determine if chromosome mis-segregation frequency correlates with overall survival, we separated patients into high or low mis-segregation frequency groups using a median 45% cutoff (Figure 1B). We observed a non-statistically significant trend of extremely high chromosome mis-segregation frequency associated with better overall survival (median 13.8 months in high mis-segregation frequency group vs. 7.6 months in low mis-segregation frequency group, p=0.8343) (Figure 1C), particularly with mis-segregation rates above 50% (Supplementary Figure 1). We observed a similar trend for recurrence-free survival (median 7.2 months in high mis-segregation frequency group vs. 5.2 months in low mis-segregation frequency group, p=0.3420) (Figure 1C). Because complex karyotype is a prognostic marker for AML, we correlated mis-segregation frequency with karyotype complexity. Elevated mis-segregation rates were more frequently associated with complex karyotypes (Figure 1D), and patients with complex karyotypes were more likely to progress sooner (median 3.3 months in complex karyotype group vs. 7.3 months in simple karyotype group, p=0.9691) (Figure 1E). Chromosome mis-segregation frequency does not strongly correlate with cancer specific survival—a difference that could be attributed to multiple factors such as comorbidities, gene mutation, age or treatment side effects.
Figure 1.
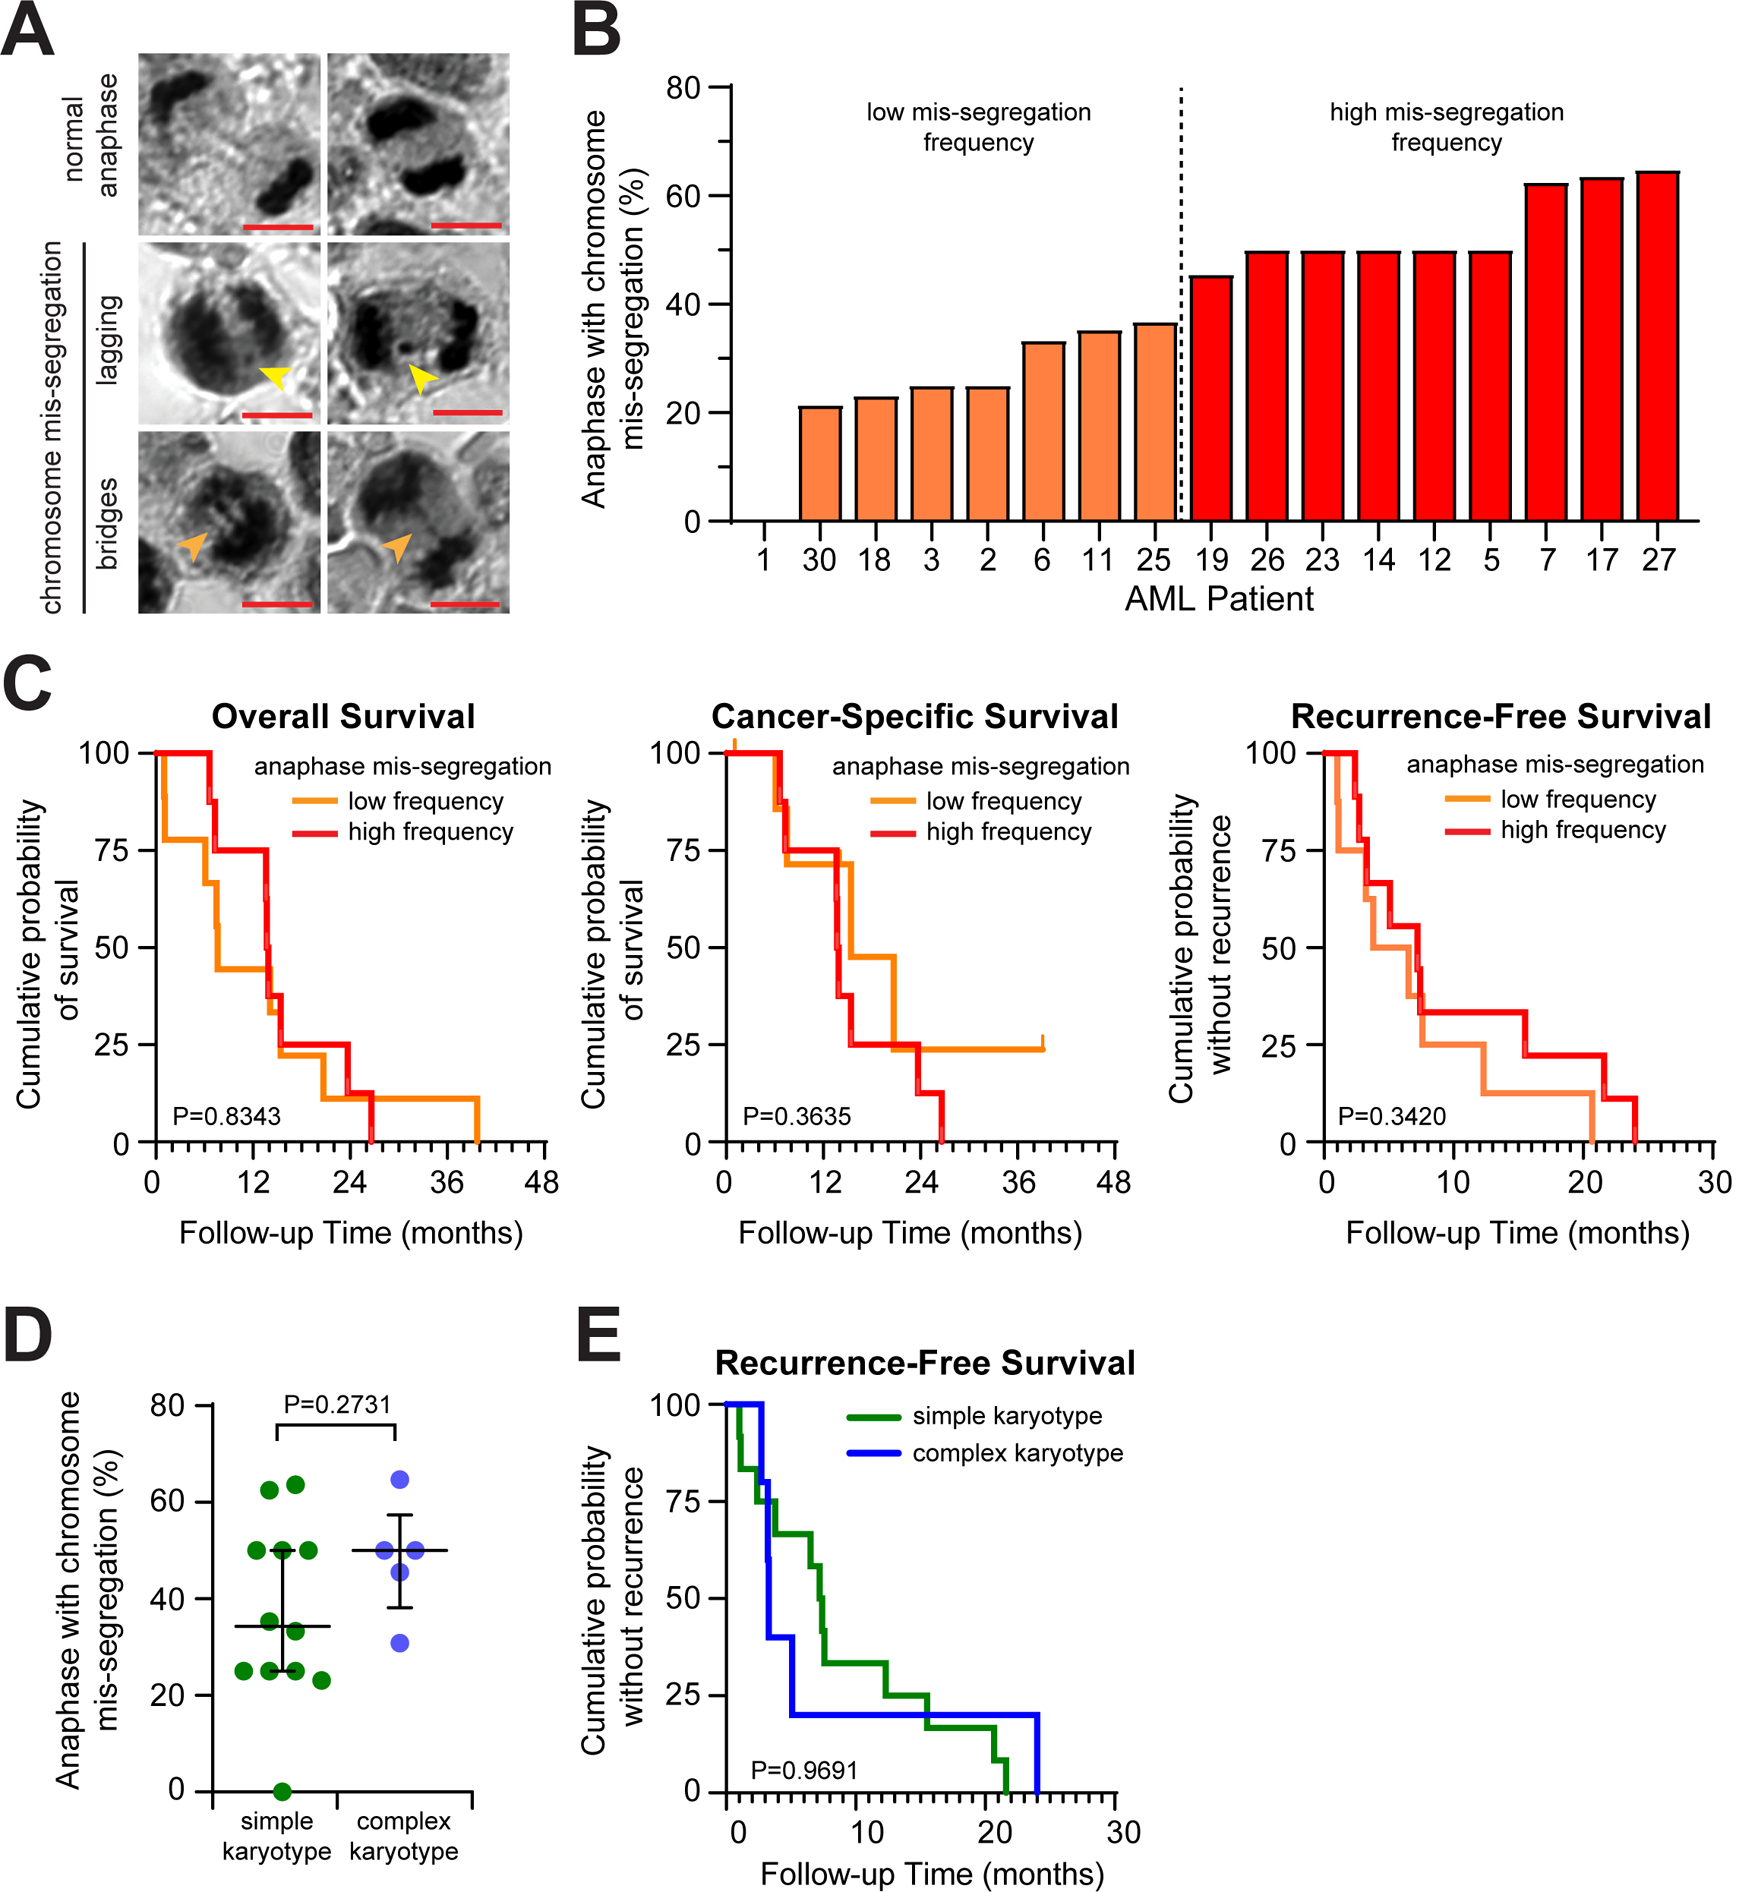
AML patients with high chromosome mis-segregation frequency trend toward better clinical outcome. (A) Representative images of anaphase cells from H&E stained AML samples, indicating normal or mis-segregation phenotypes (lagging chromosome, yellow arrows; chromatin bridge, orange arrows). Scale bar, 5 μm. (B) Graph of chromosome mis-segregation frequency from 17 AML samples. Frequencies at or above the median are classified “High” whereas frequencies below the median are classified as “Low”. (C) Kaplan-Meier analysis comparing survival probability of patients with high and low chromosome mis-segregation frequency. Significance determined by Log-Rank Mantel-Cox method. (D) Graph of mis-segregation rates by karyotype complexity. Each dot represents a patient sample. Bars represent median and interquartile range. Significance determined by Mann-Whitney test. (E) Kaplan-Meier analysis comparing recurrence-free survival probability of patients with simple or complex karyotypes. Significance determined by Log-Rank Mantel-Cox method.
Mps1 inhibitor AZ3146 weakens the mitotic checkpoint and induces chromosomal instability in AML cell lines
To study the immunogenic effects of CIN in AML cell lines, we chose a commercially available Mps1 inhibitor, AZ3146, for our experiments. AZ3146 dramatically accelerates mitotic exit at 2 μM, disrupting mitosis in about 90% of treated cells30. First, we determined the baseline mitotic checkpoint strength in AML cell lines by time-lapse videomicroscopy. We stably expressed H2B-mScarlet to visualize DNA in three AML lines: K562, Kasumi-1, and MV4–11. We challenged each cell line with the microtubule poison nocodazole to produce unattached kinetochores and activate the mitotic checkpoint. Cells with strong checkpoints arrest in prometaphase for prolonged periods in the presence of nocodazole. Cells with weak checkpoints, however, exit mitosis more rapidly. Since the mitotic spindle is disrupted by nocodazole, cells often exit mitosis without a discernible anaphase or cytokinesis, termed “mitotic slippage”. As a control, we also imaged cells without the addition of nocodazole. Without nocodazole, AML cells typically entered anaphase within about 30 min of mitotic entry (Supplementary Figure 2A). In the presence of nocodazole, the three AML cell lines demonstrated varying abilities to sustain a mitotic arrest. K562 cells frequently exhibited a prolonged arrest (10 hours), characterized by numerous chromosomes failing to align at the cell midline. In contrast, MV4–11 cells underwent apoptosis after only several hours of mitotic arrest. Finally, Kasumi-1 cells exhibited a mixture of sustained arrest and apoptosis (Supplementary Figures 2A–B, Supplementary Videos 1–4). Importantly, we rarely observed a cell exiting mitosis after only a brief arrest, consistent with all three cell lines possessing functional mitotic checkpoints.
Next, we sought a working concentration of AZ3146 sufficient to silence the mitotic checkpoint and generate chromosome segregation errors. We challenged AML cell lines with nocodazole for 8 h to accumulate cells in prometaphase and titrated in AZ3146 to identify the concentration that forces mitotic exit. For all cell lines tested, concentrations of 2–4 μM AZ3146 sufficiently decreased the percentage of prometaphase cells by half (Supplementary Figure 2C).
Next, we asked if AZ3146 treatment enhances CIN in AML cells. To do so, we performed Fluorescent In Situ Hybridization (FISH) in cell suspension as previously described37. FISH analysis revealed a baseline variance of 10% in copy number for chromosome 6 and 8 in untreated K562 cells, suggesting that these cells exhibit basal levels of chromosome mis-segregation. Importantly, a 24 h incubation in 8 μM AZ3146 increased this variation to 30% (Figure 2A–B). We next performed chromosome analysis on K562 cells challenged with or without 2 μM AZ3146 for 24 h. Chromosome analysis revealed K562 cells to be mostly triploid with a common set of structural and numerical abnormalities (Figure 2C–D, Supplementary Table 3). Consistent with the FISH results, addition of 2 μM AZ3146 shifted modal chromosome number (Figure 2C–D). Moreover, it exacerbated the number and type of unbalanced structural abnormalities observed (Figure 2D–F, Supplementary Table 3). Combined, our results indicate that AZ3146 weakens the mitotic checkpoint, exacerbating CIN in AML cells.
Figure 2.
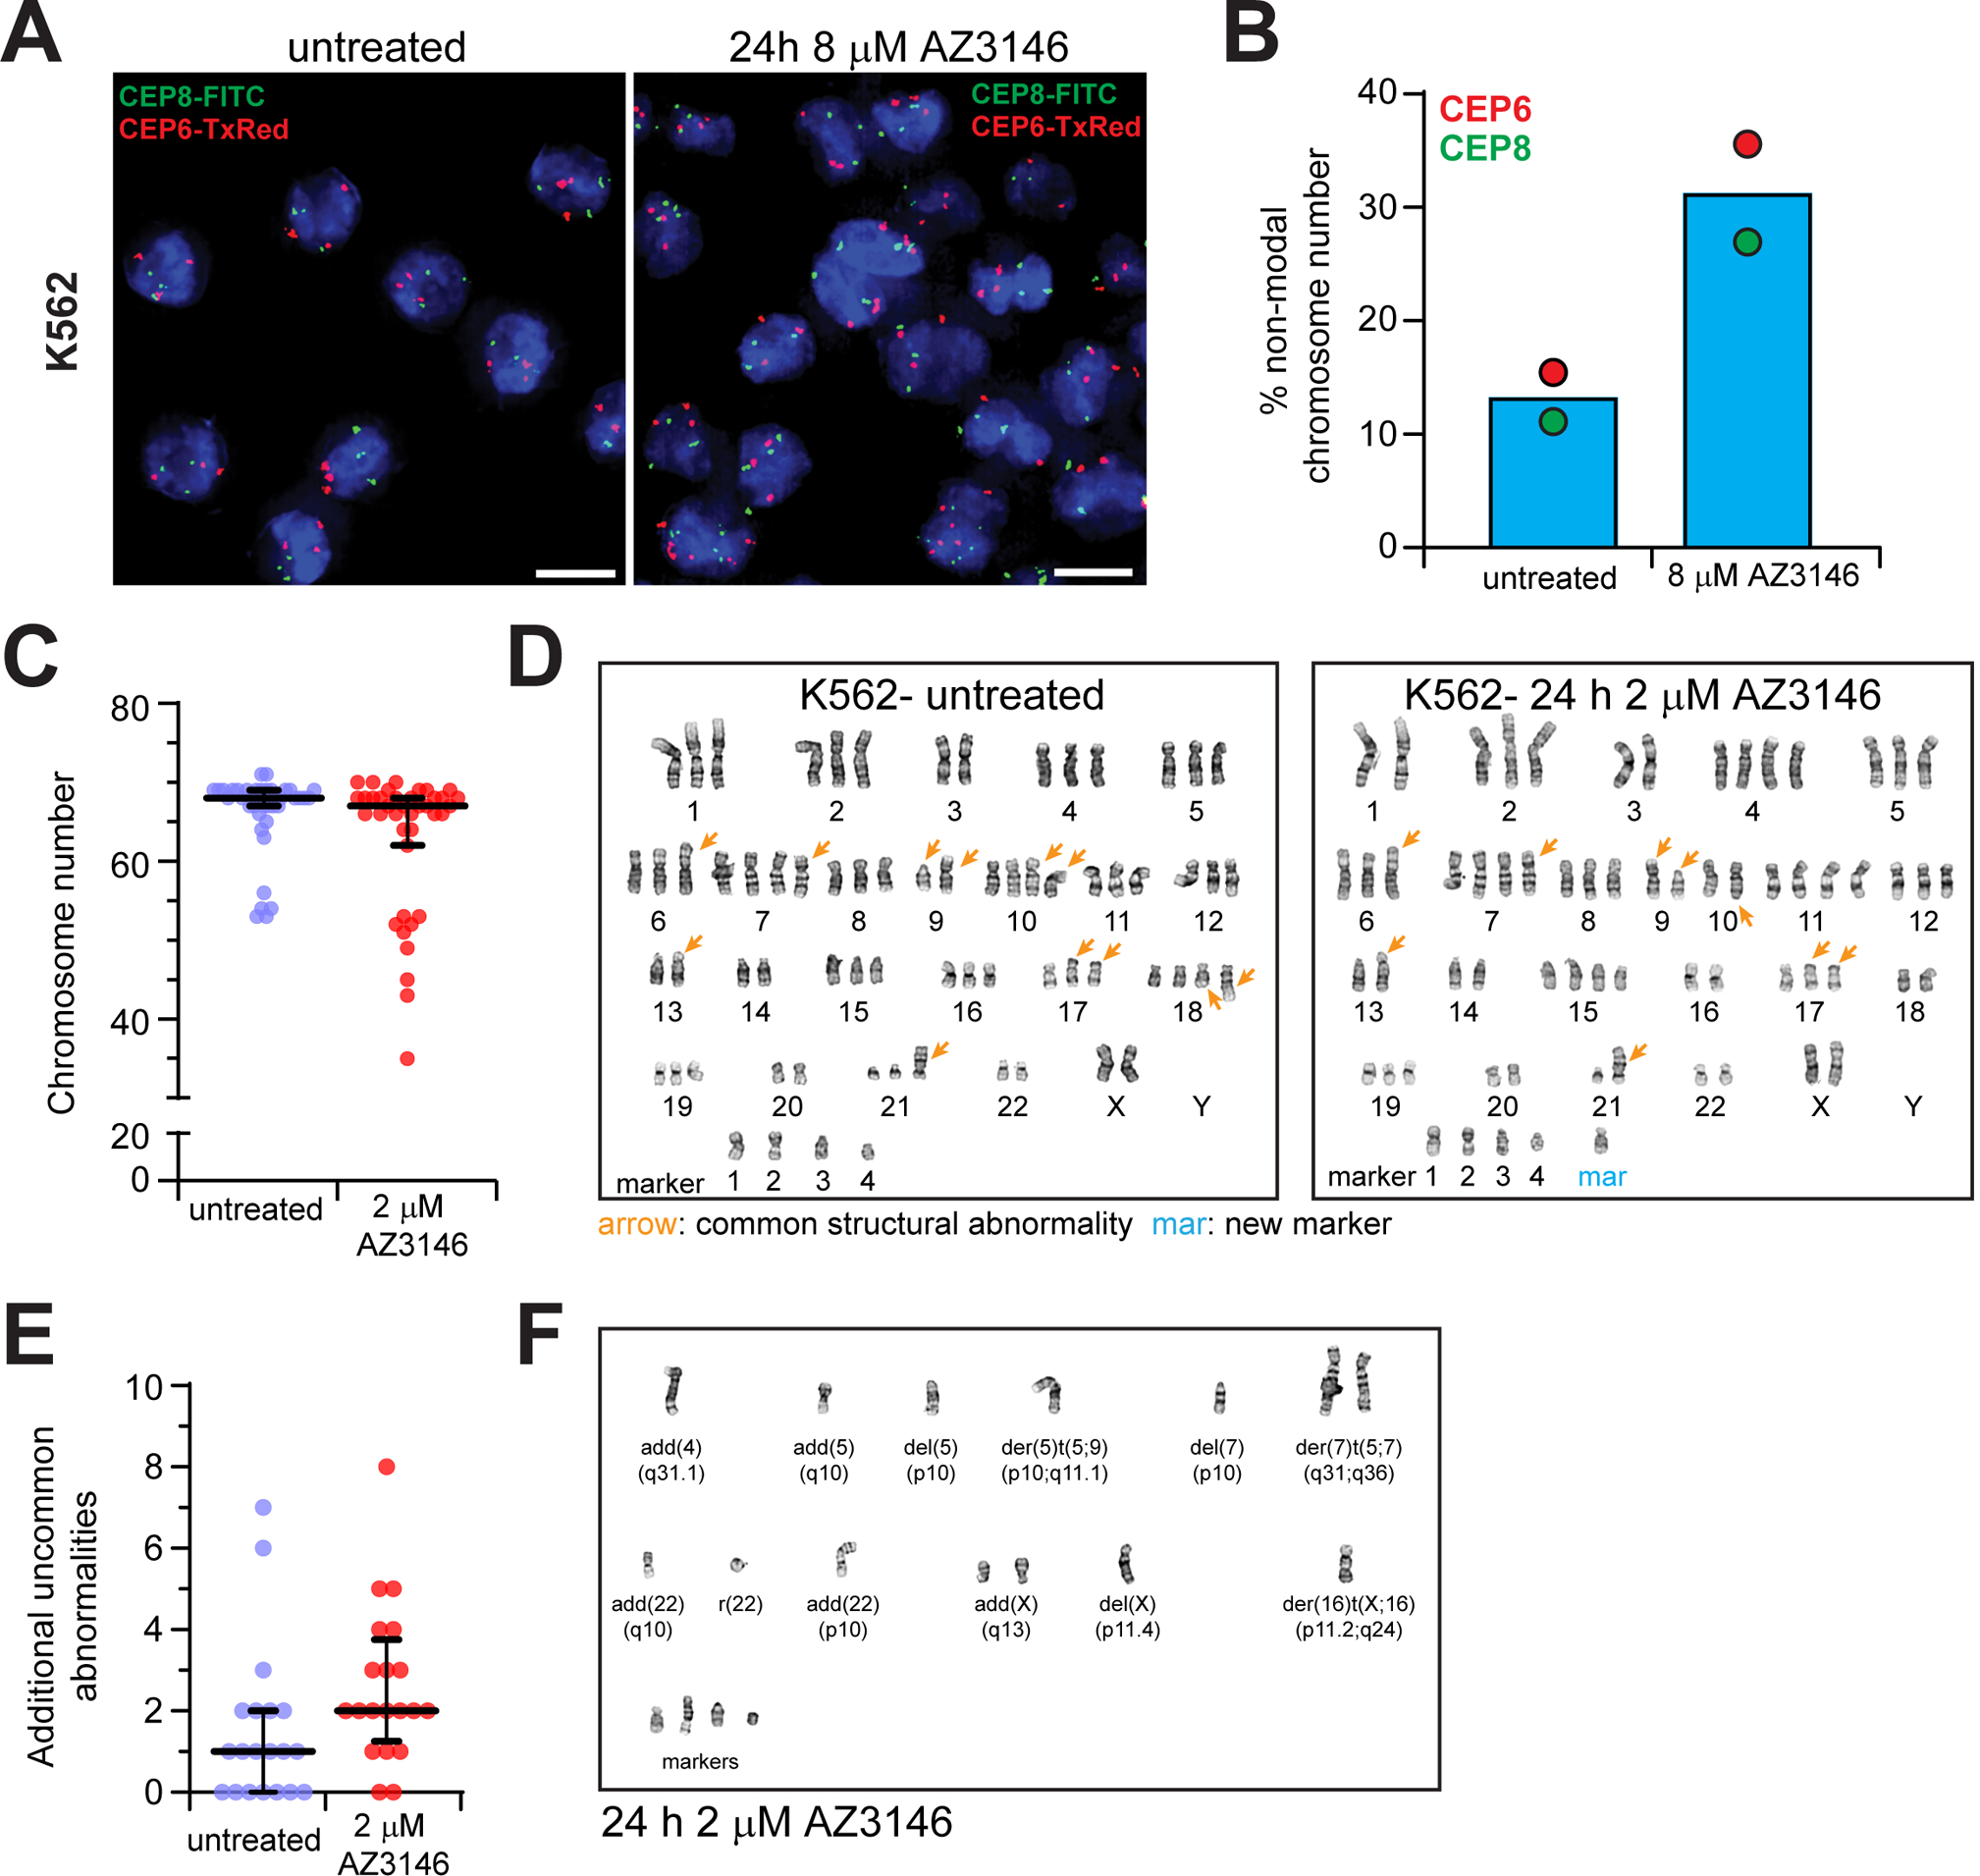
Mps1 inhibitor AZ3146 induces chromosome instability in AML cell lines. (A) Representative images of FISH analysis of interphase K562 cells challenged with or without 8 μM AZ3146 for 24 h. Centromeric probe (CEP6, red and CEP8, green) foci were recorded per cell with a modal number of 3 foci observed for each probe. Scale bar, 10 μm. (B) Graph represents the average frequency (+/− SD) of cells with non-modal foci from (A) (n= 100 cells counted/probe from one experiment). (C-F) Cytogenetic analysis of K562 cells challenged with or without 2 μM AZ3146 for 24 h. (C) Graph indicates number of chromosomes per cell. Each dot represents a cell (n= 40/treatment) and bars represent the median and interquartile range. (D) Representative karyotypes from each treatment. See also Supplementary Table 3. (E) Graph indicates numerical differences and structural abnormalities of chromosomes observed in addition to those observed in the untreated “composite karyotype”. Each dot represents a cell (n= 20/treatment) and bars represent the median and interquartile range. (F) Image of additional chromosome structural abnormalities observed after 2 μM AZ3146.
AZ3146 generates lagging chromosomes followed by micronuclei and DNA damage in AML cells
Evidence suggests that mitotic errors can cause chromosome breakage, inducing DNA damage38. Mechanistically, chromosome breakage may arise from merotelic attachments. In one model, opposing microtubule forces at the kinetochore tears the underlying chromosomal DNA39. In a second model, chromatin is cleaved during cytokinesis, when the cleavage furrow encounters lagging chromosomes trapped within the cleavage plane38. In a third model, DNA in micronuclei is damaged due to aberrant and incomplete replication in S phase. Following mitosis, γ-H2AX foci are observed at DNA damage sites10,40,41.
To determine if AZ3146-induced chromosome mis-segregation produces DNA damage, we probed for γ-H2AX in fixed, synchronized K562 cells challenged with 4 μM AZ3146 for 24 hours. Compared with untreated controls, we observed a modest, but significant, increase in γ-H2AX intensity in AZ3146-treated cells (Figure 3A–B), indicating that Mps1 inhibition produces DNA damage.
Figure 3.
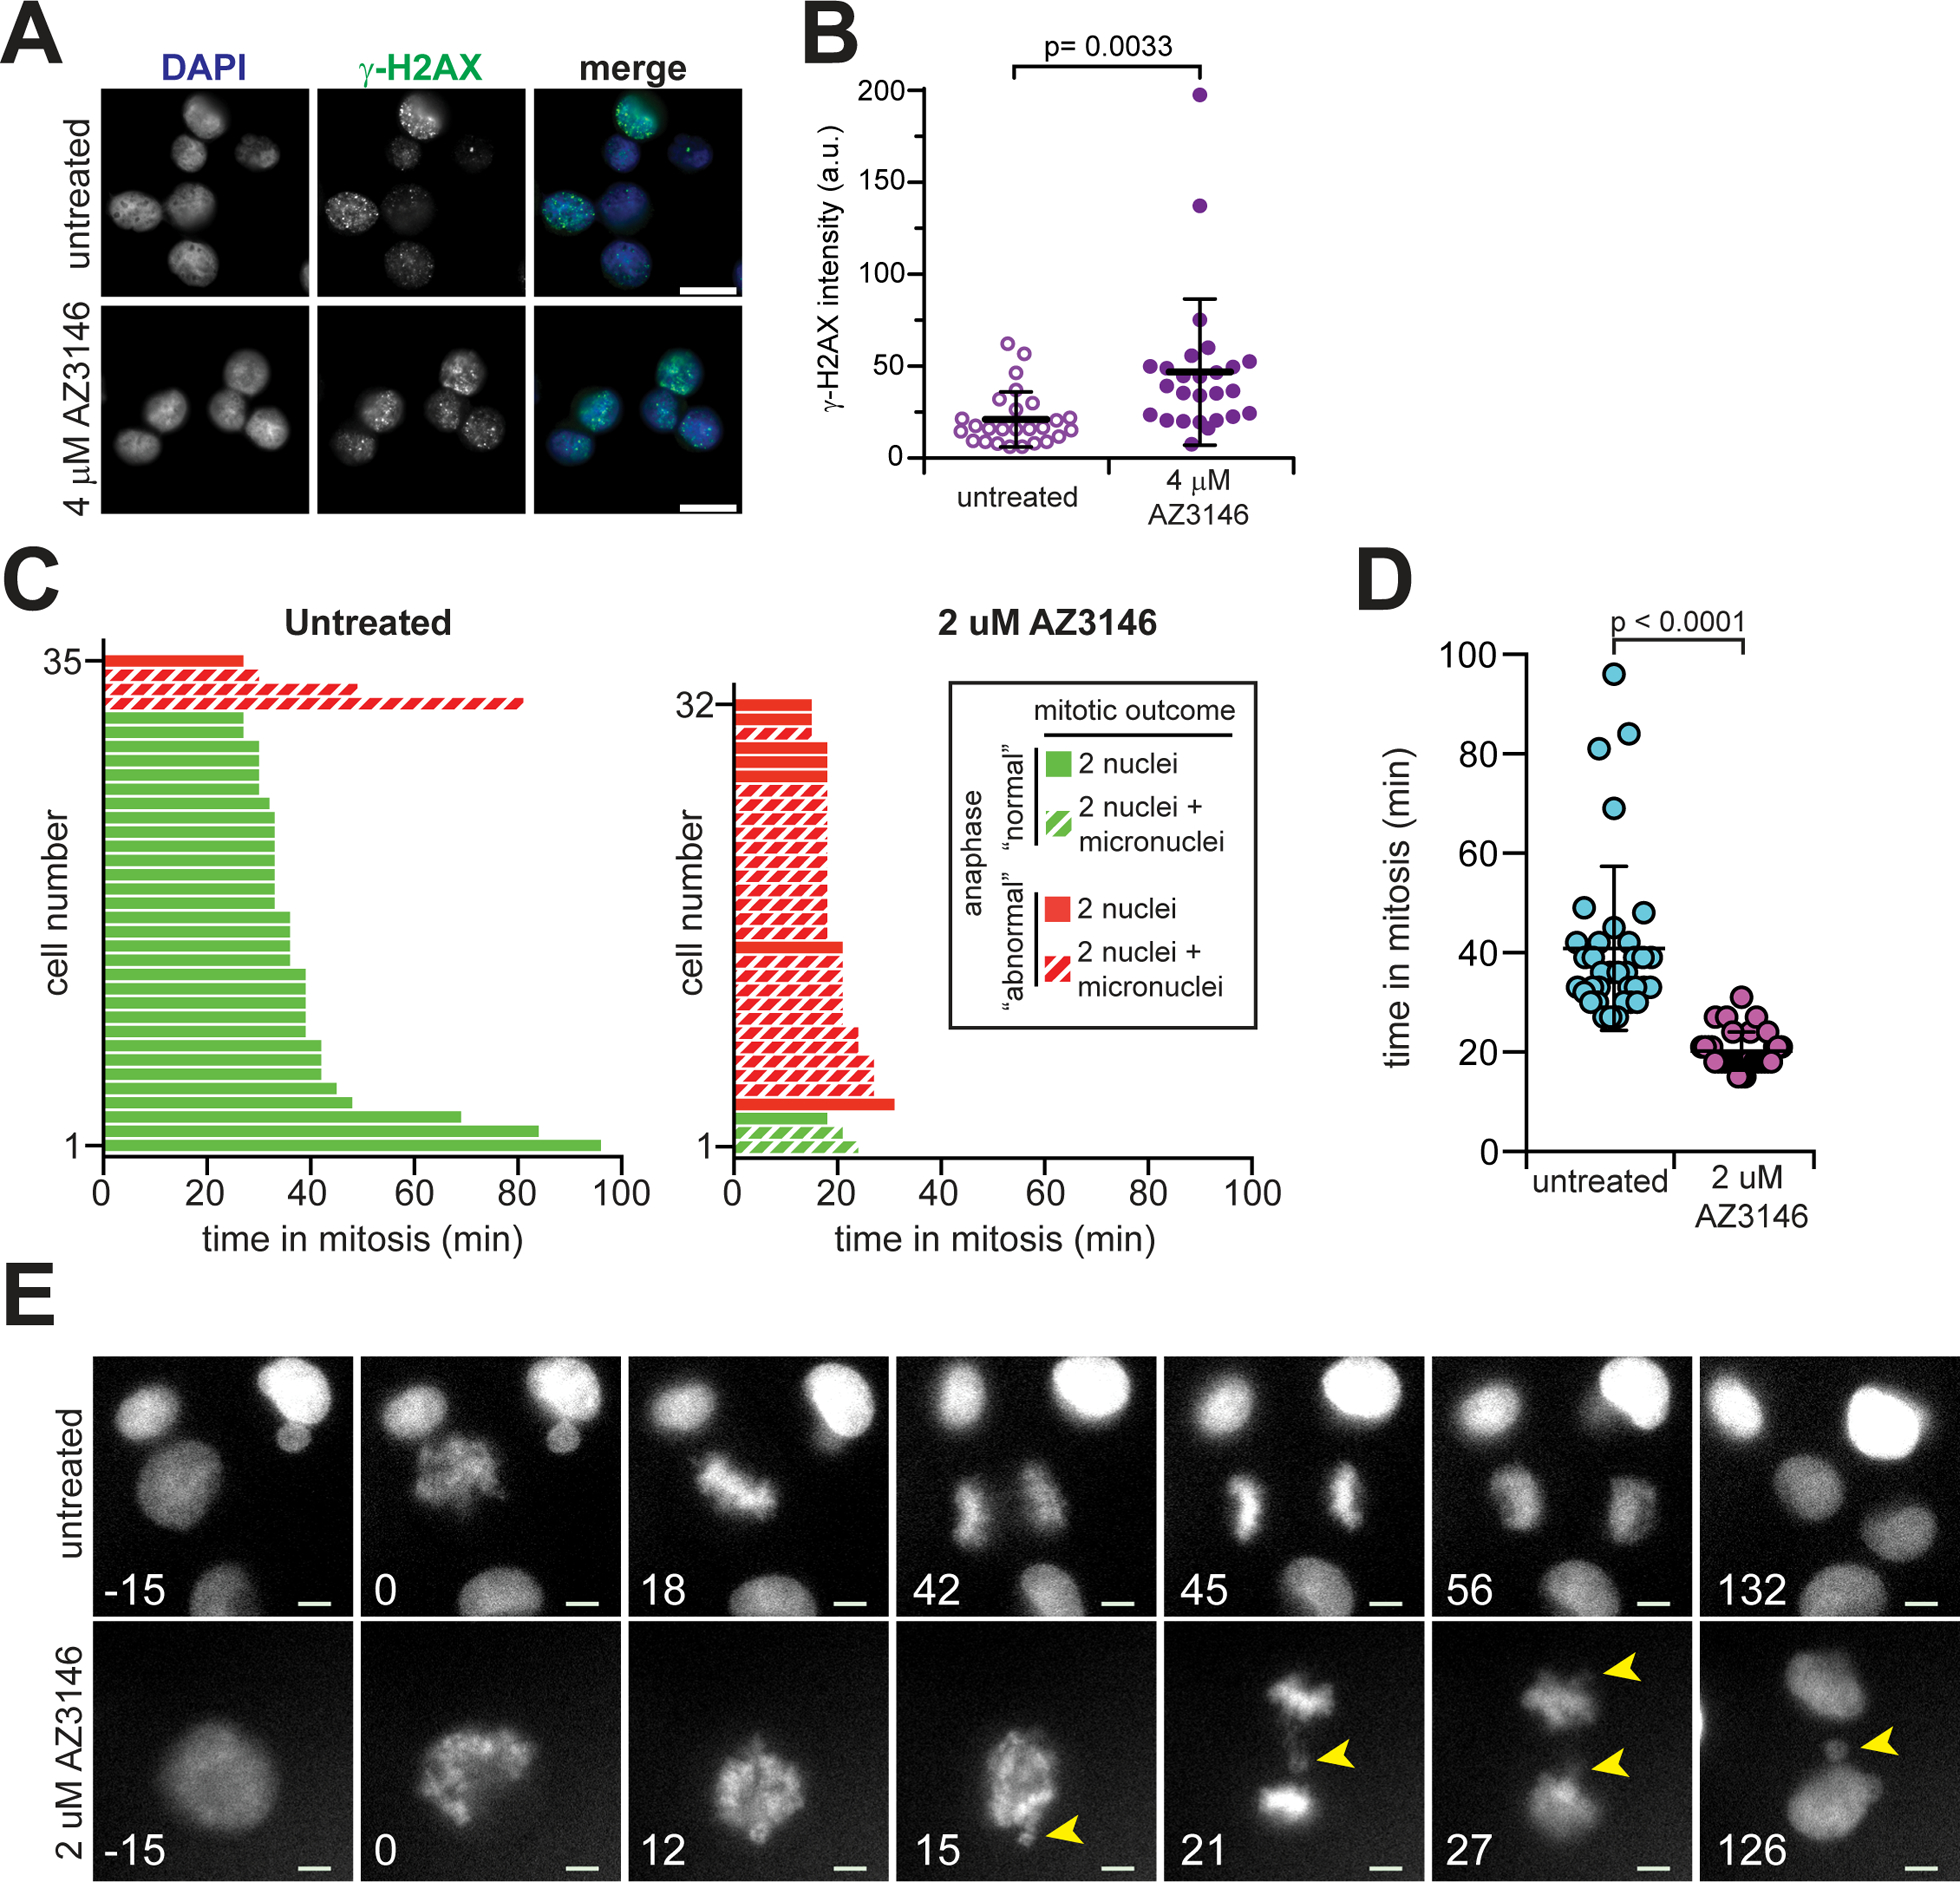
AZ3146 generates lagging chromosomes followed by micronuclei and DNA damage in AML cells. (A) Representative image for immunofluorescence staining of γ-H2AX in thymidine-synchronized K562 cells challenged with or without 4μM AZ3146 for 24 h. Scale bar, 20 μm. (B) Graph represents average γ-H2AX intensity (+/− SD) from (A). Each dot represents a cell (n=28 cells from one experiment). Significance determined by two-tailed Mann-Whitney test. (C-E) Live cell imaging of K562 cells reveals Mps1 inhibition causes chromosome mis-segregation during mitosis, resulting in interphase micronuclei. (C) Graph of mitotic events from individual cells during live cell imaging. K562 cells stably expressing H2B-mScarlet were imaged every 3 min without or with 2 μM AZ3146. Time in mitosis, anaphase events (“normal” segregation or presence of misaligned/lagging chromosomes- “abnormal”), and mitotic outcome (division resulting in 2 nuclei or 2 nuclei + micronuclei) were recorded. (D) Graph indicates average time in mitosis (+/− SD) of cells from (C). Significance determined by two-tailed Mann-Whitney test. (E) Representative images of untreated or AZ3146-treated K562 cells. Time indicated in minutes with ‘0’ representing mitotic entry. Arrowheads indicate misaligned and lagging chromosomes that result in micronuclei. Scale bar, 5 μm.
We next sought to link weakened mitotic checkpoint signaling, chromosome mis-segregation and DNA damage together. To do this, we monitored mitotic events using time-lapse video microscopy on K562 cells stably expressing H2B-mScarlet, in the presence or absence of 2μM AZ3146. We scored each mitosis for duration, presence or absence of misaligned or lagging chromosomes during anaphase, and presence or absence of micronuclei in daughter cells. Untreated K562 cells typically progressed to anaphase within 40 minutes of mitotic entry, exhibited a normal anaphase lacking misaligned or lagging chromosomes, and produced 2 daughter nuclei without additional micronuclei (Figure 3C–E, Supplementary Video 5). In contrast, K562 cells challenged with 2 μM AZ3146 typically progressed to anaphase within 20 minutes of mitotic entry, frequently exhibited misaligned or lagging chromosomes during anaphase (“abnormal”) and produced 2 daughter nuclei often accompanied by a micronucleus (Figure 3C–E, Supplementary Video 6). In a few cases, we observed resultant micronuclei from apparently normal anaphases. We interpret these findings as a failure to identify mis-segregation events with our sampling parameters during imaging. Overall, our findings are consistent with prior observations of Mps1 inhibition dramatically accelerating mitotic exit and producing mis-segregation events30. Moreover, the results link lagging or misaligned chromosomes to micronuclei formation in the ensuing interphase. Given the concomitant increase in DNA damage, we speculate that Mps1 inhibition is generating anaphase mis-segregation that leads to micronuclei formation and DNA damage, although Mps1 is also known to function in DNA repair pathways during interphase42,43.
AZ3146 activates a type I interferon response and the JAK-STAT pathway
We next tested the effect of Mps1 inhibition on innate immune response in AML cell lines. Both DNA damage16 and ruptured micronuclei14,15 activate the cytosolic DNA sensor STING (stimulator of interferon genes). STING, an adaptor protein, functions downstream of several DNA sensors, including cGAS, IFI16, and MRE11 in the setting of bacterial or viral infection44–48. Recent work has demonstrated that the DNA sensor cGAS can recognize self-DNA exposed in the cytoplasm and initiate innate immune response14,15. We did not observe increased cGAS staining in micronuclei compared with cytoplasmic background by fixed immunofluorescence after AZ3146 treatment in AML cells (data not shown).
Binding of cytoplasmic DNA to a DNA sensor triggers the synthesis of the second messenger 2’3’cGAMP, which binds to and activates STING. STING then activates transcriptional factors, such as interferon regulatory factor 3 (IRF3) and nuclear factor κB (NF-κB). The translocation of IRF3 and NF-κB into the nucleus induces interferon stimulated genes (ISGs) and elicits a type I interferon (IFN) response49. Type I IFN response can stimulate the innate immune system by activating natural killer cells, macrophages, dendritic cells and T helper 1 (Th1) cells50.
Therefore, we investigated the change in gene expression in a panel of IFNs and ISGs in AML cells in the presence AZ3146 by reverse transcription quantitative PCR (RT-qPCR). Expression of IFN-β and ISGs (IRF3, IRF7, IRF9, OAS1, OAS2, IFI16, IFI27, NLRC5) are significantly upregulated in several AML cell lines treated with 2 μM AZ3146 for 4 days (Figure 4A). Moreover, elevated p-STAT1 in K562 and THP-1 cells challenged with AZ3146 (Figure 4B) indicates activation of the JAK-STAT pathway. Combined, our results suggest global upregulation of type I IFN response and inflammatory pathway induction in response to Mps1 inhibition.
Figure 4.
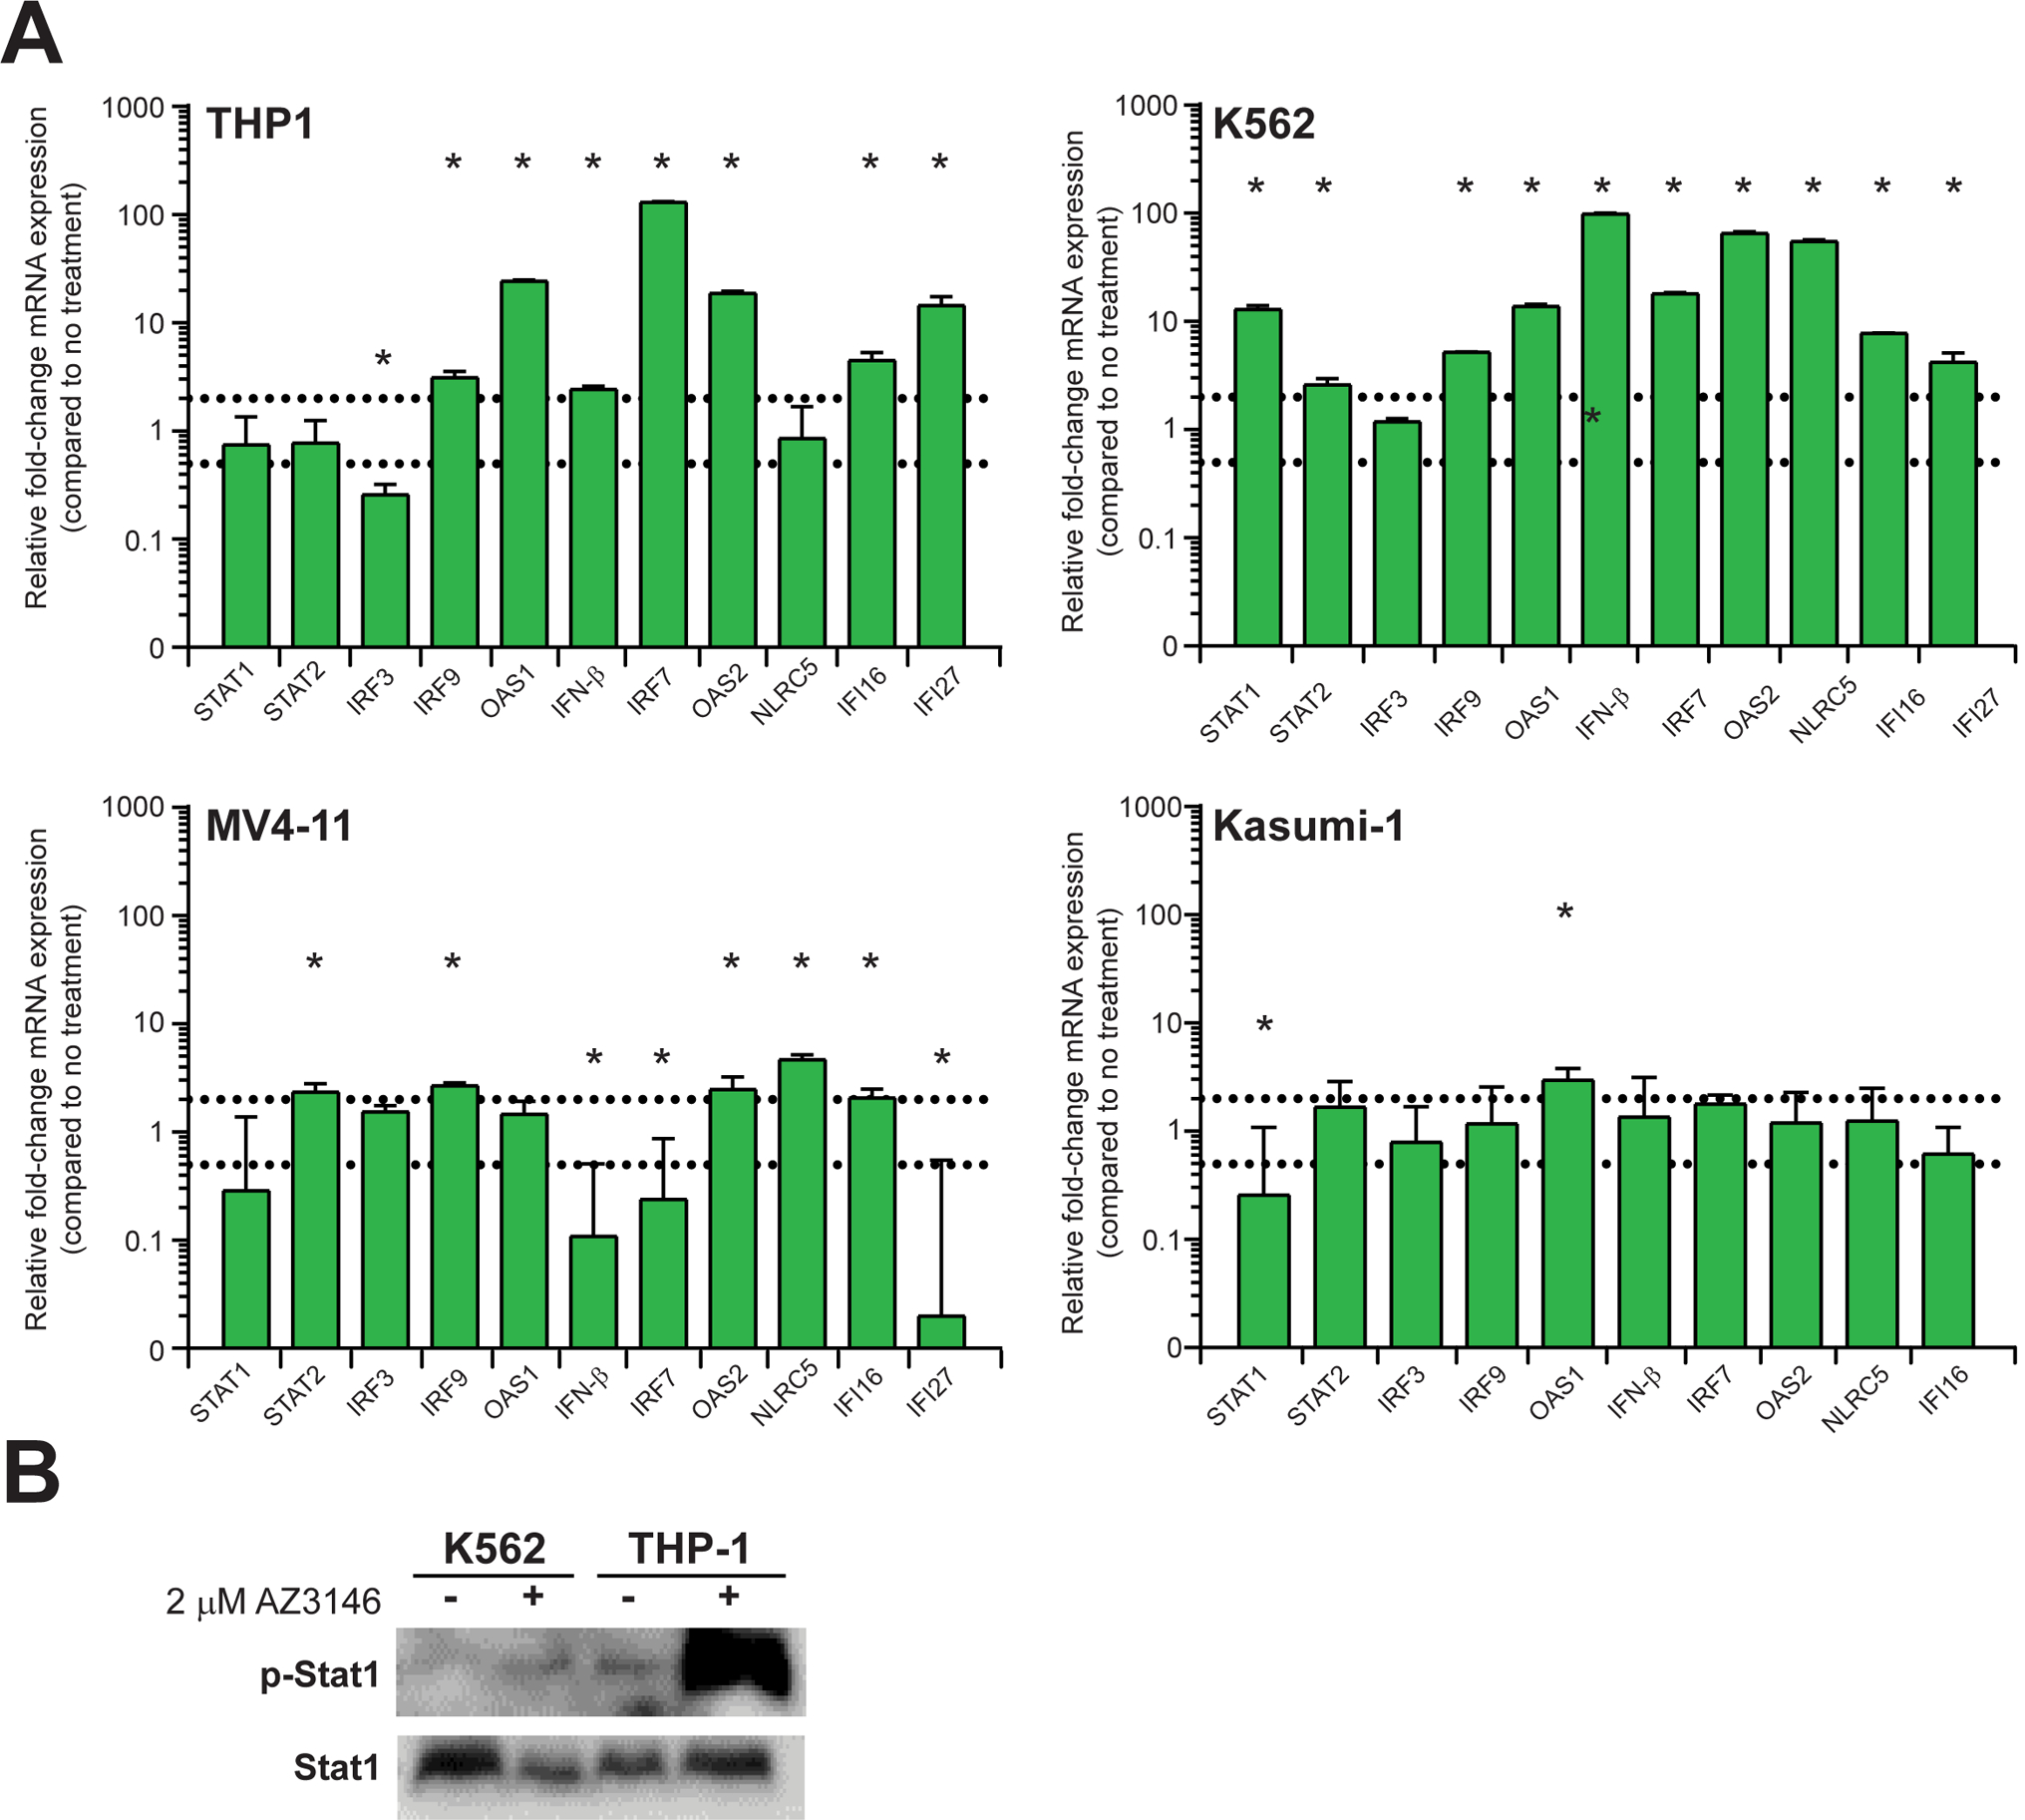
AZ3146 activates a type I interferon response and the JAK-STAT pathway. (A) Graphs represent the average relative fold-change (+/− SD) mRNA expression of selected genes in AML cells after 4 d of 2 μM AZ3146 (n= 3 independent experiments). Dashed lines indicate a 2-fold increase or decrease against untreated control cells. Asterisks indicate genes significantly upregulated or downregulated. (B) Immunoblot of phosphorylated Stat1 (p-Stat) protein expression in AML cells after 4 d with or without AZ3146.
DISCUSSION
The relationship between CIN and clinical outcome
Our findings reveal a wide range of chromosome mis-segregation frequency in AML bone marrow core biopsies. High CIN correlated with complex aneuploidy AML, as expected. Consistent with literatures, patients with complex karyotypes tend to have a shorter recurrence-free survival compared with patients with simple karyotype. However, there was no clear correlation between CIN and recurrence-free survival or overall survival in our analysis. As we know, CIN has been associated with adverse clinical outcome and linked with treatment resistance17,51. However, the relationship between CIN and prognosis is complex and may be dependent on the type of malignancy. In diffuse large B cell lymphoma, increased rates of chromosome mis-segregation correlate with inferior outcome and poor prognosis52. Conversely, high CIN is associated with improved patient outcome in ER-negative breast cancer as well as ovarian, gastric, and non-small cell lung cancer53–55. Our findings support a model of extremely high chromosome mis-segregation leads to cell death and tumor suppression, whereas low to moderate CIN promotes tumorigenesis and is associated with a poorer clinical outcome20.
One limitation to our results is the small sample size. Some specimens exhibited slower proliferative rates compared with other specimens, which were excluded from our final analysis. Fewer anaphase cells may skew the chromosome mis-segregation rate for that specific sample. It shows that there is an unmet need to develop non-biased, less labor-intensive assay to evaluate the CIN.
Chromosome mis-segregation leads to DNA damage, both during interphase and mitosis
Using low micromolar concentrations of AZ3146 to inhibit Mps1, we successfully weakened the mitotic checkpoint (Figure 2C), generating chromosome segregation errors in AML cells (Figure 2D–E, Figure 3C,E). These segregation errors frequently produced micronuclei in the resulting interphase (Figure 3C,E). Furthermore, we observed increased γ-H2AX immunofluorescence in interphase cells after Mps1 inhibition (Figure 3A–B), indicating an increase in DNA damage. Cytoplasmic double stranded DNA was shown to trigger a robust innate immune response.
Chromosomal instability is linked with DNA damage56. Mechanistically, single chromosome mis-segregation may deregulate expression of hundreds of genes critical to DNA replication and repair57,58. Replication stress can generate unreplicated or intertwined chromosomal segments as well as dicentric chromosomes, leading to anaphase chromatin bridges59,60 and further chromosomal instability. Additionally, micronuclei can undergo delayed DNA replication and replication fork stalling, with an aggregation of double-stranded DNA breaks due to replication stress59. These micronuclei may persist for several cell cycles, leading to extensive fragmentation of micronuclear DNA and chromothripsis.
Besides producing DNA damage and replication stress in G1/S interphase, impaired chromosome segregation can directly generate DNA breaks during mitosis. In Dido-null murine cells, γ-H2AX foci appear near merotelically attached kinetochores, suggesting pulling forces from merotelic attachments can tear DNA near the centromere61. During cytokinesis, furrow ingression can cause double-stranded DNA breaks to chromatin trapped in the cleavage plane10,62.
Chromosome mis-segregation and immunogenicity
In our study, chromosome mis-segregation from Mps1 inhibition generated micronuclei, and induced a robust type I interferon response (Figure 4A) in a panel of AML cell lines. Endogenous genotoxic events from radiation and chemotherapy agents can induce DNA damage, DNA replication stress or oxidative stress. DNA damage induced by loss of ataxia-telangiectasia mutated (ATM) kinase primes the type I IFN response via STING13. Several DNA sensors can act as the upstream signal to stimulate STING after double-stranded DNA transfection or microbial infection, including cGAS63, MRE1147, IFI1644,46, DNA-PK64, and DDX4165. Upon STING activation, a signaling cascade occurs and leads to induction of type I IFN and ISGs.
Of particular interest, recent data has suggested that cGAS can bind to cytoplasmic DNA upon micronuclei rupture and initiate type I IFN in tumor cells14,15. We investigated if cGAS is involved after AZ3146 treatment in AML cells, however, elevated cGAS staining above background levels is not observed in K562 and Kasumi-1 cells. It is possible that another upstream DNA sensor initiates the type I IFN response in AML cells, likely due to the different cellular context.
The type I IFN pathway in AML
We observe robust interferon gene upregulation following Mps1 inhibition in K562 and THP-1 AML cell lines, with a modest effect observed in MV4–11 cells. Recent data indicate chemotherapy agents induce type I IFNs and ISGs and stimulate immunity through transcriptional modulation in peripheral blood mononuclear cells66. Notably, tumors lacking a type I IFN response are resistant to chemotherapy, unless type I IFN is supplied67. There is a rationale for the use of type I IFN to treat AML68–70.
Type I IFNs (primarily α and β) stimulate proliferation in primary human cells, but arrest growth and/or induce apoptosis in neoplastic cells71–73. In addition, type I IFNs activate a variety of immune cells, and promote antigen presentation and improve antibody/T cell responses and soluble antigen/memory T cell responses74–76. Therefore, our study provides evidence for the immunostimulating effect of high CIN in AML.
In summary, we find that Mps1 inhibition with AZ3146 causes chromosome segregation errors and induces DNA damage and subsequent type I IFN response. Immunomodulation of IFN response in the bone marrow leukemia microenvironment remains incompletely understood, but the addition of an Mps1 inhibitor may potentiate the effects of immunotherapy in AML.
Supplementary Material
Supplementary Video 1 (.mp4). Timelapse movie of untreated K562 cell stably expressing H2B-mScarlet, imaged every 3 minutes. (companion to Supplementary Figure 2A)
Supplementary Video 2 (.mp4). Timelapse movie of K562 cell stably expressing H2B-mScarlet, challenged with 0.2 μg/ml nocodazole, imaged every 3 minutes. (companion to Supplementary Figure 2A 2A)
Supplementary Video 3 (.mp4). Timelapse movie of untreated Kasumi-1 cell stably expressing H2B-mScarlet, imaged every 3 minutes. (companion to Supplementary Figure 2A 2A)
Supplementary Video 4 (.mp4). Timelapse movie of K562 cell stably expressing H2B-mScarlet, challenged with 0.2 μg/ml nocodazole, imaged every 2 minutes. Time in minutes. (companion to Supplementary Figure 2A 2A)
Supplementary Video 5 (.mov). Timelapse movie of untreated K-562 cell stably expressing H2B-mScarlet, imaged every 3 minutes. Time in minutes. (companion to Fig. 3E)
Supplementary Video 6 (.mov). Timelapse movie of K-562 cell stably expressing H2B-mScarlet, challenged with 2 μM AZ3146, imaged every 3 minutes. Time in minutes. (companion to Fig. 3E)
Supplementary Table 1 (.docx). Patient characteristics including case number, age at diagnosis, karyotypes, gene mutation and chromosome mis-segregation frequency.
Supplementary Table 2 (.docx). Primers and annealing temperatures used for RT-qPCR.
Supplementary Table 3 (.xlsx). Chromosome analysis of K562 cells challenged for 24 h with or without 2 μM AZ3146. (companion to Figure 2C–F)
ACKNOWLEDGEMENTS
We thank Professors Emery Bresnick and David Beebe for contributing cell lines.
FUNDING SUPPORT
This work was supported by R01 CA234904 to Mark E. Burkard and Beth A. Weaver. Ning Jin was supported by a UW Hematology T32 training grant (HL007899). Jun Wan was supported by a predoctoral fellowship (16PRE29650011) from the American Heart Association. Additional support was provided through P30 CA014520.
Footnotes
CONFLICT OF INTEREST STATEMENT
M.E.B. declares the following: Medical advisory board of Strata Oncology; Research funding from Abbvie, Genentech, Puma, Arcus, Apollomics, and Loxo Oncology. The other authors declare no competing financial interests.
REFERENCES
- 1.Thompson SL, Bakhoum SF, Compton DA. Mechanisms of chromosomal instability. Curr Biol. 2010;20(6):R285–R295. [DOI] [PMC free article] [PubMed] [Google Scholar]
- 2.Funk LC, Zasadil LM, Weaver BA. Living in CIN: Mitotic Infidelity and Its Consequences for Tumor Promotion and Suppression. Dev Cell. 2016;39(6):638–652. [DOI] [PMC free article] [PubMed] [Google Scholar]
- 3.Levine MS, Holland AJ. The impact of mitotic errors on cell proliferation and tumorigenesis. Genes Dev. 2018;32(9–10):620–638. [DOI] [PMC free article] [PubMed] [Google Scholar]
- 4.Salmon ED, Cimini D, Cameron LA, DeLuca JG. Merotelic kinetochores in mammalian tissue cells. Philos Trans R Soc Lond B Biol Sci. 2005;360(1455):553–568. [DOI] [PMC free article] [PubMed] [Google Scholar]
- 5.Cimini D Merotelic kinetochore orientation, aneuploidy, and cancer. Biochim Biophys Acta. 2008;1786(1):32–40. [DOI] [PubMed] [Google Scholar]
- 6.Gregan J, Polakova S, Zhang L, Tolić-Nørrelykke IM, Cimini D. Merotelic kinetochore attachment: causes and effects. Trends Cell Biol. 2011;21(6):374–381. [DOI] [PMC free article] [PubMed] [Google Scholar]
- 7.Cimini D, Cameron LA, Salmon ED. Anaphase spindle mechanics prevent mis-segregation of merotelically oriented chromosomes. Curr Biol. 2004;14(23):2149–2155. [DOI] [PubMed] [Google Scholar]
- 8.Cimini D, Wan X, Hirel CB, Salmon ED. Aurora kinase promotes turnover of kinetochore microtubules to reduce chromosome segregation errors. Curr Biol. 2006;16(17):1711–1718. [DOI] [PubMed] [Google Scholar]
- 9.Thompson SL, Compton DA. Chromosome missegregation in human cells arises through specific types of kinetochore-microtubule attachment errors. Proc Natl Acad Sci U S A. 2011;108(44):17974–17978. [DOI] [PMC free article] [PubMed] [Google Scholar]
- 10.Janssen A, van der Burg M, Szuhai K, Kops GJPL, Medema RH. Chromosome segregation errors as a cause of DNA damage and structural chromosome aberrations. Science. 2011;333(6051):1895–1898. [DOI] [PubMed] [Google Scholar]
- 11.Crasta K, Ganem NJ, Dagher R, et al. DNA breaks and chromosome pulverization from errors in mitosis. Nature. 2012;482(7383):53–58. [DOI] [PMC free article] [PubMed] [Google Scholar]
- 12.Hatch EM, Fischer AH, Deerinck TJ, Hetzer MW. Catastrophic Nuclear Envelope Collapse in Cancer Cell Micronuclei. Cell. 2013;154(1):47–60. [DOI] [PMC free article] [PubMed] [Google Scholar]
- 13.Härtlova A, Erttmann SF, Raffi FA, et al. DNA damage primes the type I interferon system via the cytosolic DNA sensor STING to promote anti-microbial innate immunity. Immunity. 2015;42(2):332–343. [DOI] [PubMed] [Google Scholar]
- 14.Harding SM, Benci JL, Irianto J, Discher DE, Minn AJ, Greenberg RA. Mitotic progression following DNA damage enables pattern recognition within micronuclei. Nature. 2017;548(7668):466–470. [DOI] [PMC free article] [PubMed] [Google Scholar]
- 15.Mackenzie KJ, Carroll P, Martin C-A, et al. cGAS surveillance of micronuclei links genome instability to innate immunity. Nature. 2017;548(7668):461–465. [DOI] [PMC free article] [PubMed] [Google Scholar]
- 16.Dunphy G, Flannery SM, Almine JF, et al. Non-canonical Activation of the DNA Sensing Adaptor STING by ATM and IFI16 Mediates NF-κB Signaling after Nuclear DNA Damage. Mol Cell. 2018;71(5):745–760.e5. [DOI] [PMC free article] [PubMed] [Google Scholar]
- 17.Schoch C, Kern W, Kohlmann A, Hiddemann W, Schnittger S, Haferlach T. Acute myeloid leukemia with a complex aberrant karyotype is a distinct biological entity characterized by genomic imbalances and a specific gene expression profile. Genes Chromosomes Cancer. 2005;43(3):227–238. [DOI] [PubMed] [Google Scholar]
- 18.Weaver BAA, Silk AD, Montagna C, Verdier-Pinard P, Cleveland DW. Aneuploidy acts both oncogenically and as a tumor suppressor. Cancer Cell. 2007;11(1):25–36. [DOI] [PubMed] [Google Scholar]
- 19.Janssen A, Geert JP, Medema RH. Elevating the frequency of chromosome mis-segregation as a strategy to kill tumor cells. Proceedings of the National Academy of Sciences. 2009;106(45):19108–19113. [DOI] [PMC free article] [PubMed] [Google Scholar]
- 20.Silk AD, Zasadil LM, Holland AJ, Vitre B, Cleveland DW, Weaver BA. Chromosome missegregation rate predicts whether aneuploidy will promote or suppress tumors. Proceedings of the National Academy of Sciences. 2013;110(44):E4134–E4141. [DOI] [PMC free article] [PubMed] [Google Scholar]
- 21.Rowald K, Mantovan M, Passos J, et al. Negative Selection and Chromosome Instability Induced by Mad2 Overexpression Delay Breast Cancer but Facilitate Oncogene-Independent Outgrowth. Cell Rep. 2016;15(12):2679–2691. [DOI] [PMC free article] [PubMed] [Google Scholar]
- 22.van Jaarsveld RH, Kops GJPL. Difference Makers: Chromosomal Instability versus Aneuploidy in Cancer. Trends Cancer Res. 2016;2(10):561–571. [DOI] [PubMed] [Google Scholar]
- 23.Sansregret L, Vanhaesebroeck B, Swanton C. Determinants and clinical implications of chromosomal instability in cancer. Nat Rev Clin Oncol. 2018;15(3):139–150. [DOI] [PubMed] [Google Scholar]
- 24.Tighe A, Staples O, Taylor S. Mps1 kinase activity restrains anaphase during an unperturbed mitosis and targets Mad2 to kinetochores. J Cell Biol. 2008;181(6):893–901. [DOI] [PMC free article] [PubMed] [Google Scholar]
- 25.Kwiatkowski N, Jelluma N, Filippakopoulos P, et al. Small-molecule kinase inhibitors provide insight into Mps1 cell cycle function. Nat Chem Biol. 2010;6(5):359–368. [DOI] [PMC free article] [PubMed] [Google Scholar]
- 26.Jelluma N, Dansen TB, Sliedrecht T, Kwiatkowski NP, Kops GJPL. Release of Mps1 from kinetochores is crucial for timely anaphase onset. J Cell Biol. 2010;191(2):281–290. [DOI] [PMC free article] [PubMed] [Google Scholar]
- 27.Sliedrecht T, Zhang C, Shokat KM, Kops GJPL. Chemical genetic inhibition of Mps1 in stable human cell lines reveals novel aspects of Mps1 function in mitosis. PLoS One. 2010;5(4):e10251. [DOI] [PMC free article] [PubMed] [Google Scholar]
- 28.Maciejowski J, Drechsler H, Grundner-Culemann K, et al. Mps1 Regulates Kinetochore-Microtubule Attachment Stability via the Ska Complex to Ensure Error-Free Chromosome Segregation. Dev Cell. 2017;41(2):143–156.e6. [DOI] [PMC free article] [PubMed] [Google Scholar]
- 29.Colombo R, Caldarelli M, Mennecozzi M, et al. Targeting the mitotic checkpoint for cancer therapy with NMS-P715, an inhibitor of MPS1 kinase. Cancer Res. 2010;70(24):10255–10264. [DOI] [PubMed] [Google Scholar]
- 30.Hewitt L, Tighe A, Santaguida S, et al. Sustained Mps1 activity is required in mitosis to recruit O-Mad2 to the Mad1-C-Mad2 core complex. J Cell Biol. 2010;190(1):25–34. [DOI] [PMC free article] [PubMed] [Google Scholar]
- 31.Tardif KD, Rogers A, Cassiano J, et al. Characterization of the cellular and antitumor effects of MPI-0479605, a small-molecule inhibitor of the mitotic kinase Mps1. Mol Cancer Ther. 2011;10(12):2267–2275. [DOI] [PubMed] [Google Scholar]
- 32.Tannous BA, Kerami M, Van der Stoop PM, et al. Effects of the selective MPS1 inhibitor MPS1-IN-3 on glioblastoma sensitivity to antimitotic drugs. J Natl Cancer Inst. 2013;105(17):1322–1331. [DOI] [PMC free article] [PubMed] [Google Scholar]
- 33.Faisal A, Mak GWY, Gurden MD, et al. Characterisation of CCT271850, a selective, oral and potent MPS1 inhibitor, used to directly measure in vivo MPS1 inhibition vs therapeutic efficacy. Br J Cancer. 2017;116(9):1166–1176. [DOI] [PMC free article] [PubMed] [Google Scholar]
- 34.Livak KJ, Schmittgen TD. Analysis of relative gene expression data using real-time quantitative PCR and the 2(-Delta Delta C(T)) Method. Methods. 2001;25(4):402–408. [DOI] [PubMed] [Google Scholar]
- 35.McGowan-Jordan J. ISCN 2016: An International System for Human Cytogenomic Nomenclature (2016): Recommendations of the International Standing Committee on Human Cytogenomic Nomenclature Including New Sequence-Based Cytogenetic Nomenclature Developed in Collaboration with the Human Genome Variation Society (HGVS) Sequence Variant Description Working Group. Karger; 2016. [Google Scholar]
- 36.McGranahan N, Burrell RA, Endesfelder D, Novelli MR, Swanton C. Cancer chromosomal instability: therapeutic and diagnostic challenges. EMBO Rep. 2012;13(6):528–538. [DOI] [PMC free article] [PubMed] [Google Scholar]
- 37.Maguire O, Wallace PK, Minderman H. Fluorescent In Situ Hybridization in Suspension by Imaging Flow Cytometry. Methods Mol Biol. 2016;1389:111–126. [DOI] [PMC free article] [PubMed] [Google Scholar]
- 38.Ganem NJ, Pellman D. Linking abnormal mitosis to the acquisition of DNA damage. J Cell Biol. 2012;199(6):871–881. [DOI] [PMC free article] [PubMed] [Google Scholar]
- 39.Guerrero A, Martínez-A C, van Wely KHM. Merotelic attachments and non-homologous end joining are the basis of chromosomal instability. Cell Div. 2010;5(1):13. [DOI] [PMC free article] [PubMed] [Google Scholar]
- 40.Giunta S, Belotserkovskaya R, Jackson SP. DNA damage signaling in response to double-strand breaks during mitosis. J Cell Biol. 2010;190(2):197–207. [DOI] [PMC free article] [PubMed] [Google Scholar]
- 41.Giunta S, Jackson SP. Give me a break, but not in mitosis: the mitotic DNA damage response marks DNA double-strand breaks with early signaling events. Cell Cycle. 2011;10(8):1215–1221. [DOI] [PMC free article] [PubMed] [Google Scholar]
- 42.Wei J-H, Chou Y-F, Ou Y-H, et al. TTK/hMps1 participates in the regulation of DNA damage checkpoint response by phosphorylating CHK2 on threonine 68. J Biol Chem. 2005;280(9):7748–7757. [DOI] [PubMed] [Google Scholar]
- 43.Yu Z-C, Huang Y-F, Shieh S-Y. Requirement for human Mps1/TTK in oxidative DNA damage repair and cell survival through MDM2 phosphorylation. Nucleic Acids Res. 2016;44(3):1133–1150. [DOI] [PMC free article] [PubMed] [Google Scholar]
- 44.Unterholzner L, Keating SE, Baran M, et al. IFI16 is an innate immune sensor for intracellular DNA. Nat Immunol. 2010;11(11):997–1004. [DOI] [PMC free article] [PubMed] [Google Scholar]
- 45.Ahn J, Gutman D, Saijo S, Barber GN. STING manifests self DNA-dependent inflammatory disease. Proc Natl Acad Sci U S A. 2012;109(47):19386–19391. [DOI] [PMC free article] [PubMed] [Google Scholar]
- 46.Jakobsen MR, Bak RO, Andersen A, et al. IFI16 senses DNA forms of the lentiviral replication cycle and controls HIV-1 replication. Proc Natl Acad Sci U S A. 2013;110(48):E4571–E4580. [DOI] [PMC free article] [PubMed] [Google Scholar]
- 47.Kondo T, Kobayashi J, Saitoh T, et al. DNA damage sensor MRE11 recognizes cytosolic double-stranded DNA and induces type I interferon by regulating STING trafficking. Proc Natl Acad Sci U S A. 2013;110(8):2969–2974. [DOI] [PMC free article] [PubMed] [Google Scholar]
- 48.Watson RO, Bell SL, MacDuff DA, et al. The Cytosolic Sensor cGAS Detects Mycobacterium tuberculosis DNA to Induce Type I Interferons and Activate Autophagy. Cell Host Microbe. 2015;17(6):811–819. [DOI] [PMC free article] [PubMed] [Google Scholar]
- 49.Sun L, Wu J, Du F, Chen X, Chen ZJ. Cyclic GMP-AMP synthase is a cytosolic DNA sensor that activates the type I interferon pathway. Science. 2013;339(6121):786–791. [DOI] [PMC free article] [PubMed] [Google Scholar]
- 50.Decker T, Müller M, Stockinger S. The yin and yang of type I interferon activity in bacterial infection. Nat Rev Immunol. 2005;5(9):675–687. [DOI] [PubMed] [Google Scholar]
- 51.Duesberg P, Stindl R, Hehlmann R. Origin of multidrug resistance in cells with and without multidrug resistance genes: chromosome reassortments catalyzed by aneuploidy. Proc Natl Acad Sci U S A. 2001;98(20):11283–11288. [DOI] [PMC free article] [PubMed] [Google Scholar]
- 52.Bakhoum SF, Danilova OV, Kaur P, Levy NB, Compton DA. Chromosomal instability substantiates poor prognosis in patients with diffuse large B-cell lymphoma. Clin Cancer Res. 2011;17(24):7704–7711. [DOI] [PMC free article] [PubMed] [Google Scholar]
- 53.Birkbak NJ, Eklund AC, Li Q, et al. Paradoxical relationship between chromosomal instability and survival outcome in cancer. Cancer Res. 2011;71(10):3447–3452. [DOI] [PMC free article] [PubMed] [Google Scholar]
- 54.Roylance R, Endesfelder D, Gorman P, et al. Relationship of extreme chromosomal instability with long-term survival in a retrospective analysis of primary breast cancer. Cancer Epidemiol Biomarkers Prev. 2011;20(10):2183–2194. [DOI] [PMC free article] [PubMed] [Google Scholar]
- 55.Jamal-Hanjani M, A’Hern R, Birkbak NJ, et al. Extreme chromosomal instability forecasts improved outcome in ER-negative breast cancer: a prospective validation cohort study from the TACT trial. Ann Oncol. 2015;26(7):1340–1346. [DOI] [PubMed] [Google Scholar]
- 56.Santaguida S, Richardson A, Iyer DR, et al. Chromosome Mis-segregation Generates Cell-Cycle-Arrested Cells with Complex Karyotypes that Are Eliminated by the Immune System. Dev Cell. 2017;41(6):638–651.e5. [DOI] [PMC free article] [PubMed] [Google Scholar]
- 57.Williams BR, Prabhu VR, Hunter KE, et al. Aneuploidy affects proliferation and spontaneous immortalization in mammalian cells. Science. 2008;322(5902):703–709. [DOI] [PMC free article] [PubMed] [Google Scholar]
- 58.Stingele S, Stoehr G, Peplowska K, Cox J, Mann M, Storchova Z. Global analysis of genome, transcriptome and proteome reveals the response to aneuploidy in human cells. Mol Syst Biol. 2012;8:608. [DOI] [PMC free article] [PubMed] [Google Scholar]
- 59.Xu B, Sun Z, Liu Z, et al. Replication stress induces micronuclei comprising of aggregated DNA double-strand breaks. PLoS One. 2011;6(4):e18618. [DOI] [PMC free article] [PubMed] [Google Scholar]
- 60.Gelot C, Magdalou I, Lopez BS. Replication stress in Mammalian cells and its consequences for mitosis. Genes. 2015;6(2):267–298. [DOI] [PMC free article] [PubMed] [Google Scholar]
- 61.Guerrero AA, Gamero MC, Trachana V, et al. Centromere-localized breaks indicate the generation of DNA damage by the mitotic spindle. Proc Natl Acad Sci U S A. 2010;107(9):4159–4164. [DOI] [PMC free article] [PubMed] [Google Scholar]
- 62.Hoffelder DR, Luo L, Burke NA, Watkins SC, Gollin SM, Saunders WS. Resolution of anaphase bridges in cancer cells. Chromosoma. 2004;112(8):389–397. [DOI] [PubMed] [Google Scholar]
- 63.Li X-D, Wu J, Gao D, Wang H, Sun L, Chen ZJ. Pivotal roles of cGAS-cGAMP signaling in antiviral defense and immune adjuvant effects. Science. 2013;341(6152):1390–1394. [DOI] [PMC free article] [PubMed] [Google Scholar]
- 64.Ferguson BJ, Mansur DS, Peters NE, Ren H, Smith GL. DNA-PK is a DNA sensor for IRF-3-dependent innate immunity. Elife. 2012;1:e00047. [DOI] [PMC free article] [PubMed] [Google Scholar]
- 65.Zhang Z, Yuan B, Bao M, Lu N, Kim T, Liu Y-J. The helicase DDX41 senses intracellular DNA mediated by the adaptor STING in dendritic cells. Nat Immunol. 2011;12(10):959–965. [DOI] [PMC free article] [PubMed] [Google Scholar]
- 66.Moschella F, Torelli GF, Valentini M, et al. Cyclophosphamide induces a type I interferon-associated sterile inflammatory response signature in cancer patients’ blood cells: implications for cancer chemoimmunotherapy. Clin Cancer Res. 2013;19(15):4249–4261. [DOI] [PubMed] [Google Scholar]
- 67.Sistigu A, Yamazaki T, Vacchelli E, et al. Cancer cell-autonomous contribution of type I interferon signaling to the efficacy of chemotherapy. Nat Med. 2014;20(11):1301–1309. [DOI] [PubMed] [Google Scholar]
- 68.Berneman ZN, Anguille S, Van Marck V, Schroyens WA, Van Tendeloo VF. Induction of complete remission of acute myeloid leukaemia by pegylated interferon-alpha-2a in a patient with transformed primary myelofibrosis. Br J Haematol. 2010;149(1):152–155. [DOI] [PubMed] [Google Scholar]
- 69.Anguille S, Lion E, Willemen Y, Van Tendeloo VFI, Berneman ZN, Smits ELJM. Interferon-α in acute myeloid leukemia: an old drug revisited. Leukemia. 2011;25(5):739–748. [DOI] [PubMed] [Google Scholar]
- 70.Smits ELJM, Anguille S, Berneman ZN. Interferon α may be back on track to treat acute myeloid leukemia. Oncoimmunology. 2013;2(4):e23619. [DOI] [PMC free article] [PubMed] [Google Scholar]
- 71.Thyrell L, Erickson S, Zhivotovsky B, et al. Mechanisms of Interferon-alpha induced apoptosis in malignant cells. Oncogene. 2002;21(8):1251–1262. [DOI] [PubMed] [Google Scholar]
- 72.Gomez D, Reich NC. Stimulation of primary human endothelial cell proliferation by IFN. J Immunol. 2003;170(11):5373–5381. [DOI] [PubMed] [Google Scholar]
- 73.Takaoka A, Hayakawa S, Yanai H, et al. Integration of interferon-alpha/beta signalling to p53 responses in tumour suppression and antiviral defence. Nature. 2003;424(6948):516–523. [DOI] [PubMed] [Google Scholar]
- 74.Tough DF, Kamath AT. Interferon with dendritic cells? Nat Immunol. 2001;2(12):1098–1100. [DOI] [PubMed] [Google Scholar]
- 75.Tudor D, Riffault S, Carrat C, Lefèvre F, Bernoin M, Charley B. Type I IFN modulates the immune response induced by DNA vaccination to pseudorabies virus glycoprotein C. Virology. 2001;286(1):197–205. [DOI] [PubMed] [Google Scholar]
- 76.Prchal M, Pilz A, Simma O, et al. Type I interferons as mediators of immune adjuvants for T- and B cell-dependent acquired immunity. Vaccine. 2009;27 Suppl 6:G17–G20. [DOI] [PubMed] [Google Scholar]
Associated Data
This section collects any data citations, data availability statements, or supplementary materials included in this article.
Supplementary Materials
Supplementary Video 1 (.mp4). Timelapse movie of untreated K562 cell stably expressing H2B-mScarlet, imaged every 3 minutes. (companion to Supplementary Figure 2A)
Supplementary Video 2 (.mp4). Timelapse movie of K562 cell stably expressing H2B-mScarlet, challenged with 0.2 μg/ml nocodazole, imaged every 3 minutes. (companion to Supplementary Figure 2A 2A)
Supplementary Video 3 (.mp4). Timelapse movie of untreated Kasumi-1 cell stably expressing H2B-mScarlet, imaged every 3 minutes. (companion to Supplementary Figure 2A 2A)
Supplementary Video 4 (.mp4). Timelapse movie of K562 cell stably expressing H2B-mScarlet, challenged with 0.2 μg/ml nocodazole, imaged every 2 minutes. Time in minutes. (companion to Supplementary Figure 2A 2A)
Supplementary Video 5 (.mov). Timelapse movie of untreated K-562 cell stably expressing H2B-mScarlet, imaged every 3 minutes. Time in minutes. (companion to Fig. 3E)
Supplementary Video 6 (.mov). Timelapse movie of K-562 cell stably expressing H2B-mScarlet, challenged with 2 μM AZ3146, imaged every 3 minutes. Time in minutes. (companion to Fig. 3E)
Supplementary Table 1 (.docx). Patient characteristics including case number, age at diagnosis, karyotypes, gene mutation and chromosome mis-segregation frequency.
Supplementary Table 2 (.docx). Primers and annealing temperatures used for RT-qPCR.
Supplementary Table 3 (.xlsx). Chromosome analysis of K562 cells challenged for 24 h with or without 2 μM AZ3146. (companion to Figure 2C–F)