Abstract
Pneumonia, an acute respiratory infection, causes serious breathing hindrance by damaging lung/s. Recovery of pneumonia patients depends on the early diagnosis of the disease and proper treatment. This paper proposes an ensemble method-based pneumonia diagnosis from Chest X-ray images. The deep Convolutional Neural Networks (CNNs)—CheXNet and VGG-19 are trained and used to extract features from given X-ray images. These features are then ensembled for classification. To overcome data irregularity problem, Random Under Sampler (RUS), Random Over Sampler (ROS) and Synthetic Minority Oversampling Technique (SMOTE) are applied on the ensembled feature vector. The ensembled feature vector is then classified using several Machine Learning (ML) classification techniques (Random Forest, Adaptive Boosting, K-Nearest Neighbors). Among these methods, Random Forest got better performance metrics than others on the available standard dataset. Comparison with existing methods shows that the proposed method attains improved classification accuracy, AUC values and outperforms all other models providing 98.93% accurate prediction. The model also exhibits potential generalization capacity when tested on different dataset. Outcomes of this study can be great to use for pneumonia diagnosis from chest X-ray images.
Keywords: Convolutional neural network, Ensemble method, Machine learning, Pneumonia, SMOTE, AUC
Introduction
Pneumonia is an infection in one or both lungs in which lungs’ alveoli may fill up with fluid or pus causing cough, fever or making it difficult to breathe. It is the major cause of morbidity and mortality for infants under 2 years old and people over 60 years old in many countries. Every year in the US alone, more than 250,000 people are hospitalized and around 50,000 die [1]. Pneumonia causes death of more than 800,000 children where the death toll was more than the sum of malaria, AIDS and measles [2, 3]. According to a study, conducted by a UK based NGO in India [4], around 4 million people could have been saved if appropriate actions were taken. Thus, early and accurate diagnosis and treatment of pneumonia is of utmost important. Different diagnosing methods of pneumonia are blood test, chest radiograph, lung ultrasound, CT scan, pulse oximetry and bronchoscopy [5].
The advances in artificial intelligence (AI) specially Machine Learning (ML) and Deep Learning (DL) algorithms have made robust improvement in automatic diagnosis of diseases. The Computer Aided Diagnosis (CAD) tool makes disease detection and prediction task easier, cheaper and more accessible. The CAD may be referred to a diagnosis made by a radiologist considering the results obtained through computer analysis [6]. CAD methods using Deep Convolutional Neural Network (CNN) and ML are now using in successful diagnosis of lung diseases- lung cancer, pneumonia, covid-19, tuberculosis, breast cancer, colon cancer, prostate cancer, coronary artery disease, congenital heart defects, brain diseases, skin lesions etc. Chest X-ray is one of the most commonly used painless and non-invasive radiological tests to screen and diagnose many lung diseases also other methods such as CT and MRI can be used [7]. As Chest X-ray is fast, easy and inexpensive than CT and MRI, they are mostly used in emergency diagnosis and treatment of lungs, hearts and chest wall diseases.
CheXNet is a 121-layer convolutional neural network model proposed by some researchers of Stanford University to diagnose pneumonia. The model is trained on ChestX-ray14 dataset and diagnose all the 14 pathologies of the dataset with best results [8]. VGG-19 is a 19-layer trained Convolutional Neural Network invented by Visual Geometry Group of Oxford University. This CNN architecture contains 16 convolutional layers and 3 fully connected layers.
This paper proposed an ensemble technique of two CNN models-fine-tuned CheXNet and VGG-19 models for the diagnosis of pediatric pneumonia from Chest X-ray images. The kermany dataset [9] of 5856 chest X-ray images are used here for this purpose. CNN features from the two models are collected and ensembled. The number of Pneumonia and Normal images are not same in the dataset. So, to level the dataset Random Under Sampler (RUS), Random Over Sampling (ROS), and SMOTE over sampling techniques are applied on the ensembled features. For the detection and classification of Pneumonia from Normal images different ML algorithms—Random Forest (RF), Adaptive Boosting (AdaBoost), K-Nearest Neighbors (KNN) are applied on the features afterword’s. Among the Models RF achieves the best classification accuracy of almost 99%.
The rest of the paper is organized as follows. Related works are mentioned in “Related Works” section. The proposed method of this paper is described in “Proposed Methodology” section. “Results and Discussion” section describes and discusses the results. Finally, last but not least conclusion and future work of this research can be found in “Conclusion” section.
Related Works
This section highlights the studies or works done by other researchers related to this research. Modern technology has made diagnosis and treatment easier and more convenient than before. The availability of large datasets and unbeatable success of deep learning has made diagnosis task more accurate.
Authors of Ref. [5], mentioned that, due to pneumonia at least 2500 children die every day and it is the leading cause of children death. Rudan et al. [10], shared that on an annual basis more than 150 million people get infected with pneumonia especially children under 5 years old. Lobar pneumonia, pulmonary tuberculosis and lung cancer, these three types of diseases are discriminated from chest X-ray by authors of Ref. [11] on their paper. Ghimire et al. [12] indicated that influenza was the cause in 10% of all childhood pneumonia and 28% of all children with influenza developed pneumonia in Bangladesh. The rate of pneumonia affected children is seen more to poor family with unhygienic livelihood than economically stable families. For successful diagnosis of pneumonia various deep learning CNN models have already been developed and still developing to get more accurate results.
Chest X-ray is easy to use medical imaging and diagnostic technique performed by expert radiologists to diagnose pneumonia, tuberculosis, interstitial lung disease, and early lung cancer [13]. Stephen et al. [14]. proposed a deep learning method on their research for pneumonia classification. PneumoCAD is a Computer Aided Diagnosis system developed by Ref. [15] that uses handcrafted features to diagnose pediatric pneumonia from chest X-ray images. Vamsha Deepa et al. [5], proposed a feature extraction method that classify normal lungs and pneumonia infected lungs from X-ray images. The method extracts haralick texture features of X-rays and detect pneumonia with an accuracy of 86%. To detect clouds of pneumonia in chest X-rays, [16] used Otsu thresholding method that separates the healthy part of the lung from the pneumonia infected lungs. Based on segmentation, feature extraction and artificial neural networks [17] defined a method for the classification of lung diseases such as tuberculosis, pneumonia and lung cancer from chest radiographs. GLCM features, Haralick features and Congruency parameter are used by some authors for pneumonia detection. In Rapid Childhood Pneumonia Diagnosis, Wavelet augmented analysis is used by Ref. [18] for the cough sound while Ref. [19] proposed a deep convolutional neural network with transfer learning for detecting pneumonia on chest X-rays. For pediatric pneumonia diagnosis a transfer learning method with deep residual network is proposed by Ref. [7].
The National Institutes of Health (NIH) CXR dataset released by Ref. [20] is comprised of 112,120 frontal CXRs, individually labeled to include up to 14 different diseases. For creating these labels from the associated radiological reports, the authors used Natural Language Processing to text-mine disease classifications whose expected accuracy is more than 90%. The CheXNet deep CNN model uses this NIH CXR dataset and is said to exceed the average radiologist performance on the pneumonia detection task [8]. Both VGG-19 and CheXNet image classification models accept input images of size 224 × 224. In this paper, here an ensemble of two deep CNN models (CheXNet and VGG-19) is proposed with transfer learning and fine tuning. The features collected from the ensembled models are then balanced and fed to the ML model for successful and accurate classification of Pneumonia and Non-Pneumonia (Normal) images. The proposed model is also tested on a different to dataset [21] for generalization.
Proposed Methodology
Each and every steps of the proposed methodology- from data collection to the classification of the X-Ray images is discussed here. The proposed methodology includes image preprocessing using an image enhancement technique and resizing of images, augmentation of training images, fine-tuning CNN models, model’s training, extraction of CNN’s feature vector, ensemble of extracted feature vectors, dataset imbalance handling and Pneumonia classification using different machine learning algorithms. Figure 1 shows the overall procedure of the proposed methodology.
Fig. 1.
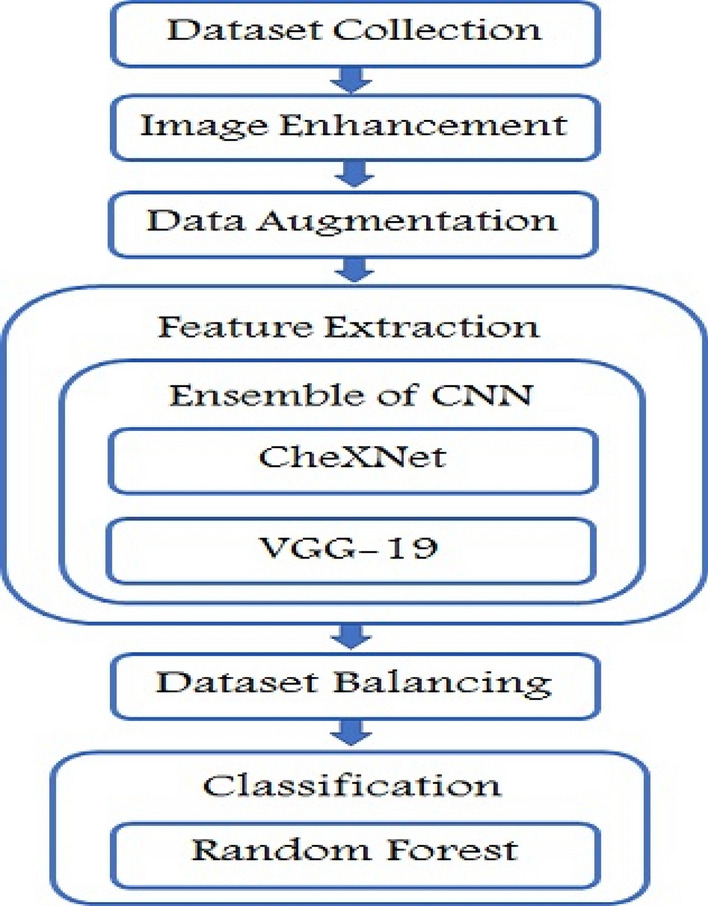
Methodological steps of pneumonia detection
Datasets
Table 1 describes the datasets used to train and evaluate the proposed method. This study uses two Kaggle datasets-one is the dataset of Ref. [9] collected from Guangzhou Women and children’s Medical Center to train, test and validate the CNN model’s performance and the other datasets is of Ref. [21] to validate the proposed method performances.
Table 1.
Description of datasets
The dataset [9] contains 5856 chest X-ray images collected by X-ray scanning of pediatric patients between 1 and 5 years old. This dataset also comes with the ground truth of each X-ray image and the data is distributed into train, validation and test folder [22]. There are 4273 images of pneumonia patients and rest are the chest X-Ray images of healthy people. The other dataset [21] named ‘COVID-19 Chest X-ray Database’ from Kaggle challenge which is the ‘Winner of the COVID-19 Dataset Award’ is used to evaluate the generalization performance of this proposed method. The dataset contains Chest X-ray images of COVID-19, Normal healthy people and Viral Pneumonia patients. There are 219 COVID-19 positive images, 1341 Normal images and 1345 Viral Pneumonia images. But as this research only focuses on the diagnosis of Pneumonia, only the Normal and Pneumonia images are selected and tested on the proposed final model.
Data Preprocessing
This section narrates the image preprocessing operations performed on the X-ray images. The preprocessing operation consists of two different tasks- image enhancement and data augmentation.
Image Enhancement
Different image enhancement techniques such as-Gabor filtering, Local binary Pattern, Histogram Equalization, Adaptive Histogram Equalization etc. are applied on the X-ray images. Among them, adaptive histogram equalization (AHE) does well in CNN based feature extraction. The AHE technique enhances the contrast of the images. To retrain a transfer learned CNN model, the X-ray images need to be rescaled as required for the transfer learned model. For training the transfer learned, fine-tuned CheXNet and VGG19 model, the images are resized to 224 × 224 size images. Besides that, the images are rescaled into 0–1 range to match input types of models.
Data Augmentation
Training deep CNN models requires an extensive amount of labeled data. A model trained with limited data may produce models that perform well on train set however fails to generalize. The obnoxious condition of overfitting to training example leads to poor performance on the test dataset. Increasing dataset size is an excellent solution to reduce this overfitting or memorization problem. Data augmentation or artificial increase of data from available data is one of the best practices to reduce overfitting in the research community. This study utilizes geometric translations of images to increase dataset size. Shearing, zooming, flipping and shifting (width shift and height shift) are the operations applied for data augmentation.
Ensemble of CNN Models
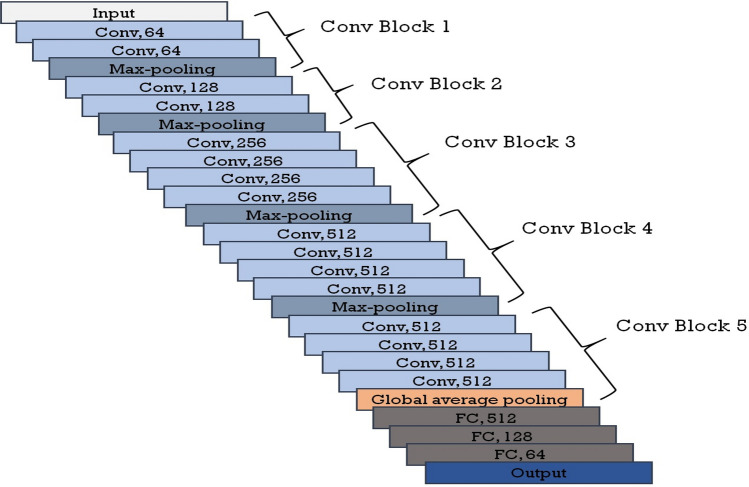
This section describes the CNN models (CheXNet and VGG-19) used for the ensemble. The CheXNet model uses pre-trained ImageNet weights and then trained on NIH Chest X-ray images while VGG-19 is pre-trained on ImageNet dataset. This paper uses the weights of retrained CheXNet model on CXR dataset. CheXNet model has a 121-layer DenseNet architecture for extracting features from images. Each dense block of the model consists of Conv layer (3 × 3 convolution), ReLU activation and Batch Normalization. Figure 2 shows the architectural design of the fine-tuned CheXNet model. The VGG-19 model consists of five blocks, and each contains few convolution layers followed by a max-pooling layer. For convolution operation, VGG-19 uses the kernel of size 3 × 3 with 64, 128, 256, 512 and 512 channels on its five convolution blocks, respectively. Figure 3 represents the architecture of the fine-tuned VGG-19 model.
Fig. 2.
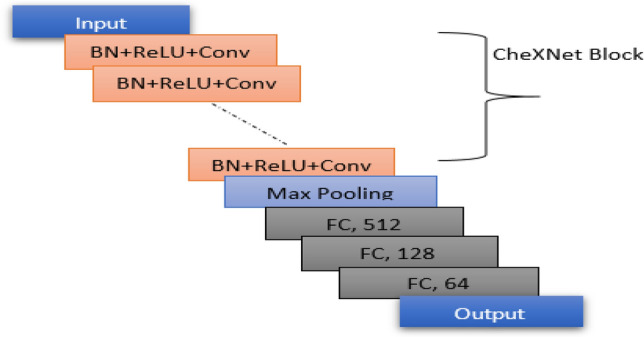
Architectural design of fine-tuned CheXNet Model
Fig. 3.
Fine-tuned VGG-19 architecture
Both of the models are fine-tuned for the detection and classification of pneumonia images. During fine-tuning, following modification are performed on the models for retraining the models using dataset [9]. For fine-tuning CheXNet, at first the neural network part of the pre-trained CheXNet model is eliminated. The redesigned new classifier part of the model uses 512, 128 and 64 neurons on its hidden dense layers. The output layer of the model has one neuron to classify images into two classes (Normal and Pneumonia). Each dense layer (except output layer) of the classifier part is followed by a dropout. Dropout reduces the capability of the model while training and guides the model during training against overfitting. The dense layer usages ReLU activation function while output layer usages sigmoid activation function for binary classification.
Fine-tuning VGG-19 includes retraining only the last convolution block of the VGG-19, while freezing the first four blocks of the model. Instead of using a flattening layer after feature extractor, this research has applied global average pooling to reduce the number of learning parameters. Both of the model usages Adam optimizer with binary cross-entropy as the loss function. Learning rate of the models is maintained based on the validation accuracy of the model. The training procedure uses learning rate decay by multiplying previous learning rate with 0.5 for every four epochs having constant validation accuracy. Afterwards, feature vector from CNN models are collected to use them for classification using other classification methods like RF, Ada-Boost, KNN etc. The feature vector for both of the CNN model is collected from the dense layer having 512 neurons in the classifier. Then, this method uses the average value of two feature vectors (feature vectors of CheXNet and VGG-19) to find an ensembled feature vector.
Dataset Balancing
A dataset with a severe skew in the distribution of data among classes is a tricky situation known as dataset imbalance. The inconsistent distribution of data may produce a biased model and perform poorly on generalization. As the dataset [9] used here contains more Pneumonia images than Normal images though the difference is not severe, it may cause the model get slightly biased towards Pneumonia image detection. Thus, as a dataset balancing technique Random Under Sampling (RUS), Random Over-Sampling (ROS) and Synthetic Minority Oversampling Technique (SMOTE) are applied on the ensembled feature vector to balance the dataset. The RUS randomly deletes images from the majority class while ROS technique increases the dataset size by reproducing the minority class data randomly and SMOTE randomly creates new minority class points by interpolating between the existing minority points and their neighbors [23]. All of the techniques create the same number of images for each class. Among the techniques ROS performs little better than the RUS and SMOTE.
Classification
The classification techniques used for pneumonia detection from the feature vector are discussed in this section. This study experimented with different ML classification methods from tree-based and non-tree-based techniques.
Random Forest uses bagging ensemble technique for classification. The RF classifier contains decision trees (DT) as a building block. Each decision tree is trained with a randomly selected samples of the dataset and these facilitates to train uncorrelated DT. Then, the output of all DTs is combined to make the final decision. Figure 4 illustrates the random forest classifier.
Fig. 4.
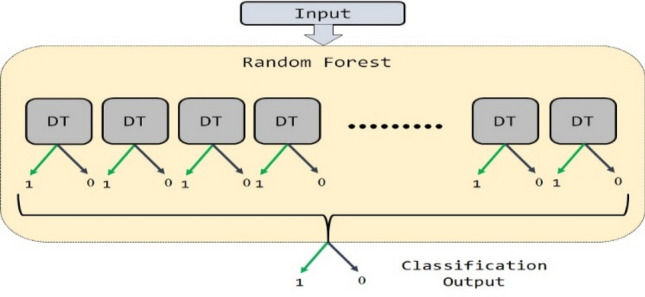
Random forest classifier
Adaptive Boosting or AdaBoost is an ensemble method that aims to creates a strong classifier from a number of weak classifiers. In AdaBoost, at first a base model is trained then other models are added which tries to correct the errors of the previous one. This research uses Logistic regression (LR), DTs and support vector machines (SVM) as the base model of AdaBoost. AdaBoost with LR works better here.
K-Nearest Neighbors is a simple supervised algorithm that can be used for both classification and regression problems. Based on a distance functions KNN classifies new cases while storing all available cases. Using 7 number of neighbors gives the best result in this research.
Among these different methods, Random Forest (RF) classifier achieved better performance than others. As, RF is an ensemble of high variance and low bias DTs where the output of each of the DT acts as a vote for the output class. Besides, ensemble of these DTs also creates a final model containing low bias and moderate variance. Thus, RF ensured here better performances than others.
Results and Discussion
This section justifies each of the steps of the proposed methodology by discussing the experimental results of each method and showing related comparison with other pneumonia detection models.
Datasets Collection and Preprocessing
Both of the two X-ray image dataset [9] and [21] are collected and preprocessed using the techniques mentioned in “Data Preprocessing” section. As training a CNN model with huge amount of data helps to make the model more accurate, generalize and robust, augmentation is applied only on the training datasets to artificially increase the size of training images, to get more different images and to resolve the overfitting problems. Moreover, the proposed method is also tested on a different dataset [21] to ensure strong generalization ability of the model. Figures 5, 6 displays the preprocessed images of dataset [9] and [21]. The images are also labeled as 0 and 1 respectively for Normal and Pneumonia images.
Fig. 5.
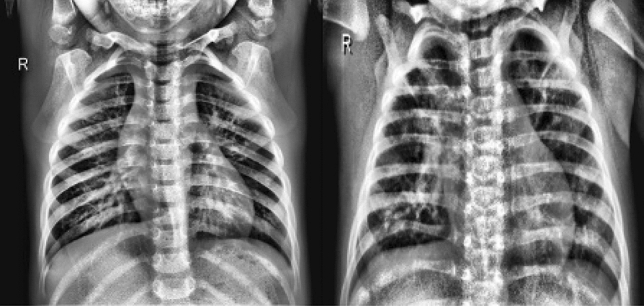
Preprocessed normal and pneumonia image of dataset [9]
Fig. 6.
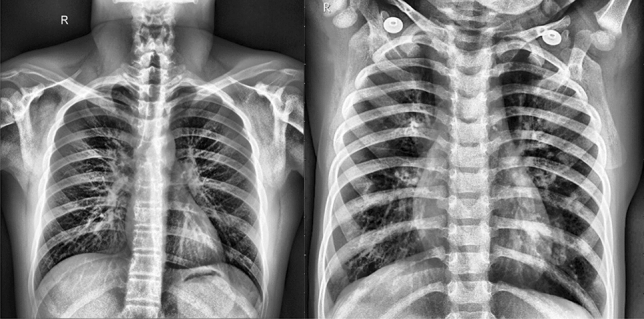
Preprocessed normal and pneumonia image of dataset [21]
Ensemble of CNN Models
The CNN models CheXNet and VGG-19 used in this research were trained using the preprocessed Chest X-ray images of size 224 × 224. Both of the model is then tested and validated on the 624 test and 16 validation images of dataset [9]. CheXNet achieves 92.63% test accuracy and 100% validation accuracy while VGG-19 obtained 89.26% and 50% test and validation accuracy on test and validation images. The ensemble of two models will help to increase the overall performances of the model. Figure 7a, b shows the validation performances of the CheXNet and VGG-19 models on the validation dataset.
Fig. 7.
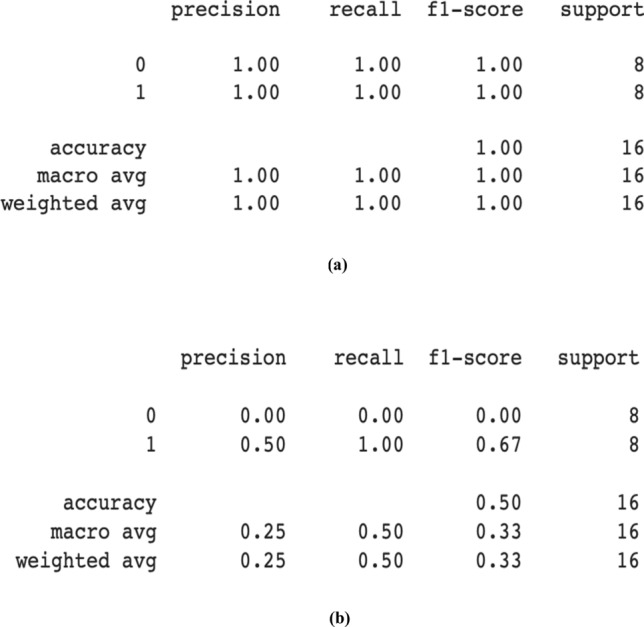
a CheXNet performance on validation dataset. b VGG-19 performance on validation dataset
The features of all the train and test images are now collected separately and combined them altogether to make a feature vector of the dataset. To make the pneumonia detection model more realistic and increase accuracy the model’s feature vectors are then ensembled. The coding part of this task is done completely in python keras framework with TensorFlow backend using google colab gpu on a mac operating system.
Dataset Balancing and Classification
The ensembled feature vector has 4265 pneumonia images and 1575 normal images. Thus, to ensure unbiased results from the classifier RUS, ROS and SMOTE data balancing techniques are applied on the feature vector. After applying RUS, there will be 1575 pneumonia images and 1575 normal images and both of ROS and SMOTE makes total 8530 images 4265 for each normal and pneumonia class. ML models such as Random Forest, AdaBoost, KNN are then applied with five-fold cross validation on the balanced dataset. Among the techniques ROS with RF performs better than other. Table 2 below shows the mean accuracy of five-fold cross validation for different ML models using different data balancing techniques.
Table 2.
Mean accuracy value of RF, AdaBoost and KNN against RUS, ROS, SMOTE
| ML models | Dataset balancing techniques | ||
|---|---|---|---|
| RUS (%) | ROS (%) | SMOTE (%) | |
| RF | 97.42 | 98.93 | 98.41 |
| AdaBoost | 96.54 | 98.53 | 98.37 |
| KNN | 97.43 | 97.53 | 97.73 |
The table shows that the best mean accuracy obtains using RF with ROS. In Table 3, comparative accuracy of RF, AdaBoost and KNN is shown for each five-fold with ROS.
Table 3.
Fold wise performances of RF, AdaBoost and KNN with ROS
| Five-fold cross validation | RF (%) | AdaBoost (%) | KNN (%) |
|---|---|---|---|
| Fold 1 | 98.83 | 98.36 | 97.54 |
| Fold 2 | 98.59 | 98.48 | 97.42 |
| Fold 3 | 98.89 | 98.59 | 97.19 |
| Fold 4 | 99.18 | 98.53 | 97.59 |
| Fold 5 | 99.18 | 98.71 | 97.89 |
| Mean | 98.93 | 98.53 | 97.53 |
In every fold, RF achieves the best classification accuracy than AdaBoost and KNN. So, RF is selected as final classifier and ROS as the data imbalance handler. And the best mean accuracy obtained by the proposed model is 98.93% or 99% approx. with 99% precision, 99% recall and 99% f-score on average.
Model Validation and Testing on Different Dataset
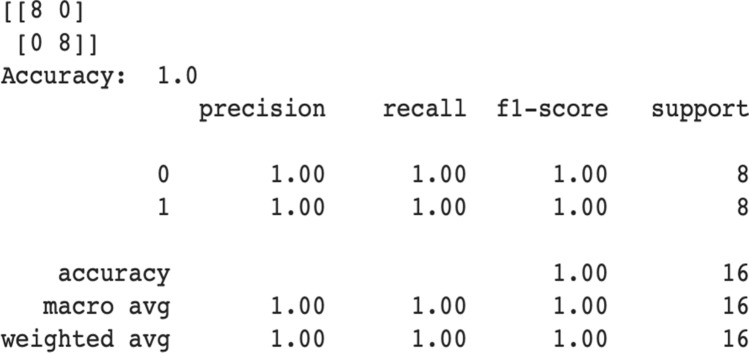
To validate the model performances again the previous 16 validation images are tested on the final proposed model which achieves 100% validation accuracy. Figure 8 displays the validation report of our final model with confusion matrix.
Fig. 8.
Proposed final model’s performance on validation dataset
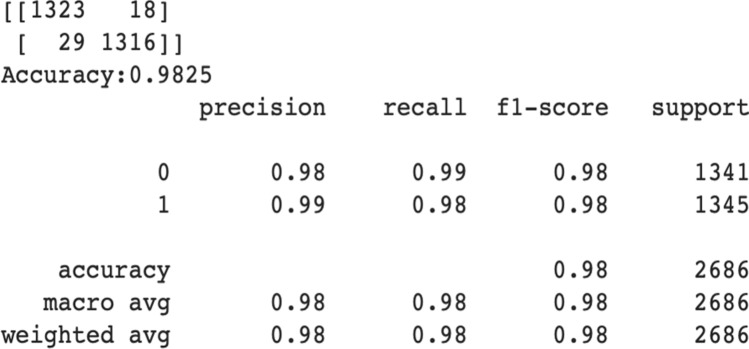
To test the model’s generalization performances a different dataset [21] is used. All of the Normal and Pneumonia images of new test dataset [21] are tested using the final model for generalization. The model achieves 98.25% generalization accuracy on this new test dataset. Figure 9 presents the model’s performance on the test dataset.
Fig. 9.
Proposed final model’s performance on new test dataset
The proposed model performance on this new dataset proves the model’s strong and appropriate generalization capability. Among the 2686 images the model successfully classifies 2639 images while only 47 images are misclassified.
Comparison with Different Models and Methods
The above discussion proved that the proposed model acts so well in diagnosing pediatric pneumonia from Chest X-rays. This section demonstrates the comparison of our model’s performances with existing models and methods. The most frequently used models for medical image classifications are VGG16, ResNet, DenseNet121, InceptionV3, Xception which achieves approximately 74–87% accuracy on Pneumonia classification. The proposed model performs much better than these models. The models proposed on paper [7, 14, 19] and paper [24] shows that their models perform better than the other existing models for pneumonia detection. Comparison of these models with proposed model is given in Table 4.
Table 4.
Comparison with existing methods for pneumonia classification on Kermany et al. [9] dataset
The comparison table clearly proves that the proposed model is the best performing Pediatric Pneumonia Classification Model. The model achieves an average AUC (Area under the ROC Curve) value of 98.94%. The two-dimensional area under the ROC curve is defined by AUC. Figure 10 shows the ROC curve (Receiver Operating Characteristic Curve) with 99% AUC area. ROC curve is a graphical representation showing the performance of a model.
Fig. 10.
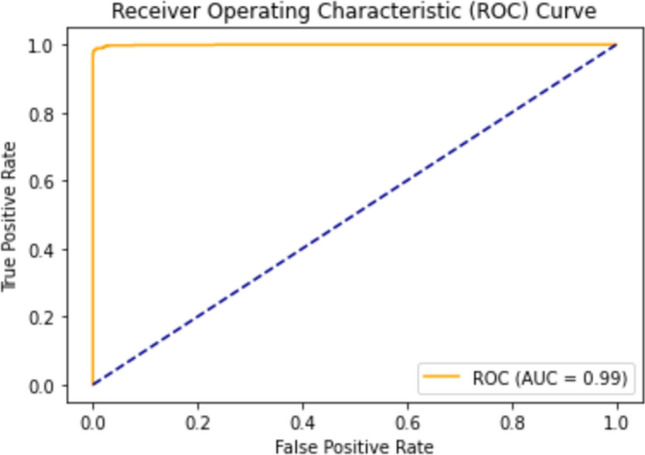
ROC curve of proposed final model
Conclusion
An automated CAD tool is presented in this paper, for the detection of childhood pneumonia from chest X-ray images. In this research a fusion of two fine-tuned CNN model is proposed which is then ensembled with ML Random Forest classifier. The proposed final model classifies pneumonia 98.93% accurately and comparing to other models provide better prediction. So, our proposed model can be referred to as one of the best Pneumonia classification models. In future, the authors will try to optimize the model to classify two or more diseases with an effective result.
Acknowledgements
The authors are grateful to the participants who contributed to this research. No financial support is provided from any organization during the research project.
Compliance with Ethical Standards
Conflict of interest
The authors declare that there is no conflict of interests regarding the publication of this work.
Footnotes
Publisher's Note
Springer Nature remains neutral with regard to jurisdictional claims in published maps and institutional affiliations.
Contributor Information
Nahida Habib, Email: nahidahabib164@yahoo.com.
Md. Mahmodul Hasan, Email: mahmodul.mbstu@gmail.com.
Md. Mahfuz Reza, Email: shuvo_06_cse@yahoo.com.
Mohammad Motiur Rahman, Email: mm73rahman@gmail.com.
References
- 1.CDC, 2017. https://www.cdc.gov/dotw/pneumonia/index.html. Accessed 22 July 2020.
- 2.Rudan I, Boschi-Pinto C, Biloglav Z, Mulholland K, Campbell H. Epidemiology and etiology of childhood pneumonia. Bull World Health Organ. 2008;86(5):408–416. doi: 10.2471/BLT.07.048769. [DOI] [PMC free article] [PubMed] [Google Scholar]
- 3.Adegbola RA. Childhood pneumonia as a global health priority and the strategic interest of the Bill & Melinda gates foundation. Clin Infect Dis. 2012;54:S89–S92. doi: 10.1093/cid/cir1051. [DOI] [PubMed] [Google Scholar]
- 4.F. Online, 17 lakh Indian children to die due to pneumonia by 2030; here’s how it can be averted. 2018. https://www.financialexpress.com/economy/17-lakh-indian-children-to-die-due-to-pneumonia-by-2030-heres-how-it-can-be-averted/1380390/.
- 5.Deepa NV, Krishna N, Kumar GH. Feature extraction and classification of X-ray lung images using haralick texture features. Singapore: Springer Nature; 2018. pp. 899–907. [Google Scholar]
- 6.Chauhan A, Chauhan D, Rout C. Role of gist and PHOG features in computer-aided diagnosis of tuberculosis without segmentation. PLoS ONE. 2014;9(11):e112980. doi: 10.1371/journal.pone.0112980. [DOI] [PMC free article] [PubMed] [Google Scholar]
- 7.Liang G, Zheng L. A transfer learning method with deep residual network for pediatric pneumonia diagnosis. Comput Methods Progr Biomed. 2020 doi: 10.1016/j.cmpb.2019.06.023. [DOI] [PubMed] [Google Scholar]
- 8.Pranav R. et al. CheXNet: Radiologist-Level Pneumonia Detection on Chest X-Rays with Deep Learning. 2017. ArXiv, arXiv:1711.05225.
- 9.Kermany DS, Goldbaum M, Cai W. Identifying medical diagnoses and treatable diseases by image-based deep learning. Cell. 2018;172(5):1122–1131. doi: 10.1016/j.cell.2018.02.010. [DOI] [PubMed] [Google Scholar]
- 10.Rudan I, Tomaskovic X, Boschi-Pinto C, Campbell H. Global estimate of the incidence of clinical pneumonia among children under five years of age. Bull World Health Organ. 2004;82(12):895–903. [PMC free article] [PubMed] [Google Scholar]
- 11.Noor NM, Rijal OM, Yunus A, Mahayiddin AA, Peng GC, Ling OE, Abu Bakar SAR. Pair-wise discrimination of some lung diseases using chest radiography, 2014 IEEE REGION 10 SYMPOSIUM. 2014. 10.1109/TENCONSpring.2014.6863015.
- 12.Ghimire M, Bhattacharya SK, Narain JP. Pneumonia in South-East Asia region: public health perspective. Indian J Med Res. 2012;135(4):459–468. [PMC free article] [PubMed] [Google Scholar]
- 13.Qin C, Yao D, Shi Y. Computer-aided detection in chest radiography based on artificial intelligence: a survey. BioMed Eng OnLine. 2018 doi: 10.1186/s12938-018-0544-y. [DOI] [PMC free article] [PubMed] [Google Scholar]
- 14.Stephen O, Sain M, Maduh UJ, Jeong D. An efficient deep learning approach to pneumonia classification in healthcare. Hindawi J Healthcare Eng. 2019 doi: 10.1155/2019/4180949. [DOI] [PMC free article] [PubMed] [Google Scholar]
- 15.Oliveira LLG, Silva SA, Ribeiro LHV, de Oliveira RM, Coelho CJ, Ana Lúcia ALS. Computer-aided diagnosis in chest radiography for detection of childhood pneumonia. Int J Med Inform. 2008;77(8):555–564. doi: 10.1016/j.ijmedinf.2007.10.010. [DOI] [PubMed] [Google Scholar]
- 16.Sharma A, Raju D, Ranjan S. Detection of pneumonia clouds in chest X-ray using image processing approach. In: 2017 Nirma University International Conference on Engineering. (NUiCONE). 2017. pp. 1–4. IEEE. 10.1109/NUICONE.2017.8325607.
- 17.Khobragade S., Tiwari A., Patil C.Y., Narke V. Automatic detection of major lung diseases using chest radiographs and classification by feed-forward artificial neural network. In: 2016 IEEE 1st International Conference on Power Electronics, Intelligent Control and Energy Systems (ICPEICES). 2016. 10.1109/ICPEICES.2016.7853683.
- 18.Kosasih K, Abeyratne UR, Swarnkar V, Triasih R. Wavelet augmented cough analysis for rapid childhood pneumonia diagnosis. IEEE Trans Biomed Eng. 2015;62(4):1185–1194. doi: 10.1109/TBME.2014.2381214. [DOI] [PubMed] [Google Scholar]
- 19.Chhikara P, Singh P, Gupta P, Bhatia T. Deep convolutional neural network with transfer learning for detecting pneumonia on chest X-rays. In: Jain L, Virvou M, Piuri V, Balas V, editors Advances in bioinformatics, multimedia, and electronics circuits and signals. Advances in intelligent systems and computing, vol 1064. Singapore: Springer; 2020. pp. 155–168. https://doi.org/10.1007/978-981-15-0339-9_13.
- 20.Wang X, Peng Y, Lu L, Lu Z, Bagheri M, Summers RM. Chest x-ray8: hospital-scale chest x-ray database and benchmarks on weakly-supervised classification and localization of common thorax diseases. In: 2017 IEEE conference on computer vision and pattern recognition (CVPR). 2017. 10.1109/CVPR.2017.369.
- 21.. Rahman T, Chowdhury DM, Khandakar A. COVID-19 Chest X-ray Database. 2020. https://www.kaggle.com/tawsifurrahman/covid19-radiography-database.
- 22.Rajaraman S, Candemir S, Thoma G, Antani S. Visualizing and explaining deep learning predictions for pneumonia detection in pediatric chest radiographs. In: Proc. SPIE 10950, Medical Imaging 2019: Computer-Aided Diagnosis. 2019. 109500S. https://doi.org/10.1117/12.2512752.
- 23.Swagatam D, Shounak D, Bidyut BC. Handling data irredularities in classification: foundations, trends, and future challenges. Pattern Recogn. 2018 doi: 10.1016/j.patcog.2018.0.008. [DOI] [Google Scholar]
- 24.Saraiva A, Ferreira N, et al. Classification of images of childhood pneumonia using convolutional neural networks, In: 6th international conference on bioimaging. 2019. pp. 112–119. BIOSTEC. 10.5220/0007404301120119.


