

Abstract
Long term electrocardiogram (ECG) signals recorded in an intensive care unit (ICU) are often corrupted by severe motion and noise artifacts (MNA), which may lead to many false alarms including inaccurate detection of atrial fibrillation (AF). We developed an automated method to detect MNA from ECG recordings in the Medical Information Mart for Intensive Care (MIMIC) III database. Since AF detection is often based on identification of irregular RR intervals derived from the QRS complexes, the main design focus of our MNA detection algorithm was to identify corrupted QRS complexes of the ECG signals. The MNA in the MIMIC III database contain not only motion-induced noise, but also a plethora of non-ECG waveforms, which must also be automatically identified. Our algorithm is designed to first discriminate between ECG and non-ECG waveforms using both time and spectral-domain properties. For the segments of data containing ECG waveforms, a time-frequency spectrum and its sub-band decomposition approach were used to identify MNA, and high frequency noise ECG segments, respectively. The algorithm was tested on data from 35 subjects in normal sinus rhythm and 25 AF subjects. The proposed method is shown to accurately discriminate between segments that contained real ECG waveforms and those that did not, even though the latter were numerous in some subjects. In addition, we found a significant reduction (> 94%) in false positive detection of AF in normal subjects when our MNA detection algorithm was used. Without using it, we inaccurately detected AF owing to the MNA.
Keywords: Atrial fibrillation, artifacts, electrocardiogram, false alarm, ICU, noise, peak, variance
I. Introduction
An intensive care unit (ICU) uses Food and Drug Administration-approved devices for monitoring various physiological signals of patients in critical condition [1]. Among the physiological signals recorded in the ICU, electrocardiogram (ECG) is one of the most important vital sign alerts, but it is also widely used for the diagnosis of cardiovascular diseases and associated arrhythmias [2]. In an ICU, the ECG is often severely corrupted by noise and motion artifacts (MNA) and may drop data due to poor electrode contact with the skin. Both can reduce the diagnosis accuracy. As a result, automated identification of poor-quality ECG signals is of paramount importance, especially when signal processing algorithms are used to screen or monitor cardiac conditions [3].
The dynamics of MNA in ECG signals can occur within the frequency band of the cardiac electrical activity, which makes the separation of true ECG signal from the undesired dynamics even more challenging [4]. Some common sources of ECG noise include, among other things, a bad electrode contact, motion artifacts, electromyography (EMG) noise, and baseline wander [5], [6].
Different approaches have been developed to detect and remove MNA from ECG signals. Some of the popular MNA removal algorithms include linear filtering [7], adaptive filtering [8], and Bayesian filtering [9]. In [10], a signal quality index (SQI) based on R-peak detection and template matching to assess reliable heart rate (HR) is presented for wearable devices. A study has used statistical moments, QRS peak detection-based parameters and a support vector machine to develop SQI [3]. An automatic ECG quality scoring method based on QRS detection and quantifying powerline noise, baseline wander, and muscular noise is described in [11]. In [12], ECG quality is estimated by exploiting the structure of the cross-covariance matrix among different leads and machine learning classifiers. In [13], PQRST complexes are segmented and averaged to form an estimate of the true PQRST complex, which is subsequently used to calculate noise power in an analysis window so that ECG signal quality can be evaluated. A threshold-based detection system using six parallel filters for some of the most common noise types is proposed in [14]. In [15], an ECG signal quality assessment method based on QRS detection, RR interval features, and a thresholding rule is used. A fusion algorithm consisting of ECG, photoplethysmogram (PPG), and arterial blood pressure (ABP)-based features to obtain SQI is described in [16]. Automatic MNA detection for Holter ECG recordings using the empirical mode decomposition (EMD) and statistical features is presented in [17]. Most recently, a complete ensemble EMD-based short-term temporal feature extraction and decision-rule algorithm is presented in [18] to detect and classify ECG noises.
Most methods are based on QRS complex detectors from which reliable and accurate R-peak detection can be obtained. However, this approach has its own limitations when there are changes in QRS morphology, tall T waves, and irregular RR intervals [18]. Machine learning-based quality assessment algorithms require a large collection of ECG data with various beat patterns [3]. Some other methods need other physiological signals, such as a photoplethysmogram (PPG) or arterial blood pressure (ABP), along with ECG. Moreover, most algorithms have been tested only on short-term data for telemedicine applications or to minimize false alarms in the ICU (Computing in Cardiology Challenges in 2011 and 2015, respectively). However, MNA detection from continuous long-term ICU ECG recordings has not been extensively evaluated.
In this study, a novel automated MNA detection method is described from long term ECG recordings taken from the Medical Information Mart for Intensive Care (MIMIC) III database. To the best of our knowledge, this is one of the first studies to develop an algorithm for automated noise detection using the MIMIC III database, which contains longitudinal ECG waveform data recorded from patients hospitalized in an ICU setting. One major application of our MNA detection algorithm is to improve atrial fibrillation (AF) detection accuracy in the MIMIC III database. Hence, the proposed algorithm was designed to detect non-ECG waveforms and any QRS complexes of the ECG that had been obscured by contamination with MNA. Our two-phase approach includes the detection of ECG waveforms in a given segment followed by the detection of MNA in those ECG-containing data segments. The first phase, identifying ECG waveforms, was necessary because many data segments of the MIMIC III database contain non-ECG waveforms. Finally, the algorithm’s performance for detection of both the non-ECG shaped signal and MNA was analyzed for both normal sinus rhythm (NSR) and AF subjects.
II. Dataset Description
The Medical Information Mart for Intensive Care (MIMIC) III dataset, collected from PhysioNet [19], was used in this study. This is a large and publicly available database comprising de-identified health-related data from approximately sixty thousand patients who stayed in critical care units of the Beth Israel Deaconess Medical Center between 2001 and 2012 [20]. The MIMIC III database includes a variety of information such as patient demographics, vital sign measurements, laboratory test results, medications, nurse and physician notes, imaging reports, and out-of-hospital mortality, which are some of the notable parameters among many others. MIMIC III links continuous ECG and PPG waveforms to a wealth of time-varying clinical and hemodynamic data. For our MNA detection study, ECG waveforms from N = 60 subjects (35 NSR and 25 AF subjects) were used for the evaluation of our algorithm. ECG signals from AF subjects were annotated by cardiologists from the University of Massachusetts Medical School. The duration of the ECG recordings varied from 6 hours to 70 hours. The sampling frequency of the ECG signals was 125 Hz and the measuring units were millivolts (mV).
III. Methods
The proposed ECG MNA detection method consists of two phases: (a) discrimination between segments that contain ECG waveforms and those that do not (b) motion and noise artifact detection from those data segments containing ECG waveforms.
A. Detection of Segments That Contain ECG Signals
Prior to MNA detection, the algorithm checks whether or not the data contain ECG waveforms. The MIMIC III data were recorded over long time periods; there were many practical problems in collecting and handling the data including missing values, stopped recordings, bad electrode contact, and other issues. As a result, there are many cases where no ECG signal exists for prolonged time periods. Hence, before we proceed with data processing, those sections without valid ECG waveforms must be identified. For our analysis, each recording is divided into a two minute segment. To detect whether a given recording segment contains ECG waveforms or not, the following steps are performed:
Step 1: As the first step, we look for the missing values (denoted by NaN). If missing values are found, that segment is discarded. Moreover, if the data segment contains zero values for more than 400 ms consecutively, that segment is also discarded, as an ECG segment should not have continuous zero value for more than a limited time [14].
Step 2: Next, we detect the segments in which ECG waveforms either suddenly disappear (e.g. due to an electrode losing contact) or in which low amplitude non-ECG waveform data are present for the entire segment. These types of non-ECG waveforms typically have a low variance for the two minute segment. In addition, we also look for short term abrupt changes in the signal amplitude by calculating variance for each one second of data for the entire two minute segment. We chose one second duration for the piecewise variance calculation of the data so that short-term abrupt low amplitude non-ECG data can be detected; the threshold for this piecewise variance was chosen to be 10−4. Fig. 1 shows sample recording segments containing abrupt amplitude changes (top panel) and low amplitude non-ECG waveforms (bottom panel). These types of segments have been successfully identified and discarded using these two procedural steps.
Fig. 1.

Sample recordings showing (a) abrupt signal change and (b) low amplitude noise.
Step 3: While there exist many recordings where the signal satisfies the previously defined two criteria, we were not able to remove all non-ECG waveforms. Fig. 2 shows a sample one minute segment which was not filtered out by the first two steps yet does not exhibit ECG waveforms. To detect this type of non-ECG waveform, the power spectral density (PSD) of the signal is computed.
Fig. 2.

A sample 1 minute recording exhibiting a non-ECG shaped signal.
The PSD is widely used in bio-signal processing and it indicates how power is distributed across different frequency bands [21], [22]. The underlying assumption for using the PSD is that ECG-shaped signals will likely show different spectral characteristics than non-ECG shaped signal segments. Specifically, we look for 4 dominant frequency peaks in the 0-5.0 Hz band in the PSD. For the ECG signal, the peaks in the upper band (2.5-5.0 Hz) represent the harmonics of the periodic QRS complexes. For the non-ECG shaped signals, harmonic frequency components in the 2.5-5.0 Hz band are not as prominent. Fig. 3 (a) shows a one minute sample ECG segment and Fig. 3 (b) shows its PSD in the 0-5 Hz frequency range where it can be seen that there are several significant harmonic frequency peaks in the 2.5-5 Hz range. Similarly, Fig. 3 (c) shows a sample one minute non-ECG shaped signal segment while Fig. 3 (d) shows its PSD. For the PSD of the non-ECG shaped signal, there are no significant harmonic components in the 2.5-5 Hz band because most of the spectral power is in the lower band (0-1 Hz).
Fig. 3.

(a) 1 minute ECG segment; (b) PSD of the ECG segment shown in (a); (c) 1 minute non-ECG waveforms and (d) PSD of the signal segment shown in 3 (c).
If there are any spectral peaks in the 2.5-5.0 Hz range, the segment contains the ECG signal. However, when there are no spectral peaks in that range, we calculate the total power of the dominant peaks in the 0-2.5 Hz range. If this spectral power is greater than 106, the segment is considered to contain non-ECG signals; otherwise it represents ECG. This threshold value was fixed for all subjects.
Fig. 4 shows a comprehensive flow diagram of the proposed method to discard segments that do not contain ECG waveforms. Once a segment is detected to contain ECG, it is analyzed to examine if the ECG waveforms are inverted or not. If the ECG waveforms are found to be inverted, they are reversed. The two minute ECG segment is then subject to the standard normalization, which consists of subtracting the mean and making the signal of unit variance.
Fig. 4.

Flow chart of the ECG-containing segment detection process.
B. Noise Artifact Detection in the ECG Signal
To detect motion and noise artifacts in the ECG signal, a time-frequency method has been applied. In particular, we used the variable frequency complex demodulation (VFCDM) based time-frequency spectral (TFS) method [22], [23].
VFCDM has been used for a variety of physiological signals [23], [24]. It not only provides one of the highest time and frequency resolutions, but also retains the accurate amplitude distribution of the signal.
The first step of VFCDM includes the use of the complex demodulation (CDM) to obtain an estimate of the TFS. Let x (t) be a narrow band sinusoidal signal with a center frequency f0, instantaneous amplitude A (t), phase ∅ (t), and the direct current component dc (t).
For a given center frequency, the instantaneous amplitude A (t) and phase ∅ (t) can be extracted by multiplying (1) by e−j2πf0t.
If the modulating frequency is not fixed but varies with time, then the signal x (t) can be written as:
| (1) |
Multiplying (2) by yields both instantaneous amplitude, A(t), and, ∅ (t):
| (2) |
If z(t) is filtered with an ideal low-pass filter (LPF) with a cut-off frequency fc < f0, then the filtered signal will be obtained with the same instantaneous amplitude A(t) and phase ∅(t).
The instantaneous frequency is given by [25]:
| (3) |
In the case of variable frequency, the center frequency, f0, is replaced with a variable frequency. By changing the center frequency followed by using the variable frequency approach and the low pass filtering, the signal, x(t), can be decomposed into the sinusoid modulations by the complex demodulation technique, as follows:
| (4) |
The instantaneous frequency and amplitude of di can be calculated using the Hilbert transform. As a result, with the combination of the CDM and Hilbert transform, a TFS with high resolution and accurate amplitude information can be obtained [26].
Fig. 5 shows a TFS representation obtained by VFCDM of a representative 15 second ECG segment. The ECG segment contains both clean and corrupted data; the latter can be seen after 5 seconds. From the figure it can be seen that the TFS obtained from the clean portion of the segment (for example: the first dashed line at ~2 seconds) contains frequency components with low amplitudes (green color) while the corrupted part (for example: the second dashed line at ~6 seconds) exhibits frequency components with high amplitudes (yellow color). In addition, the clean portion contains well-defined harmonic frequency components whereas the motion and noise artifact-contaminated portion exhibits more disorganized harmonics with greater amplitudes than the former. To use these characteristics of the TFS, the frequency component with the maximum amplitude at each time instance has been considered as a key motion and artifact detection parameter and is defined as the dominant peak amplitude (DPA) [24]. The DPA was calculated for every time instance of the entire ECG segment. We have shown that for the iPhone PPG signal the DPA varies often if there are sudden spikes in the data due to motion artifacts in the corresponding PPG signal [24]. This also holds true for the ECG data, as DPA attains large values when there are artifacts present.
Fig. 5.

(a) Sample 15 second ECG segment and (b) Time-frequency spectra of the Fig. 5 (a) signal obtained by VFCDM (log scale).
In Fig. 6 we show the DPA at two time instances of the TFS shown in Fig. 5 (b). These time instances are marked as dashed lines (~2 and 6 seconds) in Fig. 5, corresponding to clean and noisy ECG portions, respectively. Fig. 6 (a) shows the DPA corresponding to the first dashed line (clean TFS) while Fig. 6 (b) shows the DPA corresponding to the second dashed line (noisy TFS). The peak amplitude is denoted by a circle which clearly indicates that for the noisy signal, the DPA is much higher than for the clean one. This property has been used henceforth to discriminate between clean and motion and noise-corrupted data.
Fig. 6.

(a) DPA of the clean TFS (at ~2nd second) and (b) DPA of the noisy TFS (at ~6th second).
Fig. 7 (a) shows the DPA obtained from each time point of the 15-second ECG segment shown in Fig. 5. The first feature calculated from the DPA is the variance of the DPA (defined as VAR here) from each 2-second segment (i.e., piece-wise DPA variance). The underlying assumption is that, with MNA, there will be a high variance in DPA for the corrupted part and a low variance for the clean portion of the data segment.
Fig. 7.

(a) DPA of the ECG segment shown in Fig. 5 (a). (b -c) VAR and INT values obtained from the DPA.
We also observed that the area under the DPA curve (e.g. Fig. 7 (a)) becomes much larger with motion artifact than it is during the clean portion of the data. To quantify this feature characteristic, the trapezoidal integral of the DPA (denoted as INT) for each 2-second segment was calculated. Before computing the integral, a low-level threshold for the DPA value (1.50) was set to ignore the insignificant small peaks. Fig. 7(b-c) shows the VAR and INT obtained from the DPA of the sample ECG segment shown in Fig. 5 (a). From the figure, it can be seen that both the VAR and INT increase when there are MNA present in the ECG signal whereas these values are considerably lower in the clean portion.
Once the VAR and INT are calculated, these parameters are combined to determine which two-second segments contain MNA and which are clean by applying the following set of conditions:
| (5) |
For the conditions of Eq. (5), THVAR = 4 and THINT = 500 were fixed for all subjects. These thresholds were obtained by comparing VAR and INT values calculated from both the clean and MNA-corrupted ECG segments.
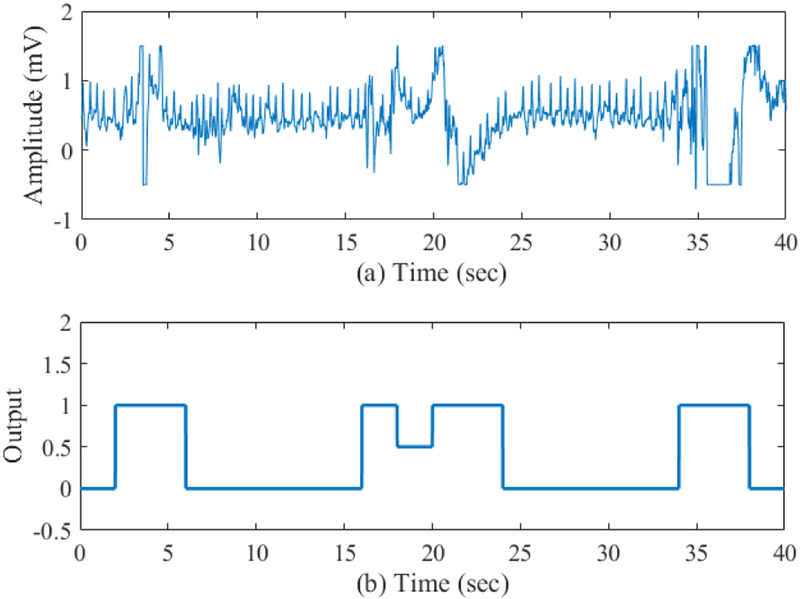
For a two-second segment determined as clean, a ‘0’ value is assigned to that segment while this value is ‘0.5’ and ‘1’ for moderately corrupted and corrupted segments, respectively. Fig. 8 (a) shows a sample 1 minute ECG segment and Fig. 8 (b) shows the piece-wise MNA detection result using the proposed method. From the figure, it can be seen that the proposed MNA detection method is able to accurately discriminate the corrupted ECG from the un-corrupted segments.
Fig. 8.

(a) Sample 1 minute ECG segment and (b) Noise artifact detection output for the data shown in (a) segment.
Until this point, we detailed how to determine whether a 2 second window (inside of the entire 2 minute ECG segment) is clean or corrupted. However, this a piecewise noise detection method; a decision for the entire 2 minute ECG segment still needs to be determined. To make the MNA detection decision for the entire 2 minute ECG segment, we count how many of the 2 second windows were determined to be corrupted in the piece-wise approach. Based on the count number, a decision is made for the entire 2 minutes of data. The details of this decision criterion will be described in the Results section.
Another type of MNA encountered in the long-term ICU ECG recordings of the MIMIC III database is high frequency (HF) muscle noise, which has amplitude similar to the QRS complexes, thus making QRS detection even more difficult. Fig. 9 shows two representative samples of 30 second ECG segments corrupted with high frequency muscle artifacts.
Fig. 9.

(a), (b) Sample 30 second ECG segments corrupted with HF muscle artifacts.
We have found that this type of noise shows similar spectral characteristics when compared to ECG segments with AF. To overcome the spectral overlap of the HF muscle artifacts and AF segments, we decompose the ECG signal into several sub-bands using the VFCDM TFS approach. As previously described, the VFCDM can decompose a signal into different time domain signal components having different spectral bands (∑ di in (4)). Using such an approach, we have previously shown that the second VFCDM component contains primarily the dominant R-peaks, hence, it is suitable for QRS peak detection [27]. Fig. 10 (a) shows a sample 10 second clean ECG segment and its second VFCDM component is shown in Fig. 10 (b). Fig. 10 (c)-(d) show the same for a segment corrupted with HF muscle artifacts. From the figure, it can be seen that Fig. 10 (b) has detectable R-speaks while Fig. 10 (d) does not, as the segment is severely corrupted. From the second component, we then compute the corresponding TFS and calculate the sum of the DPA only in the frequency range above 10 Hz. In this frequency range, the clean ECG should have a low DPA value while the HF muscle artifact component is expected to have larger DPA values due to higher harmonics corresponding to severe artifacts. Thus, the resultant value of the sum of the DPA (defined as SDPA) in the frequency range greater than 10 Hz is an indicator of the noise power, which is expected to be higher for the corrupted ECG segments and much lower for the clean segments. Moreover, since the second VFCDM component shown in Fig. 10 (d) has less amplitude than does that in Fig. 10 (b), the variance of the second component is also used as a second feature parameter. Thus, imposing thresholds on both the SDPA and variance, an ECG segment with HF muscle artifacts can be distinguished from the clean data segments. To determine the thresholds for SDPA and the variance, the values derived from both clean and HF noise-corrupted ECG segments were compared and the optimal thresholds were found to be 240 and 0.08, respectively. These values were fixed for all subjects.
Fig. 10.

(a) Sample 10 second clean ECG segment; (b) the second VFCDM component of Fig. 10 (a); (c) sample 10 second HF corrupted ECG segment and (d) the second VFCDM component of Fig. 10 (c).
C. Statistical Approach for Atrial Fibrillation Detection
Many AF detection methods are available in the literature including time varying coherence functions [28], combinations of time, frequency and nonlinear features [29], tree-based classifiers built on time-frequency features [30], and others. In this study, for AF detection, we use two statistical parameters which have been previously shown to be accurate for both ECG and PPG signals and easy to calculate [31], [32].
The first parameter is the root mean-square of successive difference (RMSSD). The RMSSD is used to quantify beat-to-beat variability. Since AF exhibits higher variability than NSR, its RMSSD is expected to be higher than that of NSR RR time series. As subjects have different mean heart rates, we normalize by dividing the RMSSD by the mean value of the RR time series [31].
The second parameter for AF detection is the Sample entropy (SampEn). The SampEn is the negative natural logarithm of an estimate of the conditional probability that subseries that match pointwise within a certain tolerance, also match at the next point, where self-matches are not included in calculating the probability. A high value of SampEn indicates low similarity in the time series while a low value of Sample entropy indicates high similarity. Thus, the SampEn is a useful tool to assess randomness of RR time series [32], [33].
The threshold values of THRmssd and THSampEn to detect AF were derived from comparing RMSSD and SampEn values obtained from 25 AF and 25 NSR subjects found in the MIMIC III subset database and they were set to 0.12 and 1.0, respectively. These values were fixed for all subjects.
IV. Results
In this section, we present the experimental analysis of the proposed algorithm in several steps. First, we show the performance of the proposed non-ECG waveform data segment detection method. Next, the MNA detection performance is shown for those segments which are determined to have ECG waveforms. Finally, the impact of the motion and noise artifact detection algorithm on reducing false AF characterization is presented. It is to be noted here that to generalize the algorithm, all the thresholds for non-ECG waveform and MNA detection are kept unchanged across the entire database.
A. Non-ECG Waveform Segment Detection Performance
To analyze the non-ECG waveform segment detection performance, a subset of data from the MIMIC III database containing 1,000 two minute segments of ICU recordings was first manually analyzed. Among 1,000 two minute recordings, 248 segments contained non-ECG waveform characteristics (including missing values, suddenly stopped recordings, flat line, zero line, non-ECG shaped signals, and the like) and 752 two minute segments were identified to exhibit ECG waveforms. These segments were adjudicated by two of the authors (SB and KHC). The task of the MNA detection algorithm is to discriminate among three possible classifications: non-ECG waveforms, ECG with artifact contamination, and clean ECG. For our analysis, the first task was to discriminate between non-ECG and ECG segments, the latter either clean or containing MNA.
Table 1 shows the confusion matrix for the non-ECG segment detection results which were derived from comparing the results of the algorithm with the annotations from two of the authors. Our method is able to discriminate between ECG and non-ECG waveform containing segments with 100% accuracy.
TABLE I.
Confusion Matrix for Non-ECG Segment Detection
| True Label | Detected Label | |
|---|---|---|
| Non-ECG | ECG | |
| Non-ECG | 248 | 0 |
| ECG | 0 | 752 |
Next, we examined how many two minute segments contained ECG waveforms (either clean or with motion artifacts) in our MIMIC III subset of 50 subjects (25 with NSR and 25 with AF). For this purpose, we examined the entire duration of the data for each of those 50 subjects. It is to be noted here that previously mentioned 1,000 segments in Table 1 are from this subset of 50 subjects. In Table 2, we show the number of segments detected as not containing ECG waveforms for 25 NSR subjects. Table 3 shows the same for 25 AF subjects. The adjudication of the NSR and AF subjects was performed by the two physicians (DM and AW). In both Table 2 and III, the “subject ID” and “waveform file name” indicate the IDs and recordings, respectively, of the subjects analyzed. The columns of these tables also show features we used to discriminate between ECG and non-ECG containing waveforms. From these tables, it can be seen that the percentages of ECG-containing segments vary considerably, ranging from 100% to 28.94% across different subjects. For the NSR subjects, we found on average 90.88% segments contained ECG while for AF subjects, it was 86.24%.
TABLE II.
Detected Number of Segments at Different Stages of Non-ECG Detection Process (NSR Subjects)
| Segments Detected in Each Step | ||||||||
|---|---|---|---|---|---|---|---|---|
| Subject ID |
Waveform File Name | No. of Segments |
Missing Value |
Variance | PSD | Zero | ECG Containing Segments |
ECG Segments Portion (%) |
| 608 | p000608-2167-03-23-08-12 | 934 | 11 | 0 | 0 | 2 | 921 | 98.61 |
| 776 | p000776-2184-04-30-15-16 | 1414 | 41 | 0 | 0 | 1 | 1372 | 97.03 |
| 4829 | p004829-2103-08-30-21-52 | 625 | 26 | 16 | 1 | 0 | 582 | 93.12 |
| 7136 | p007136-2143-08-15-16-41 | 684 | 502 | 0 | 148 | 1 | 33 | 4.82 |
| 8167 | p008167-2130-10-03-05-31 | 984 | 31 | 22 | 0 | 0 | 931 | 94.61 |
| 8674 | p008674-2131-05-04-16-32 | 715 | 44 | 0 | 0 | 0 | 671 | 93.85 |
| 10391 | p010391-2183-12-25-10-15 | 700 | 8 | 0 | 0 | 41 | 651 | 93 |
| 13072 | p013072-2194-01-22-16-13 | 1544 | 2 | 2 | 0 | 0 | 1540 | 99.74 |
| 13136 | p013136-2133-11-09-16-58 | 591 | 1 | 0 | 0 | 0 | 590 | 99.83 |
| 15852 | p015852-2148-05-03-18-39 | 2099 | 22 | 14 | 0 | 0 | 2063 | 98.28 |
| 16684 | p016684-2188-01-29-00-06 | 1150 | 26 | 2 | 0 | 0 | 1122 | 97.57 |
| 17344 | p017344-2169-07-17-17-32 | 417 | 28 | 0 | 0 | 0 | 389 | 93.29 |
| 19608 | p019608-2125-02-05-04-57 | 986 | 22 | 3 | 0 | 0 | 961 | 97.46 |
| 23824 | p023824-2182-11-27-14-22 | 547 | 33 | 12 | 0 | 0 | 502 | 91.77 |
| 26964 | p026964-2147-01-11-18-03 | 1358 | 19 | 8 | 0 | 0 | 1331 | 98.01 |
| 29512 | p029512-2188-02-27-18-10 | 599 | 42 | 0 | 0 | 0 | 557 | 92.99 |
| 50384 | p050384-2195-01-30-02-21 | 366 | 1 | 2 | 0 | 0 | 363 | 99.18 |
| 55204 | p055204-2132-06-30-09-34 | 1095 | 4 | 4 | 0 | 0 | 1087 | 99.27 |
| 58932 | p058932-2120-10-13-23-15 | 1182 | 365 | 0 | 0 | 0 | 817 | 69.12 |
| 62160 | p062160-2153-10-03-14-49 | 501 | 356 | 0 | 0 | 0 | 145 | 28.94 |
| 63628 | p063628-2176-07-02-20-38 | 1081 | 1 | 5 | 1 | 0 | 1074 | 99.35 |
| 87675 | p087675-2104-12-05-03-53 | 1120 | 11 | 5 | 1 | 0 | 1103 | 98.48 |
| 89964 | p089964-2154-05-22-07-45 | 398 | 33 | 0 | 0 | 0 | 365 | 91.71 |
| 92289 | p092289-2183-03-17-23-12 | 789 | 111 | 0 | 0 | 0 | 678 | 85.93 |
| 97547 | p097547-2125-10-21-23-43 | 518 | 2 | 10 | 0 | 0 | 506 | 97.68 |
| Total | 22397 | 1742 | 105 | 151 | 45 | 20354 | 90.88 | |
TABLE III.
Detected Number of Segments at Different Stages of Non-ECG Detection Process (AF Subjects)
| Segments Detected In Each Step | ||||||||
|---|---|---|---|---|---|---|---|---|
| Subject ID |
Waveform File Name | No. of Segments |
Missing Value |
Variance | PSD | Zero | ECG Containing Segments |
ECG Segments Portion (%) |
| 946 | p000946-2120-05-14-08-08 | 186 | 0 | 0 | 0 | 0 | 186 | 100 |
| 4490 | p004490-2151-01-07-12-36 | 759 | 2 | 0 | 8 | 140 | 609 | 80.24 |
| 75796 | p075796-2198-07-25-23-40 | 1406 | 198 | 0 | 0 | 0 | 1208 | 85.92 |
| 9526 | p009526-2113-11-17-02-12 | 325 | 27 | 0 | 0 | 0 | 298 | 91.69 |
| 85163 | p085163-2199-03-03-04-09 | 259 | 16 | 0 | 0 | 0 | 243 | 93.82 |
| 22954 | p022954-2136-02-29-17-52 | 687 | 0 | 3 | 0 | 0 | 684 | 99.56 |
| 25117 | p025117-2202-03-15-20-28 | 1099 | 14 | 2 | 1 | 0 | 1082 | 98.45 |
| 26377 | p026377-2111-11-17-16-46 | 1288 | 334 | 13 | 0 | 0 | 941 | 73.06 |
| 43613 | p043613-2185-01-18-23-52 | 912 | 194 | 0 | 0 | 0 | 718 | 78.73 |
| 50089 | p050089-2157-08-23-16-37 | 1320 | 848 | 1 | 0 | 0 | 471 | 35.68 |
| 57964 | p057964-2100-12-30-09-33 | 1161 | 176 | 8 | 0 | 0 | 977 | 84.15 |
| 63039 | p063039-2157-03-29-13-35 | 910 | 1 | 66 | 0 | 0 | 843 | 92.64 |
| 68956 | p068956-2107-04-21-16-05 | 728 | 28 | 13 | 28 | 0 | 659 | 90.52 |
| 69339 | p069339-2133-12-09-21-14 | 717 | 18 | 135 | 1 | 0 | 563 | 78.52 |
| 70854 | p070854-2151-12-02-11-28 | 381 | 1 | 0 | 1 | 0 | 379 | 99.48 |
| 75371 | p075371-2119-08-22-00-53 | 423 | 15 | 2 | 0 | 0 | 406 | 95.98 |
| 77729 | p077729-2120-08-31-01-03 | 460 | 1 | 11 | 15 | 0 | 433 | 94.13 |
| 87275 | p087275-2108-08-29-12-53 | 367 | 1 | 2 | 0 | 0 | 364 | 99.18 |
| 79998 | p079998-2101-10-21-21-31 | 608 | 7 | 3 | 0 | 0 | 598 | 98.36 |
| 81349 | P081349-2120-02-11-06-35 | 151 | 5 | 0 | 0 | 0 | 146 | 96.69 |
| 85866 | p085866-2178-03-20-17-11 | 714 | 7 | 0 | 0 | 0 | 707 | 99.02 |
| 89565 | p089565-2174-05-12-00-07 | 1039 | 42 | 0 | 0 | 0 | 997 | 95.96 |
| 92846 | p092846-2129-12-21-13-12 | 368 | 1 | 0 | 0 | 0 | 367 | 99.73 |
| 94847 | p094847-2112-02-12-19-56 | 686 | 1 | 14 | 1 | 0 | 670 | 97.67 |
| 63773 | p063773-2151-04-02-18-49 | 754 | 19 | 12 | 1 | 0 | 722 | 95.76 |
| Total | 17708 | 1956 | 285 | 56 | 140 | 15271 | 86.24 | |
B. Performance of the Noise Artifact Detection Algorithm
The next phase of the algorithm is to discriminate between motion and noise corrupted ECG and clean ECG segments from both NSR and AF subjects’ data. Two representative ECG segments collected from both NSR and AF subjects, respectively, along with the corresponding MNA detection results are shown in Figs. 11-12. Fig. 11 (a) shows a sample one minute NSR ECG segment while Fig. 11 (b) shows the results of our motion and noise detection method. Similarly, Fig. 12 (a) shows a representative AF ECG segment and Fig. 12 (b) represents results from our MNA detection method. In these figures, when the output curve has a value of one it represents the presence of MNA, and when it is zero this indicates clean data. As shown in these figures, the proposed algorithm does a good job in detecting artifacts when they occur. Certainly, the portion of the artifact segment from 15-24 sec in Fig. 12 (a) does contain ECG and can be identified using a low pass filter. However, this will require much more computational time since we will need to use small segment-by-segment low pass filtering. However, as seen in this figure, which is typical, even with a low-pass filter, in most cases the ECG cannot be retrieved since artifacts have overwhelmed the ECG signal. This is why we excluded these episodes as they can lead to false R-peak detection, which in turn can cause inaccurate AF detection.
Fig. 11.

(a) Sample one minute NSR ECG segment and (b) Noise artifact detection output for this segment.
Fig. 12.
(a) Sample AF ECG segment and (b) Noise artifact detection output for this segment.
C. Determination of the Motion and Noise Artifact Tolerance
While we have shown that our method is able to provide good detection of MNA when they occur, the crux of the matter is to maximize the yield of usable data, so that as many AF episodes as possible can be captured, accurately, yet minimize false positive detections. In other words, our main goal for the MNA detection algorithm is to accurately detect AF. This suggests that the algorithm should be able to detect precisely when MNA occur as we have shown in Figs. 11-12. However, it should be noted that our AF detection algorithm, as well as others, is able to tolerate a certain amount of MNA [17], [27], [31]. Hence, we want to determine how much of the two minute data segment can be corrupted by motion and noise artifacts before we obtain false positive detection of AF. This approach will lead to a better yield of usable data for AF detection and can also be applied to wearable ECG devices as they are more prone to MNA. Thus, this is the strategy we employed in detecting MNA segments. Towards this strategy, the QRS complexes are first detected from the 2 minute ECG segments using our newly developed R-peak detection algorithm [27], albeit any of the well-documented ECG peak detection algorithms can be used for this step. Next, the R-R intervals are calculated, which are then used to calculate SampEn and RMSSD.
Table 4 shows the number of discarded segments due to various durations of MNA (detected from the piecewise detection as shown in Figs. 11 and 12) that are tolerated, called the MNA duration threshold because durations of data that are noisy for less than the threshold are tolerated and kept in the data. The false positive AF detections generated from using either the RMSSD or SampEn (with previously derived thresholds) are also shown in the table. The threshold values of the RMSSD and SampEn for AF detection were derived from the 25 AF subjects found in the MIMIC III subset database. As expected, the number of discarded segments decreases with increasing MNA duration threshold in a given data segment. Conversely, the number of false positive AF detections increases, due to the greater presence of motion and noise corrupted segments. When the duration of MNA being tolerated is more than 12 seconds, the false positive detections of AF for SampEn increase from 6 to 7 and for RMSSD, they increase from 79 to 85. Moreover, only 1.69% of the ECG data is discarded with a 12 second MNA duration threshold, far less than with either the 6 or 9 second thresholds (7.85% and 3.93%, respectively). As a result, the 12 second threshold is selected to determine if a data segment contains MNA. In other words, within a 2 minute ECG segment, if more than 12 seconds of data are detected as corrupted, we discard that segment; otherwise, we retain the data for AF analysis.
TABLE IV.
Variation of False Positives With Different Noise Duration Thresholds
|
MNA Duration Threshold |
Discarded Segments |
Discarded Portion (%) |
False Positives Due to SampEn |
False Positives Due to RMSSD |
|---|---|---|---|---|
| 6 sec | 590 | 7.85 | 6 | 53 |
| 9 sec | 296 | 3.93 | 6 | 65 |
| 12 sec | 127 | 1.69 | 6 | 79 |
| 15 sec | 53 | 0.71 | 7 | 85 |
| 18 sec | 22 | 0.29 | 7 | 89 |
D. Impact of High Frequency Noise Detection
We have also observed that several subjects in the MIMIC III database had data contaminated with what appears to be high frequency noise. To demonstrate the impact of the proposed high-frequency noise detection approach on reducing false positive detection of AF, we analyzed 10 additional NSR subjects from the MIMIC III database. These subjects are distinct from the 50 subjects we used for the data analysis results presented in the preceding sections. Note that we have chosen only the NSR subjects since significant presence of high frequency noise along with motion artifacts can lead to false positive detection of AF.
Each of the 10 subjects’ ECG recordings is divided into two minute non-overlapping segments and for these data, the recording time varied from 20 hours to 43 hours. Table 5 shows the comparison of false positive detections of AF for different noise detection approaches: without any noise detection, with only the MNA detection as detailed in the prior section, and with the combined MNA and HF noise detection approaches. The false positive AF detection occurrences were calculated based on the same sampEn threshold used to generate Table 4. As shown in Table 4, when MNA detection is coupled with HF noise detection, the total number of false positives for AF for all subjects (35) is much less than with only the MNA detection (150), especially when HF noise is present (strongly contributed to by subjects 5 and 10). For example, subjects 5 and 10 have a high amount of HF noise present in their ECG recordings, which was not accounted for using only the MNA detection method. Consequently, 118 segments were falsely detected to exhibit AF in those two subjects. However, for subjects 5 and 10, we reduced the false positive detection of AF to only 5 when both MNA and HF detection methods are used, which is a significant reduction (reduced by 113) when compared to using only the MNA detection method. Thus, we observe the benefit of combining the general MNA and the high frequency noise approaches in reducing false positive detection of AF.
TABLE V.
Comparison of False Positives With Different Noise Detection Approaches
| No. of False Positives in AF Detection | ||||
|---|---|---|---|---|
|
Subject ID |
Number of Segments |
Without Noise Detection |
Only MNA Detection |
MNA and HF Noise Detection |
| 1 | 595 | 4 | 4 | 4 |
| 2 | 1269 | 241 | 23 | 23 |
| 3 | 840 | 5 | 5 | 3 |
| 4 | 1080 | 4 | 0 | 0 |
| 5 | 975 | 37 | 18 | 1 |
| 6 | 937 | 0 | 0 | 0 |
| 7 | 1016 | 0 | 0 | 0 |
| 8 | 1185 | 0 | 0 | 0 |
| 9 | 1291 | 0 | 0 | 0 |
| 10 | 711 | 322 | 100 | 4 |
| Total | 9899 | 613 | 150 | 35 |
V. Discussion
We illustrated the performance of our MNA detection algorithm, which accounted for various types of contamination including high frequency noise sources, using the long-term continuous ECG recordings obtained from the MIMIC III database. The MIMIC III ICU database contains actual clinical ECG data, which means not only good fidelity signals but also a plethora of MNA-contaminated data. We found various sources of artifact led to low fidelity signals and portions that didn’t even contain ECG waveforms like bad contact with electrodes, movement artifacts, sudden disappearance of the ECG tracing, high frequency noise, and poor device calibration. Due to these various types of MNA, in our first phase we had to develop an approach to discriminate between segments with and without ECG waveforms. For the subset of MIMIC III waveforms which was analyzed, we found that ~86-90% of the data had analyzable ECG recordings. We found that the major symptoms for a segment lacking an ECG waveform were missing data and zero-valued ECG signals.
The goal of the second phase of the motion and noise artifact detection algorithm is to determine corrupted segments among those signals that have been identified to contain ECG waveforms. We used the VFCDM time-frequency approach to analyze the changes in the dominant frequency peaks to discriminate between MNA from the QRS complexes. The primary goal of the development of our MNA detection algorithm was to reduce false positive detection of AF, which is why we were mainly interested in retaining only the dynamics of the QRS complexes. Moreover, our secondary aim was to retain as much of the corrupted data as possible, without compromising the accuracy of AF detection. Hence, we examined how much of a two minute data segment can be corrupted and yet we maintain accuracy of AF detection. The AF detection was based on the calculation of SampEn and RMSSD, as they have been shown to be accurate discriminators of AF [31]. As expected, the greater the time duration of corrupted data that was allowed in the two minute segment, the more false positive detection of AF occurred. However, it was found that for AF detection, SampEn and RMSSD were tolerant for up to 12 seconds of corrupted data in a two minute segment.
The final step of our motion and noise algorithm development was to distinguish high frequency artifacts from true ECG signals. We also used the VFCDM time-frequency method to separate the dynamics of the ECG into different frequency bands to identify those data with high frequency noise that did not resemble any characteristics of ECG waveforms. By eliminating presumed ECG data with high frequency characteristics, we were able to significantly reduce the number of false positive detections of AF in NsR subject data, when the data contained such high frequency noise.
Limitations:
Given the large number of subjects and long-duration recordings available in the entire MIMIC III database, we limited the testing of our algorithm to only 60 subjects. Hence, it is possible that we may have not accounted for other types of noise sources, which our algorithm may not be able to detect. It is our hope that other researchers can continue to use the publicly-available MIMIC III recordings to further test, enhance, and develop MNA detection algorithms in the future. Certainly, this strategy has worked well with the MIT-BIH database for developing AF algorithms [34], [35], so it is hoped that similar success with MNA detection will occur in the future.
VI. Conclusion
We developed an algorithm to automatically detect MNA in the long-term ICU ECG recordings from the MIMIC III database. The goal of our MNA detection algorithm was to identify those data with unidentifiable QRs complexes in the ECG. This is primarily driven by the fact that we were mainly interested in the automatic identification of AF. Hence, the development of our MNA detection algorithm is different than the CinC 2015 challenge since the latter was mainly interested in reducing ICU false alarms by using ECG and other vital sign data. our algorithm showed good accuracy in identifying various types of noises, albeit this study was performed on a limited number of subjects. Further validation of the algorithm will need to be done using more subjects in the future, but the results presented showed the promise of our approach in accounting for most of the MNA that are encountered in the ICU setting. It was found that when our MNA detection algorithm was combined with AF detection parameters, we accurately detected the presence of AF with only 5.7% false positives; the false positives decreased by 94.3% when MNA and HF detection were used.
Acknowledgments
This work was supported by the NIH grant R01 HL136660.
Biography

Syed Khairul Bashar received the B.S. degree in electrical and electronic engineering from the Bangladesh University of Engineering and Technology. He is currently pursuing the Ph.D. degree with the University of Connecticut, Storrs, CT, USA.
Eric Ding completed his BS and MS degrees at University of California, San Diego, and is currently an MD/PhD candidate at University of Massachusetts Medical School. His dissertation work focuses on leveraging smartwatch devices for cardiac rhythm monitoring.
Allan J. Walkey is currently an Assistant Professor of medicine with the Boston University School of Medicine. His research interests involve cardiac complication of critical illness, critical care epidemiology, and comparative effectiveness research methodology.
David D. McManus is currently an Associate Professor of medicine with the University of Massachusetts Medical School, Worcester, MA, USA. His clinical interests include arrhythmia ablation, brady and tachyarrhythmias, and cardiac devices.
Ki H. Chon received the B.S. degree in electrical engineering from the University of Connecticut, Storrs, CT, USA, the M.S. degree in biomedical engineering from the University of Iowa, Iowa City, and the M.S. degree in electrical engineering and the Ph.D. degree in biomedical engineering from the University of Southern California, Los Angeles. He is currently the John and Donna Krenicki Chair Professor and the Head of biomedical engineering with the University of Connecticut. He is a Co-Founder of Mobile Sense Technologies, which is located at the TIP Center, Farmington, CT, USA. The company has recently been granted both NIH and NSF SBIR grants. He is a Fellow of the American Institute of Medical and Biological Engineering and the International Academy of Medical and Biological Engineering. He has chaired many international conferences, including his role as the Program Co-Chair for the IEEE EMBS Conference in NYC, in 2006, and as the Conference Chair for the 6th International Workshop on Biosignal Interpretation in New Haven, CT, USA, in 2009. He was an Associate Editor of the IEEE Transactions on Biomedical Engineering, from 2007 to 2013.
References
- [1].Donchin Y and Seagull FJ, “The hostile environment of the intensive care unit,” Curr. Opin. Crit. Care, vol. 8, no. 4, p. 316, August 2002. [DOI] [PubMed] [Google Scholar]
- [2].Kishimoto Y, Kutsuna Y, and Oguri K, “Detecting motion artifact ECG noise during sleeping by means of a tri-axis accelerometer,” Conf. Proc. Annu. Int. Conf. IEEE Eng. Med. Biol. Soc. IEEE Eng. Med. Biol. Soc. Annu. Conf, vol. 2007, pp. 2669–2672, 2007. [DOI] [PubMed] [Google Scholar]
- [3].Behar J, Oster J, Li Q, and Clifford GD, “ECG signal quality during arrhythmia and its application to false alarm reduction,” IEEE Trans. Biomed. Eng, vol. 60, no. 6, pp. 1660–1666, June 2013. [DOI] [PubMed] [Google Scholar]
- [4].Di Marco LY et al. , “Evaluation of an algorithm based on single-condition decision rules for binary classification of 12-lead ambulatory ECG recording quality,” Physiol. Meas, vol. 33, no. 9, pp. 1435–1448, September 2012. [DOI] [PubMed] [Google Scholar]
- [5].Clifford GD, Azuaje F, and McSharry P, Advanced Methods And Tools for ECG Data Analysis. Norwood, MA, USA: Artech House, Inc., 2006. [Google Scholar]
- [6].Bioelectrical Signal Processing in Cardiac and Neurological Applications. Elsevier, 2005. [Google Scholar]
- [7].Paul JS, Reddy MR, and Kumar VJ, “A transform domain SVD filter for suppression of muscle noise artefacts in exercise ECG’s,” IEEE Trans. Biomed. Eng, vol. 47, no. 5, pp. 654–663, May 2000. [DOI] [PubMed] [Google Scholar]
- [8].Lu G et al. , “Removing ECG noise from surface EMG signals using adaptive filtering,” Neurosci. Lett, vol. 462, no. 1, pp. 14–19, September 2009. [DOI] [PubMed] [Google Scholar]
- [9].Sameni R, Shamsollahi MB, Jutten C, and Clifford GD, “A Nonlinear Bayesian Filtering Framework for ECG Denoising,” IEEE Trans. Biomed. Eng, vol. 54, no. 12, pp. 2172–2185, December 2007. [DOI] [PubMed] [Google Scholar]
- [10].Orphanidou C, Bonnici T, Charlton P, Clifton D, Vallance D, and Tarassenko L, “Signal-Quality Indices for the Electrocardiogram and Photoplethysmogram: Derivation and Applications to Wireless Monitoring,” IEEE J. Biomed. Health Inform, vol. 19, no. 3, pp. 832–838, May 2015. [DOI] [PubMed] [Google Scholar]
- [11].Johannesen L and Galeotti L, “Automatic ECG quality scoring methodology: mimicking human annotators,” Physiol. Meas, vol. 33, no. 9, pp. 1479–1489, September 2012. [DOI] [PubMed] [Google Scholar]
- [12].Morgado E et al. , “Quality estimation of the electrocardiogram using cross-correlation among leads,” Biomed. Eng. Online, vol. 14, p. 59, June 2015. [DOI] [PMC free article] [PubMed] [Google Scholar]
- [13].Quesnel PX, Chan ADC, and Yang H, “Real-time biosignal quality analysis of ambulatory ECG for detection of myocardial ischemia,” in 2013 IEEE International Symposium on Medical Measurements and Applications (MeMeA), 2013, pp. 1–5. [Google Scholar]
- [14].Jekova I, Krasteva V, Christov I, and Abächerli R, “Threshold-based system for noise detection in multilead ECG recordings,” Physiol. Meas, vol. 33, no. 9, pp. 1463–1477, September 2012. [DOI] [PubMed] [Google Scholar]
- [15].Hayn D, Jammerbund B, and Schreier G, “QRS detection based ECG quality assessment,” Physiol. Meas, vol. 33, no. 9, pp. 1449–1461, September 2012. [DOI] [PubMed] [Google Scholar]
- [16].Clifford GD, Behar J, Li Q, and Rezek I, “Signal quality indices and data fusion for determining clinical acceptability of electrocardiograms,” Physiol. Meas, vol. 33, no. 9, pp. 1419–1433, September 2012. [DOI] [PubMed] [Google Scholar]
- [17].Lee J, McManus DD, Merchant S, and Chon KH, “Automatic motion and noise artifact detection in Holter ECG data using empirical mode decomposition and statistical approaches,” IEEE Trans. Biomed. Eng, vol. 59, no. 6, pp. 1499–1506, June 2012. [DOI] [PubMed] [Google Scholar]
- [18].Satija U, Ramkumar B, and Manikandan MS, “Automated ECG Noise Detection and Classification System for Unsupervised Healthcare Monitoring,” IEEE J. Biomed. Health Inform, vol. 22, no. 3, pp. 722–732, May 2018. [DOI] [PubMed] [Google Scholar]
- [19].Goldberger AL et al. , “PhysioBank, PhysioToolkit, and PhysioNet?: Components of a New Research Resource for Complex Physiologic Signals,” Circulation, vol. 101, no. 23, pp. e215–e220, June 2000. [DOI] [PubMed] [Google Scholar]
- [20].Johnson AEW et al. , “MIMIC-III, a freely accessible critical care database,” Sci. Data, vol. 3, p. 160035, May 2016. [DOI] [PMC free article] [PubMed] [Google Scholar]
- [21].Mateo J and Laguna P, “Analysis of heart rate variability in the presence of ectopic beats using the heart timing signal,” IEEE Trans. Biomed. Eng, vol. 50, no. 3, pp. 334–343, March 2003. [DOI] [PubMed] [Google Scholar]
- [22].Posada-Quintero HF, Florian JP, Orjuela-Cañón AD, Aljama-Corrales T, Charleston-Villalobos S, and Chon KH, “Power Spectral Density Analysis of Electrodermal Activity for Sympathetic Function Assessment,” Ann. Biomed. Eng, vol. 44, no. 10, pp. 3124–3135, October 2016. [DOI] [PubMed] [Google Scholar]
- [23].Chon KH, Dash S, and Ju K, “Estimation of Respiratory Rate From Photoplethysmogram Data Using Time–Frequency Spectral Estimation,” IEEE Trans. Biomed. Eng, vol. 56, no. 8, pp. 2054–2063, August 2009. [DOI] [PubMed] [Google Scholar]
- [24].Bashar SK, Han D, Soni A, McManus DD, and Chon KH, “Developing a novel noise artifact detection algorithm for smartphone PPG signals: Preliminary results,” in 2018 IEEE EMBS International Conference on Biomedical Health Informatics (BHI), 2018, pp. 79–82. [Google Scholar]
- [25].Wang H, Siu K, Ju K, and Chon KH, “A High Resolution Approach to Estimating Time-Frequency Spectra and Their Amplitudes,” Ann. Biomed. Eng, vol. 34, no. 2, pp. 326–338, February 2006. [DOI] [PubMed] [Google Scholar]
- [26].Posada-Quintero HF, Florian JP, Orjuela-Cañón ÁD, and Chon KH, “Highly sensitive index of sympathetic activity based on time-frequency spectral analysis of electrodermal activity,” Am. J. Physiol.-Regul. Integr. Comp. Physiol, vol. 311, no. 3, pp. R582–R591, July 2016. [DOI] [PubMed] [Google Scholar]
- [27].Bashar SK, Noh Y, Walkey AJ, McManus DD, and Chon KH, “VERB: VFCDM-Based Electrocardiogram Reconstruction and Beat Detection Algorithm,” IEEE Access, vol. 7, pp. 13856–13866, 2019. [DOI] [PMC free article] [PubMed] [Google Scholar]
- [28].Lee J, Nam Y, McManus DD, and Chon KH, “Time-varying coherence function for atrial fibrillation detection,” IEEE Trans. Biomed. Eng, vol. 60, no. 10, pp. 2783–2793, October 2013. [DOI] [PubMed] [Google Scholar]
- [29].Hajeb-Mohammadalipour S, Ahmadi M, Shahghadami R, and Chon KH, “Automated Method for Discrimination of Arrhythmias Using Time, Frequency, and Nonlinear Features of Electrocardiogram Signals,” Sensors, vol. 18, no. 7, p. 2090, July 2018. [DOI] [PMC free article] [PubMed] [Google Scholar]
- [30].Kropf M et al. , “Cardiac anomaly detection based on time and frequency domain features using tree-based classifiers,” Physiol Meas, vol. 39, no. 11, p. 114001, October 2018. [DOI] [PubMed] [Google Scholar]
- [31].Dash S, Chon KH, Lu S, and Raeder EA, “Automatic real time detection of atrial fibrillation,” Ann. Biomed. Eng, vol. 37, no. 9, pp. 1701–1709, September 2009. [DOI] [PubMed] [Google Scholar]
- [32].Lee J, Reyes BA, McManus DD, Maitas O, and Chon KH, “Atrial Fibrillation Detection Using an iPhone 4S,” IEEE Trans. Biomed. Eng, vol. 60, no. 1, pp. 203–206, January 2013. [DOI] [PubMed] [Google Scholar]
- [33].Richman JS and Moorman JR, “Physiological time-series analysis using approximate entropy and sample entropy,” Am. J. Physiol. Heart Circ. Physiol, vol. 278, no. 6, pp. H2039–2049, June 2000. [DOI] [PubMed] [Google Scholar]
- [34].Moody G, “A new method for detecting atrial fibrillation using R-R intervals,” Comput. Cardiol, pp. 227–230, 1983. [Google Scholar]
- [35].Moody GB and Mark RG, “The impact of the MIT-BIH Arrhythmia Database,” IEEE Eng. Med. Biol. Mag, vol. 20, no. 3, pp. 45–50, June 2001. [DOI] [PubMed] [Google Scholar]