Abstract
Background:
Injectable hyaluronic acid fillers are routinely used for correction of soft-tissue volume loss and facial rejuvenation. Product differentiation has primarily been based on the rheologic parameter known as elastic modulus (G′), although other physicochemical properties are being explored to characterize potential product performance. As clinical data regarding product performance are lacking, the practical experience of injectors provides a valuable bridge in the knowledge gap between product rheologic data and product use.
Methods:
Rheologic and physicochemical measurements (swelling factor and cohesion) were collected for 18 products. To observe the impact of G′ and hyaluronic acid concentration on swelling factor and cohesion, proportional relationships were evaluated. Contributing authors were queried regarding their G′-based selection of products when considering skin quality, degree of correction, injection depth, and anatomical location.
Results:
Relationships were observable between G′ and swelling factor and G′ and cohesion only when limited to products manufactured by the same crosslinking technology and the same concentration. No relationship between isolated hyaluronic acid concentration and swelling factor or cohesion was apparent. Although rheological parameters and the assumptions of ex vivo data translating to in vivo performance are oftentimes not completely aligned, in the clinical experience of the authors, in general, higher G′ products are better suited for thicker skin and deeper injection planes, whereas lower G′ products are better for more superficial planes, although exceptions to these trends are also made based on technical experience.
Conclusions:
While rheologic and physicochemical characteristics can vary widely between products and the methods and measurements of these parameters are often difficult to correlate, G′ represents a useful and consistent parameter for product differentiation. Understanding how to select products based on G′ is valuable knowledge for customizing injection plans and contributes to an optimal aesthetic outcome.
The use of injectable hyaluronic acid gel as a soft-tissue filler for facial rejuvenation has become a standard treatment procedure for aesthetic clinicians worldwide. According to the International Society of Aesthetic Plastic Surgery data, the number of nonsurgical aesthetic procedures using hyaluronic acid injectables has surged 97 percent from 2010 to 2017.1 In parallel, the range of products to choose from has also been greatly expanded through innovative gel manufacturing technologies. Different products can share the same indication yet consist of very different rheologic and physicochemical profiles.2–4 These profiles distinguish products in functionally important ways and have become an effective way for clinicians to select which products are the most suitable for a given clinical need.
Factors That Impact a Product's Rheologic and Physicochemical Properties
The rheologic and physicochemical properties of hyaluronic acid gels are determined by multiple factors, including the crosslinking reactions used, the hyaluronic acid substrate’s molecular weight, the hyaluronic acid concentration, and the process used to fragment the bulk gel into an injectable form.5–8 Crosslinking is the basis for the mechanical strength of the gel and improves product longevity.9,10 Crosslinking can be accomplished through the introduction of chemical linkages between the hyaluronic acid chains or by stabilizing the naturally occurring entanglements that the hyaluronic acid chains form on their own.11
The crosslinking process results in a block-like form of hydrogel that must then be fragmented into smaller pieces, depending on the final product’s intended use. For instance, a gel processed into smaller fragments may be more suitable for implantation into superficial planes, whereas those with larger fragments are more suitable for deeper planes.9 Manufacturing processes can use different hyaluronic acid substrates, hyaluronic acid concentrations, and types of crosslinking reactions in a variety of combinations, establishing a unique basis for each product. The crosslinking technologies associated with the products studied here include Cohesive Polydensified Matrix, Hylacross, Vycross, XpresHAn Technology, nonanimal stabilized hyaluronic acid, and Resilient Hyaluronic Acid.2
Functional Relevance of a Product's Rheologic and Physicochemical Properties
The form and extent of crosslinking together with the hyaluronic acid concentration (in milligrams per milliliter) largely determine the in vitro rheologic and physicochemical profile of the gel. The elastic modulus (G′), the viscous modulus (G″), the tan δ (G″/G′), and the complex modulus (G*) are the primary rheologic parameters used to characterize products (Fig. 1 and Table 1).3,4,9,12–16 All hyaluronic acid filler products possess a combination of viscoelastic properties, although most have a much higher G′ value relative to G″ value. The G′ captures the sum of numerous factors that affect gel strength (e.g., total hyaluronic acid concentration and degree of chemical crosslinking/chain entanglements); therefore, the G′ has become a relevant parameter used to differentiate products.
Fig. 1.
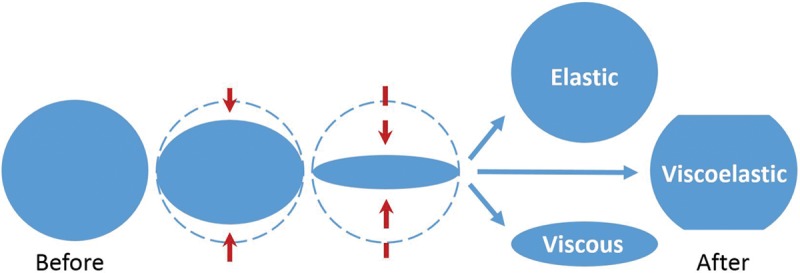
Schematic depicting rebound effect of elastic, viscous, and viscoelastic materials following deformation.
Table 1.
Rheologic and Physicochemical Properties Relevant to Hyaluronic Acid Gels
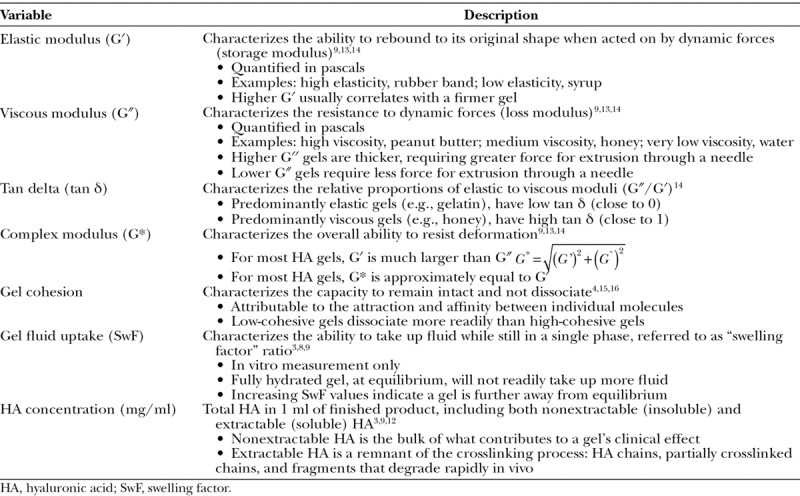
Also affected by the gel’s starting components and manufacturing process are its physicochemical properties, such as gel swelling factor and gel cohesion. Swelling factor, also referred to as gel fluid uptake, describes the ability of the gel to expand as it binds water while still maintain a single phase in vitro, commonly referred to as swelling factor (Table 1).3,8 The swelling factor measurement is indicative of a gel’s hydration (saturation) status. When near saturation (close to equilibrium), a gel will not exhibit appreciable swelling after injection. Below equilibrium (unsaturated), a gel will readily take up water from the surrounding fluid until it reaches hydration equilibrium.8,9 Gel fluid uptake characteristics vary from product to product and are dependent on hyaluronic acid concentration and limited by the physical constraints imposed by crosslinking. In general, as the extent of crosslinking is increased, G′ is increased and swelling factor is decreased.8
Although swelling factor has been misinterpreted as “tissue swelling” because of shared terminology, there are no clinical data linking the two. Furthermore, the factors that contribute to tissue swelling include injection technique, the rate of injection, injection plane, health/quality of the tissue, and the individual’s propensity for swelling.
Cohesion is a more recently explored property of hyaluronic acid gels and can be described as the force between particles that holds them together (Table 1).14 The strength of particle cohesion is a function of hyaluronic acid concentration and the crosslinking technology used, which forms the structural network of the gel. So far, gel cohesion has not earned scientific recognition as an appropriate property for product comparison due to the lack of standardized measurement technique, therefore, scientific opinions regarding its relevance are conflicting.4,14–17 Nevertheless, it has been suggested that products with high-cohesive properties are associated with a greater extent of integration (intradermally) and lift capacity.15,17 At present, the authors believe it is still important to report experimental data regarding this property, as the publication of data should help to elucidate appropriate measurement techniques and may help distinguish whether this property contributes to clinical performance.
Practical Reasons for Understanding a Product’s Rheologic and Physicochemical Properties
The medical community’s clearer understanding of the facial aging process has fostered more comprehensive approaches to the use of fillers for facial rejuvenation, and the range of product utility is continuously expanding with new-found uses. Currently, primary product indications include gel implantation into the superficial to mid dermis for fine to medium perioral rhytides, submucosal for lip volumization, the mid to deep dermis for moderate to severe wrinkles and folds (nasolabial folds), and the subcutaneous or supraperiosteal depth for cheek augmentation and volume restoration of midface contour deficiencies.16,19–25 Recent advancements include correction of the temple and infraorbital hollows; correction of infraorbital grooves; nose reshaping; and rejuvenation of nonfacial areas including the earlobe, foot pad, dorsum of the hand, décolletage, and many other areas of the body.26–30
No individual product is appropriate for every indication; therefore, developing a familiarity with how different rheologic and physicochemical properties potentially influence an aesthetic outcome is valuable insight. Such knowledge helps the injector tailor a treatment plan concerning the appropriate anatomical placement of specific products and appropriate depth of implantation, and may influence the choice of injection techniques used. So far, there are extensive in vitro data published on the comparative rheologic and physicochemical profiles of various products; however, there is only limited information on how these properties correspond to clinical performance in vivo.9,31–36 As clinical data are still lacking, author discussions that share the clinical experiences of experts in the field are necessary to bridge the knowledge gap between product properties and understanding a product’s potential range of uses in vivo.31,32,37,38
This overview presents the rheologic and physicochemical (swelling factor and cohesion) data collected for 18 different hyaluronic acid filler products available in the United States, Canada, and Europe. The Discussion section evaluates relationships between these properties and includes the clinical experience of contributing authors to help tie product characteristics with product use.
MATERIALS AND METHODS
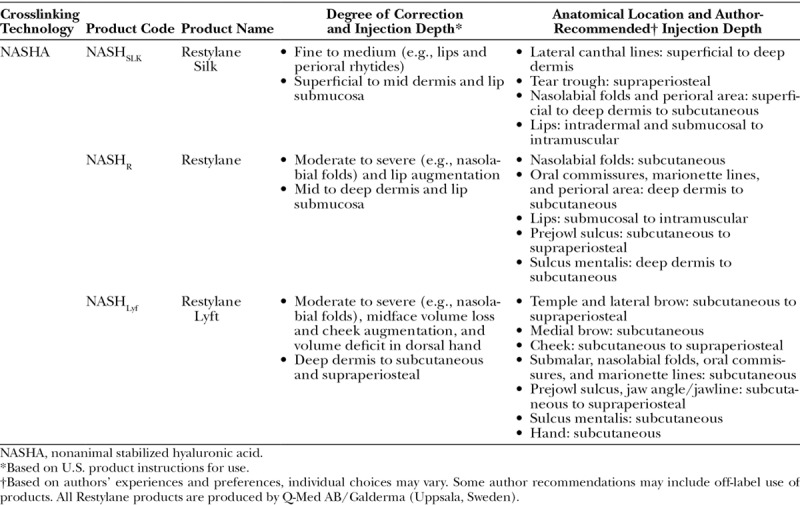
A list of 18 hyaluronic acid filler products and their product indications are shown in Tables 2 through 6. Belotero Balance is produced by Anteis, S.A. for Merz Pharma (Geneva, Switzerland); all Juvéderm products are produced by Allergan (Pringy, France); all Restylane products are produced by Q-Med AB/Galderma (Uppsala, Sweden); all Teosyal products are produced by Teoxane (Geneva, Switzerland).
Table 2.
Cohesive Polydensified Matrix Product Name, Corresponding Indications, and Author-Recommended Injection Depths

Table 6.
Resilient Hyaluronic Acid Product Names, Corresponding Indications, and Author-Recommended Injection Depths
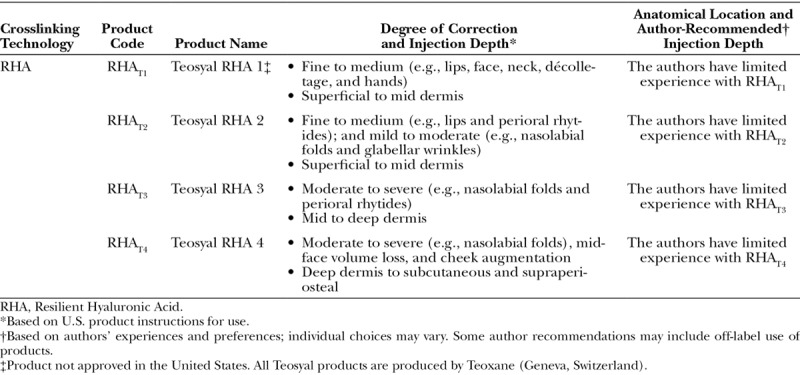
Table 4.
XpresHAn Product Names, Corresponding Indications, and Author-Recommended Injection Depths
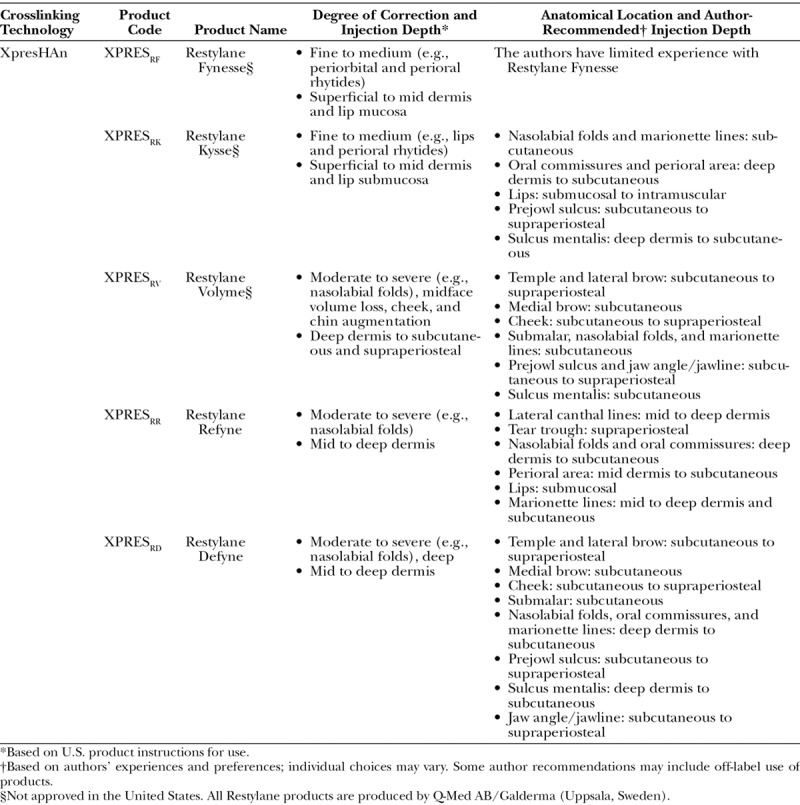
Table 5.
Nonanimal Stabilized Hyaluronic Acid Product Names, Corresponding Indications, and Author-Recommended Injection Depths
Rheologic Measurements
Rheologic measurements were determined using an Anton Paar MCR 301 rheometer (Anton Paar, Graz, Austria) equipped with a parallel plate geometry (plate diameter, 25 mm; gap, 1.0 mm) at 25°C.8 The frequency sweep was 10 to 0.1 Hz at 0.1 percent strain. A 30-minute period was used for relaxation of the sample between loading and measuring. The G′ and the G″ at 0.1 Hz were extracted from two measurements of each sample. It is important to note that G* and tan δ are the only parameters that result from the measurement, and all other rheologic parameters are subsequently derived from calculations involving G*, tan δ, and the frequency at which the measurement was made.
Physicochemical Property Measurement
Swelling Factor (Gel Fluid Uptake)
Using previously published methods, swelling factor was determined by dispersing 0.5 g of gel in saline by thorough mixing with 6 to 8 ml of saline, which was then brought up to 10 ml.3,8 The dispersion was performed by shaking the measuring glass until complete gel dispersion was achieved. The solution was permitted to swell to equilibrium for 3 to 5 hours, and mixed a second time. The volume of the swollen gel was measured after 16 hours of sedimentation. The value for swelling factor at equilibrium was then determined as final ml/g and calculated by V/V0, where V0 is the initial volume of the gel and V is the volume of the fully swollen gel.
Cohesion
Cohesion was determined using a previously published method that was determined as the method most closely aligned with the definition of cohesion declared by the International Union of Pure and Applied Chemistry.14,39 Gel samples were first prepared by gentle elimination of air bubbles by centrifugation in 1-ml glass syringes. Using a Luer-stub adapter, an 18-gauge cannula was mounted on each syringe, and a Zwick BTC-FR 2.5 materials tester (ZwickRoell GmbH & Co., Ulm, Germany) was used to extrude the gel at a constant speed of 7.5 mm/minute, yielding a volume flow of 0.24 ml/minute. Once a constant force was achieved, a minimum of 10 drops were collected, and the average drop weight (in milligrams) was then calculated.
RESULTS
Rheologic Properties
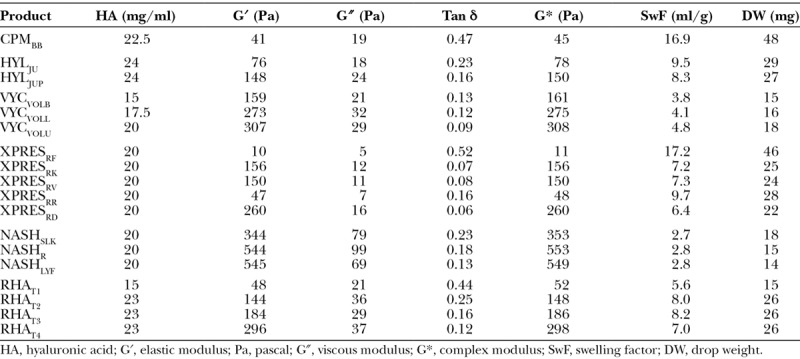
The rheologic and physicochemical property measurements for all 18 products evaluated are listed in Table 7. Among the 18 products evaluated here, the product measured with the lowest G′ was XPRESRF (10 Pa), whereas the one with the highest was NASHLYF (545 Pa), and the mid-range product was VYCVOLL (273 Pa). Similarly, the overall resistance to deformation (complex modulus, G*) was lowest for XPRESRF (11 Pa), highest for NASHR (553 Pa), and in the mid-range for VYCVOLL (275 Pa).
Table 7.
Rheologic and Physicochemical Property Data of 18 Hyaluronic Acid Filler Products
Swelling Factor (Gel Fluid Uptake)
The swelling factor data show that products with the lowest capacity to take up additional fluid were the nonanimal stabilized hyaluronic acid (2.7 to 2.8 ml/g) and Vycross (3.8 to 4.8 ml/g) products (Table 7). Those with the greatest fluid uptake capacity were the Cohesive Polydensified Matrix (16.9 ml/g) and XpresHAn product XPRESRF (17.2 ml/g).
Gel Cohesion
Gel cohesion data show that the products with the lowest cohesive properties (lowest drop weights) were the nonanimal stabilized hyaluronic acid products (14 to 18 mg), RHAT1 (15 mg), and the Vycross (15 to 18 mg) products. Those with the highest cohesive properties were CPMBB (48 mg) and XPRESRF (46 mg) (Table 7).
DISCUSSION
Rheologic Properties
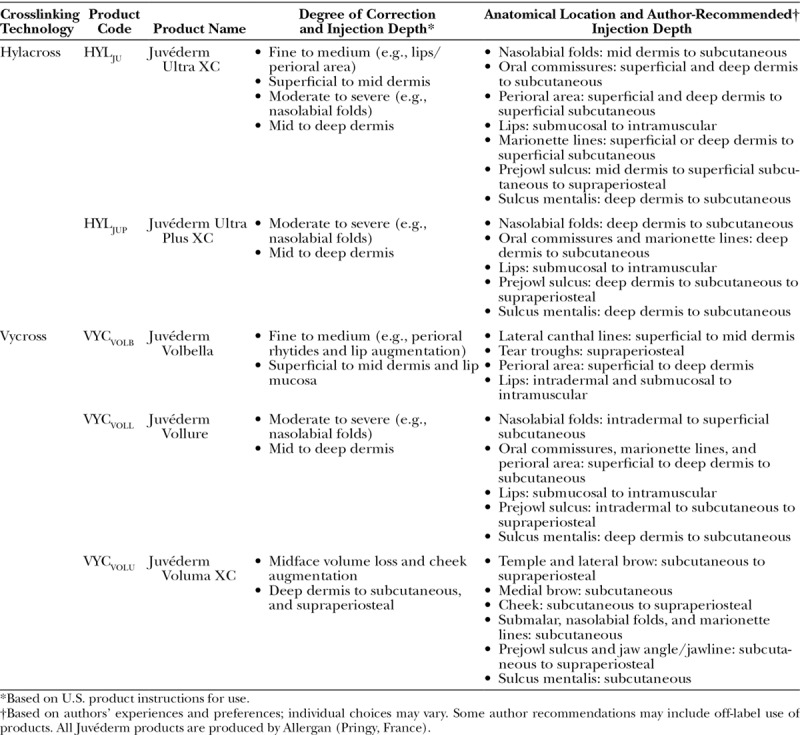
The rheologic data summarized in Table 7 demonstrate how the viscoelastic properties can vary substantially between products and between manufacturing technologies. The rheologic parameter G′ is frequently used to differentiate products, as it reflects a product’s most relevant property when considering use in vivo. In general, higher G′ products are firmer, with a more elastic response to compression, whereas lower G′ products are softer and less elastic.8,13 Although not absolute, product indications that describe plane of injection generally follow a trend where the plane of injection corresponds with a G′ for which it may be best suited. For example, among the products listed here, VYCVOLU, XPRESRV, NASHR, NASHLYF, and RHAT4 are all products with indications that include subcutaneous and supraperiosteal injection planes (Tables 3 through 6) that have correspondingly high G′ values (Table 7).
Table 3.
Hylacross and Vycross Product Names, Corresponding Indications, and Author-Recommended Injection Depths
So far, our understanding of the manufacturing elements that affect G′ is more advanced than for those that affect swelling factor or cohesion. Therefore, it may be useful to look for potential relationships between these different properties to help further their understanding. Because it is possible that one or more of those factors may also affect these physicochemical properties, observable relationships between rheologic and physicochemical properties are of interest to evaluate in an effort to understand them better.
Swelling Factor (Gel Fluid Uptake)
Measurement of swelling factor (Table 7) showed that the products with the lowest fluid uptake capacity were the nonanimal stabilized hyaluronic acid and Vycross products (2.7 to 2.8 ml/g and 3.8 to 4.1 ml/g, respectively). This observation was expected because their higher G′ properties (159 to 307 Pa and 344 to 545 Pa, respectively) are potentially reflective of a tighter (stronger) gel network and should demonstrate an inverse relationship with the gel’s expansion ability.8 Conversely, the highest swelling factor was demonstrated by CPMBB and XPRESRF (16.9 and 17.2 ml/g, respectively), which are also the two products with the lowest G′ (41 and 10 Pa, respectively).
The strongest evidence of this kind of trend was observed with the XpresHAn products (Fig. 2). The observed trend seen with lower G′ products having higher swelling factor and higher G′ products having lower swelling factor is also not surprising, as the ability of a gel to take up fluid will be limited by the extent to which the gel is crosslinked. In general, softer gels have a lower degree of crosslinking, and firmer gels have more crosslinking. However, the relationship between G′ and swelling factor appeared to be most applicable only when evaluating products of the same hyaluronic acid concentration and manufactured using the same process (e.g., Hylacross, Vycross, nonanimal stabilized hyaluronic acid).
Fig. 2.
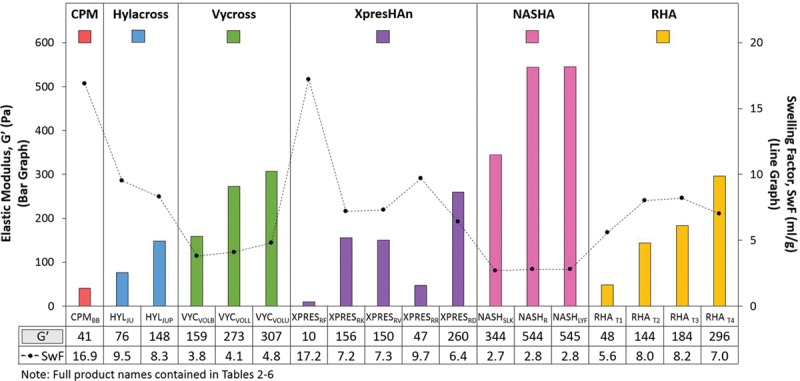
The relationship between G′ and swelling factor (SwF) appeared most consistent only when evaluating products of the same hyaluronic acid concentration and manufacturing process, which showed that a higher swelling factor was associated with lower G′ and a lower swelling factor was associated with higher G′. Rheologic measurements were performed in a sequence that included a relaxation time of 30 minutes, a frequency sweep from 10 to 0.1 Hz at 0.1 percent strain, followed by an amplitude sweep from 0.1 to 10,000 percent (0.001 to 100) strain at 1 Hz. The gap was 1 mm using a PP25 measuring system at 25°C. Swelling factor was determined by dispersing 0.5 g of gel in saline by thorough mixing with 10 ml of 0.9% sodium chloride. The sample was shaken until dispersed and swollen to equilibrium. Swelling factor was calculated as the swollen volume (in milliliters) divided by tested weight of product (in grams).
Because hyaluronic acid concentration (in milligrams per milliliter) can also influence fluid uptake, a possible trend between swelling factor and hyaluronic acid concentration was also examined. Most of the products evaluated, except for those made with Vycross technology, had similar hyaluronic acid concentrations (20 to 24 mg/ml), and a relationship between isolated hyaluronic acid concentration and swelling factor was not demonstrated (Fig. 3).
Fig. 3.
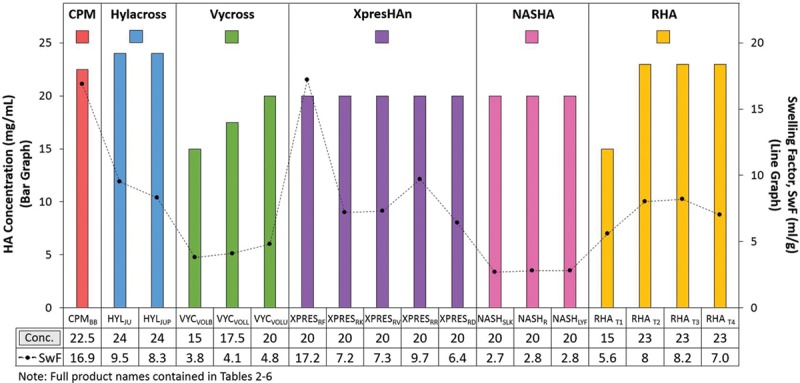
The relationship between isolated product hyaluronic acid (HA) concentration and swelling factor (SwF) was not demonstrated. Hyaluronic acid concentration was calculated from a standard curve with the absorbance of known amounts of glucuronic acid. Product was degraded to monosaccharides with acid and the concentration of one of the disaccharide units, glucuronic acid, was measured using spectrophotometry. Swelling factor was determined by dispersing 0.5 g of gel in saline by thorough mixing with 10 ml of 0.9% sodium chloride. The sample was shaken until dispersed and swollen to equilibrium. Swelling factor was calculated as the swollen volume (in milliliters) divided by tested weight of product (in grams).
Gel Cohesion
If considered together, the G′ and cohesion data shown in Table 7 suggest that as G′ decreases the gel may exhibit more cohesive properties (higher drop weight) (Fig. 4). This relationship appeared to exist only among products produced by the same technology but was not consistent across manufacturing technologies. Interestingly, an inverse relationship between cohesion and rheology was found in an earlier study in which the products manufactured by XpresHAn and nonanimal stabilized hyaluronic acid technologies were evaluated and can still be observed here.14 When evaluating possible relationship trends between concentration and cohesion, no trends were
Fig. 4.
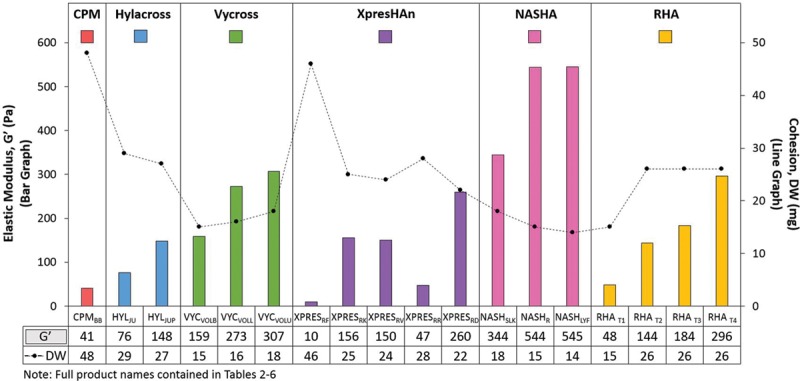
In general, as G′ decreases, the product may exhibit more cohesive properties (higher drop weight). Rheologic measurements were performed in a sequence that included a relaxation time of 30 minutes, a frequency sweep from 10 to 0.1 Hz at 0.1 percent strain, followed by an amplitude sweep from 0.1 to 10,000 percent (0.001 to 100) strain at 1 Hz. The gap was 1 mm using a PP25 measuring system at 25°C. Cohesion was measured as drop weight of the samples. Gel was extruded at a constant speed (7.5 mm/minute) from an 18-gauge cannula. Once a constant force was achieved, at least 10 fragments (drops) were collected, and average drop weight (in milligrams) was calculated.
distinguishable (Fig. 5). Because rheologic properties are somewhat concentration dependent, the weaker relationship seen with lower concentration products such as VYCVOLB and RHAT1 (Table 7) was not surprising. However, when looking only at products with the same concentration (i.e., XpresHAn and nonanimal stabilized hyaluronic acid), the relationship between cohesion and G′ appears stronger. In the future, if the cumulative scientific evidence supports an inverse relationship between G′ and cohesion, this property may be more predictable, negating a need to further clarify it.
Fig. 5.
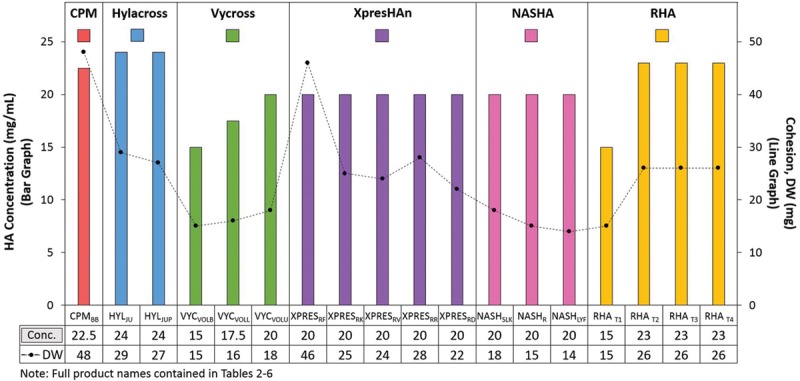
The relationship between isolated product hyaluronic acid concentration and cohesion (drop weight method) was not demonstrated. Hyaluronic acid concentration was calculated from a standard curve with the absorbance of known amounts of glucuronic acid. Product was degraded to monosaccharides with acid and the concentration of one of the disaccharide units, glucuronic acid, is measured using spectrophotometry. Cohesion was measured as drop weight of the samples. Gel was extruded at a constant speed (7.5 mm/minute) from an 18-gauge cannula. Once a constant force was achieved, at least 10 fragments (drops) were collected, and average drop weight (in milligrams) was calculated.
While the importance of this property is still evolving, it has been reported that hyaluronic acid filler products with high cohesive properties demonstrate a greater extent of integration intradermally.15,17 One suggested rationale for this observation may be that products with high cohesion, which are also low G′ (softer gels), may facilitate an ability to deform and squeeze more easily into smaller compartments in the tissue in comparison with a firmer product.14 For now, the absence of a standard evaluation method for cohesion limits the scientific community’s ability to advance our understanding of this property.
In Vivo Factors Relevant to Product Selection
In vivo, a combination of two types of forces acts on implanted hyaluronic acid filler products: (1) lateral shear or torsion forces and (2) stretch/compression forces (Fig. 6).40 The degree to which these forces act on the product depends on several factors such as the plane of injection (i.e., superficial versus deep) and the anatomical location (i.e., tear trough, malar cheek, perioral region). Although product indications and instructions for use are important for characterizing a product’s commercial identity, the skills necessary to create an aesthetic effect mean that much of the product’s actual use is in the hands of the injector. Summarized in Tables 2 through 6 are the author-recommended injection planes for a variety of anatomical locations.
Fig. 6.
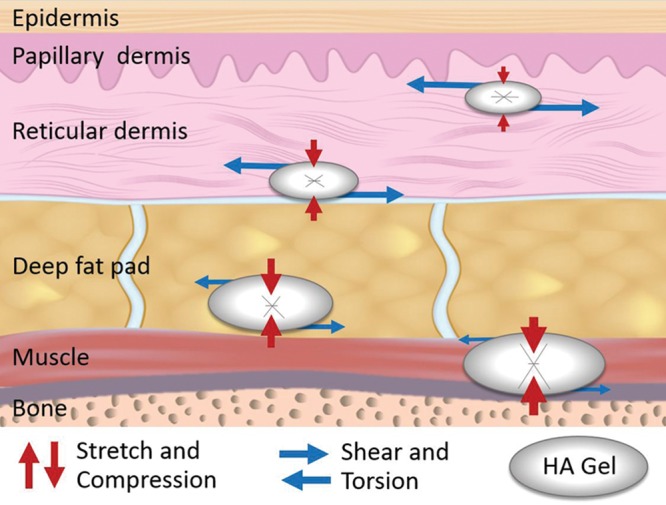
Dynamic forces that contribute to deformation of hyaluronic acid filler products implanted in the superficial (dermis) and deep planes (deep fat pad and supraperiosteal) of soft tissues.
Selecting G′ Based on Skin Quality
Additional factors to keep in mind regarding clinical outcomes also include skin quality (e.g., laxity) and degree of correction needed. These variables will potentially differ significantly between patients, and their specific nature will determine not only what degrees of gel strength and firmness are appropriate but also whether a targeted or distributed placement of gel is most effective. The contributing authors agree that for patients with thinner skin, where product palpability/visibility is an important consideration, products with lower G′ values are generally most appropriate. Lower G′ products are softer and more easily distributed in the tissue. Although not among the lowest G′ products, VYCVOLL, XPRESRD, and NASHSLK would still be considered appropriate for thinner skin and would still be able to achieve lift and projection with a natural appearance because the products are soft enough to distribute well in the tissue.
Selecting G′ Based on Degree of Correction and Plane of Injection
In general, products with higher G′ values are firmer, are indicated for deeper planes of injection, and support a greater degree of correction, whereas lower G′ (softer) products are indicated for more superficial planes of injection and less severe corrections. The higher G′ products are also best for corrective needs where deep, targeted product deposition and less distribution are necessary to achieve lift and projection. For areas such as the malar cheek, chin, and jawline, where the product can be placed against the bone for projection, a higher G′ product will provide a greater advantage over a lower G′ product because it will have greater resistance to the compressive forces inherent in the deeper injection plane. Although lower G′ products are generally indicated for more superficial planes of injection (or areas with less corrective need), they can still be used in deeper planes to achieve a clinical effect, but larger volumes will be required than with a higher G′ product. Alternatively, lower G′ products may be layered on top of higher G′ products.
Selecting G′ Based on Specific Anatomical Location
For optimal corrective results of mild tear troughs in patients with thinner or transparent skin, the authors use a lower G′ product (e.g., VYCVOLB or XPRESRR) because it distributes and integrates well; however, for deeper tear troughs, a higher G′ product with greater lift capacity such as NASHR is an ideal option. When effective lift and projection of the malar cheek are desired in patients who have adequately thick skin and subcutaneous tissue quality, VYCVOLU and NASHLYF are optimal choices. Regardless of skin quality, intermediate G′ products are a more effective solution for the nasolabial folds and in the marionette/melomental region where product visibility on facial animation may be a concern. The intermediate G′ products VYCVOLL and XPRESRD are also good options for areas of “facial animation” and for support and contouring in areas such as the midface.
The correction of perioral rhytides (barcode lines) presents a unique structural challenge, as perioral rhytides are prone to dynamic stress in an area that may not have adequate skin thickness. A higher G′ product is desirable for this challenge. However, placing a firm product deep enough beneath the wrinkle to avoid product palpability/visibility will often not correct the “defect” but only give more anterior (visible) projection to the rhytide. In the authors’ experience, NASHASIL, in small aliquot doses, is a good option for superficial and mid-dermis injections for correction of “stiff” perioral rhytides and fine oral commissures (that do not correct when the skin is stretched). Alternatively, if the rhytides are easily effaced when the skin is stretched, a lower G′ product (softer gel) such as CPMBB, VYCVOLB, or XPRESRR may be a suitable alternative.
CONCLUSIONS
Until enough clinical experience is gained, differentiating products by their rheologic and physicochemical properties may serve as a useful way to select which products are most suitable for a given clinical need. Among the variety of parameters used to differentiate products, G′ (elastic modulus) seems to be the most widely used and perhaps is the most logical, as it represents the product’s predominant rheologic property. Although physicochemical properties are also valuable means for product differentiation, the lack of standard measurement techniques among different researchers remains an obstacle for true comparison between products. The ability to find trends between a product’s rheologic and physicochemical parameters appears to be strongest among products of similar concentrations and those produced by the same technology, but not between manufacturing technologies.
Although there is a wide body of literature describing how such data can be used to characterize different hyaluronic acid products, there are very few studies that correlate in vitro measurements with in vivo performance. There are potentially many different properties that impact product characteristics, and future studies may help to correlate product properties with clinical experiences. Ultimately, there are no substitutes for all the technical nuances learned through practical experience. In the absence of data, author discussions that provide practical experience with specific product attributes and techniques as they relate to clinical performance are tremendously valuable. The data and discussion topics presented here represent a source of practical information intended to educate and assist clinicians and injectors in selecting the products best suited to the needs of each patient. Some author recommendations may include off-label use of products.
ACKNOWLEDGMENTS
The authors acknowledge Q-Med AB/Galderma, Uppsala, Sweden, for providing the data for all products presented. The authors thank Åke Öhrlund and Per Winlöf (Q-Med/Galderma) for technical expertise and scientific input; and Alessandra Nogueira, M.D., and Lynette Arlati, M.S.N., F.N.P.-B.C. (Galderma Laboratories, L.P., Fort Worth, Texas), for sharing their clinical expertise in the preparation of this article.
Footnotes
Disclosure: S. Fagien is a paid speaker, consultant, and clinical trial investigator for Galderma and a paid speaker, consultant, and clinical trial investigator for Allergan. V. Bertucci is a paid clinical trial investigator, consultant, and speaker for Galderma, Allergan, and Merz and a consultant for Prollenium and Teoxane. E. von Grote and J.H. Mashburn were employees of Galderma Laboratories, L.P. (Fort Worth, Texas) at the time of article preparation.
REFERENCES
- 1.International Society of Aesthetic Plastic Surgery. ISAPS global statistics. Available at: http.www.isaps.org/news/isaps-global-statistics. Accessed February 1, 2019. [PubMed]
- 2.Micheels P, Sarazin D, Tran C, Salomon D. Effect of different crosslinking technologies on hyaluronic acid behavior: A visual and microscopic study of seven hyaluronic acid gels. J Drugs Dermatol. 2016;15:600–606. [PubMed] [Google Scholar]
- 3.Öhrlund JÅ, Edsman KL. The myth of the “biphasic” hyaluronic acid filler. Dermatol Surg. 2015;41(Suppl 1):S358–S364. [DOI] [PubMed] [Google Scholar]
- 4.Borrell M, Leslie DB, Tezel A. Lift capabilities of hyaluronic acid fillers. J Cosmet Laser Ther. 2011;13:21–27. [DOI] [PubMed] [Google Scholar]
- 5.Lorenc ZP, Fagien S, Flynn TC, Waldorf HA. Clinical application and assessment of Belotero: A roundtable discussion. Plast Reconstr Surg. 2013;132(XXXSuppl 2):69S–76S. [DOI] [PubMed] [Google Scholar]
- 6.Borzacchiello A, Russo L, Malle BM, Schwach-Abdellaoui K, Ambrosio L. Hyaluronic acid based hydrogels for regenerative medicine applications. Biomed Res Int. 2015;2015:871218. [DOI] [PMC free article] [PubMed] [Google Scholar]
- 7.La Gatta A, Papa A, Schiraldi C, De Rosa M. Comparative analysis of commercial dermal fillers based on crosslinked hyaluronan: Physical characterization and in vitro enzymatic degradation. Poly Degrad Stab. 2011;96:630–636. [Google Scholar]
- 8.Edsman K, Nord LI, Ohrlund A, Lärkner H, Kenne AH. Gel properties of hyaluronic acid dermal fillers. Dermatol Surg. 2012;38:1170–1179. [DOI] [PubMed] [Google Scholar]
- 9.Kablik J, Monheit GD, Yu L, Chang G, Gershkovich J. Comparative physical properties of hyaluronic acid dermal fillers. Dermatol Surg. 2009;35(Suppl 1):302–312. [DOI] [PubMed] [Google Scholar]
- 10.Kenne L, Gohil S, Nilsson EM, et al. Modification and cross-linking parameters in hyaluronic acid hydrogels: Definitions and analytical methods. Carbohydr Polym. 2013;91:410–418. [DOI] [PubMed] [Google Scholar]
- 11.Öhrlund Å. Lifting capacity of hyaluronic acid (HA) dermalaluronic acid (HA) dermal fillers. Poster presentation at: 8th Anti-aging Medicine World Congress; April 8–10, 2010; Monte Carlo, Monaco. [Google Scholar]
- 12.Stocks D, Sundaram H, Michaels J, Durrani MJ, Wortzman MS, Nelson DB. Rheological evaluation of the physical properties of hyaluronic acid dermal fillers. J Drugs Dermatol. 2011;10:974–980. [PubMed] [Google Scholar]
- 13.Lorenc ZP, Öhrlund Å, Edsman K. Factors affecting the rheological measurement of hyaluronic acid gel fillers. J Drugs Dermatol. 2017;16:876–882. [PubMed] [Google Scholar]
- 14.Edsman KL, Wiebensjö ÅM, Risberg AM, Öhrlund JÅ. Is there a method that can measure cohesivity? Cohesion by sensory evaluation compared with other test methods. Dermatol Surg. 2015;41(Suppl 1):S365–S372. [DOI] [PubMed] [Google Scholar]
- 15.Flynn TC, Sarazin D, Bezzola A, Terrani C, Micheels P. Comparative histology of intradermal implantation of mono and biphasic hyaluronic acid fillers. Dermatol Surg. 2011;37:637–643. [DOI] [PubMed] [Google Scholar]
- 16.Merz Pharma GmbH Co. Belotera Balance. Available at: http://www.belotero.com/wp-content/uploads/EM00494-05.pdf. Accessed August 1, 2018.
- 17.Tran C, Carraux P, Micheels P, Kaya G, Salomon D. In vivo bio-integration of three hyaluronic acid fillers in human skin: A histological study. Dermatology 2014;228:47–54. [DOI] [PubMed] [Google Scholar]
- 18.Sundaram H, Rohrich RJ, Liew S, et al. Cohesivity of hyaluronic acid fillers: development and clinical implications of a novel assay, pilot validation with a five-point grading scale, and evaluation of six U.S. Food and Drug Administration-approved fillers. Plast Reconstr Surg. 2015;136:678–686. [DOI] [PubMed] [Google Scholar]
- 19.Allergan, Inc. Juvéderm. Available at: http://www.allergan.com/products/key-products/product-prescribing/labeling/juvederm%C2%AE-injectable-gels-usa. Accessed August 1, 2018.
- 20.Allergan, Inc. Juvéderm Volift. Available at: http://www.allergan.com.au/en-au/products/list/juvederm-volift. Accessed August 1, 2018.
- 21.Galderma. Restylane. Available at: https://restylane.co.uk/our-new-branding. Accessed August 1, 2018.
- 22.Galderma. Restylane silk. Available at: http://www.galdermausa.com/IFU/Restylane_Silk_IFU.pdf. Accessed August 1, 2018.
- 23.Galderma. Restylane. Available at: Restylane. http://www.galdermausa.com/IFU/Restylane_IFU.pdf. Accessed February 24, 2019.
- 24.Galderma. Restylane Lyft. Available at: http://galdermausa.com/downloads/Restylane_Lyft_IFUOriginal.PDF. Accessed February 24, 2019.
- 25.Teoxane Laboratories. Teoxane. Available at: https://www.teoxane.com/en/ifu. Accessed August 1, 2018.
- 26.Sykes JM, Cotofana S, Trevidic P, et al. Upper face: Clinical anatomy and regional approaches with injectable fillers. Plast Reconstr Surg. 2015;136(Suppl):204S–218S. [DOI] [PubMed] [Google Scholar]
- 27.Muhn C, Rosen N, Solish N, et al. The evolving role of hyaluronic acid fillers for facial volume restoration and contouring: A Canadian overview. Clin Cosmet Investig Dermatol. 2012;5:147–158. [DOI] [PMC free article] [PubMed] [Google Scholar]
- 28.Kurkjian TJ, Ahmad J, Rohrich RJ. Soft-tissue fillers in rhinoplasty. Plast Reconstr Surg. 2014;133:121e–126e. [DOI] [PubMed] [Google Scholar]
- 29.Alam M, Omura N, Kaminer MS. Subcision for acne scarring: Technique and outcomes in 40 patients. Dermatol Surg. 2005;31:310–317; discussion 317. [DOI] [PubMed] [Google Scholar]
- 30.Streker M, Reuther T, Krueger N, Kerscher M. Stabilized hyaluronic acid-based gel of non-animal origin for skin rejuvenation: Face, hand, and décolletage. J Drugs Dermatol. 2013;12:990–994. [PubMed] [Google Scholar]
- 31.Sundaram H, Cassuto D. Biophysical characteristics of hyaluronic acid soft-tissue fillers and their relevance to aesthetic applications. Plast Reconstr Surg. 2013;132(Suppl 2):5S–21S. [DOI] [PubMed] [Google Scholar]
- 32.Monheit GD, Baumann LS, Gold MH, et al. Novel hyaluronic acid dermal filler: Dermal gel extra physical properties and clinical outcomes. Dermatol Surg. 2010;36(Suppl 3):1833–1841. [DOI] [PubMed] [Google Scholar]
- 33.Sundaram H, Voigts B, Beer K, Meland M. Comparison of the rheological properties of viscosity and elasticity in two categories of soft tissue fillers: Calcium hydroxylapatite and hyaluronic acid. Dermatol Surg. 2010;36(Suppl 3):1859–1865. [DOI] [PubMed] [Google Scholar]
- 34.Santoro S, Russo L, Argenzio V, Borzacchiello A. Rheological properties of cross-linked hyaluronic acid dermal fillers. J Appl Biomater Biomech. 2011;9:127–136. [DOI] [PubMed] [Google Scholar]
- 35.Pierre S, Liew S, Bernardin A. Basics of dermal filler rheology. Dermatol Surg. 2015;41(Suppl 1):S120–S126. [DOI] [PubMed] [Google Scholar]
- 36.Hee CK, Shumate GT, Narurkar V, Bernardin A, Messina DJ. Rheological properties and in vivo performance characteristics of soft tissue fillers. Dermatol Surg. 2015;41(Suppl 1):S373–S381. [DOI] [PubMed] [Google Scholar]
- 37.Matarasso SL, Carruthers JD, Jewell ML; Restylane Consensus Group. Consensus recommendations for soft-tissue augmentation with nonanimal stabilized hyaluronic acid (Restylane). Plast Reconstr Surg. 2006;117(Suppl):3S–34S; discussion 35S43S. [DOI] [PubMed] [Google Scholar]
- 38.Sundaram H, Monheit GD, Goldman MH, Solish N. Clinical experiences with hyaluronic acid fillers: Roundtable discussion. J Drugs Dermatol. 2012;11:15–27. [PubMed] [Google Scholar]
- 39.McNaught D, Wilkinson A; IUPAC. Compendium of Chemical Terminology. 1997. Oxford: Blackwell Scientific Publications; Available at: http://goldbook.iupac.org. Accessed August 1, 2018. [Google Scholar]
- 40.Gavard Molliard S, Albert S, Mondon K. Key importance of compression properties in the biophysical characteristics of hyaluronic acid soft-tissue fillers. J Mech Behav Biomed Mater. 2016;61:290–298. [DOI] [PubMed] [Google Scholar]


