Abstract
BACKGROUND
Therapeutic vaccinations against cancer have mainly targeted differentiation antigens, cancer-testis antigens, and overexpressed antigens and have thus far resulted in little clinical benefit. Studies conducted by multiple groups have demonstrated that T cells recognizing neoantigens are present in most cancers and offer a specific and highly immunogenic target for personalized vaccination.
METHODS
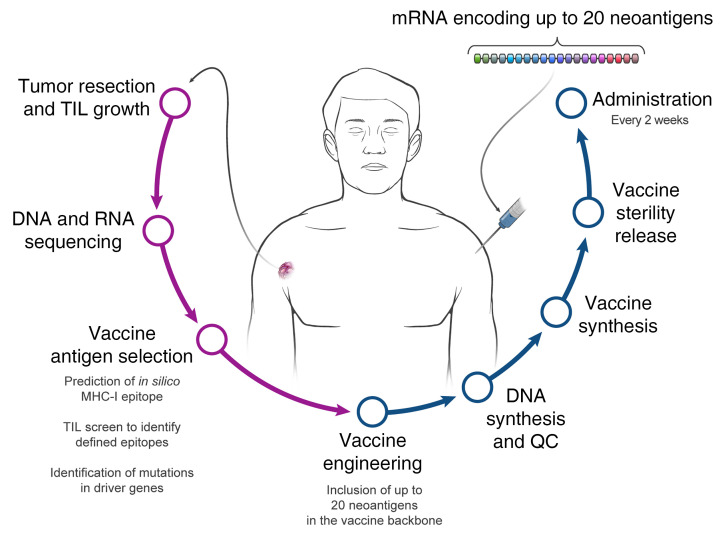
We recently developed a process using tumor-infiltrating lymphocytes to identify the specific immunogenic mutations expressed in patients’ tumors. Here, validated, defined neoantigens, predicted neoepitopes, and mutations of driver genes were concatenated into a single mRNA construct to vaccinate patients with metastatic gastrointestinal cancer.
RESULTS
The vaccine was safe and elicited mutation-specific T cell responses against predicted neoepitopes not detected before vaccination. Furthermore, we were able to isolate and verify T cell receptors targeting KRASG12D mutation. We observed no objective clinical responses in the 4 patients treated in this trial.
CONCLUSION
This vaccine was safe, and potential future combination of such vaccines with checkpoint inhibitors or adoptive T cell therapy should be evaluated for possible clinical benefit in patients with common epithelial cancers.
TRIAL REGISTRATION
Phase I/II protocol (NCT03480152) was approved by the IRB committee of the NIH and the FDA.
FUNDING
Center for Clinical Research, NCI, NIH.
Keywords: Oncology, Vaccines
Keywords: Cancer immunotherapy
Introduction
Protective vaccination against infectious diseases has proven to be one of the most effective health measures in medicine; however, therapeutic vaccination against established diseases such as persistent infections and cancer has proven more challenging. Cancer vaccines are designed to target antigens that can elicit selective immune responses against cancer cells and not normal cells. Until recently, therapeutic vaccines against nonviral tumors mainly targeted differentiation antigens, cancer-testis antigens, and/or overexpressed antigens, but with little clinical impact (1).
In recent years, our group and others have extensively studied the importance of neoantigens as targets for immunotherapy (2–7). It is now clear that neoantigen-specific T cells are present in most cancers. Neoantigens derived from somatic mutations offer a specific and highly immunogenic target for vaccination, and the recent development of rapid and relatively inexpensive technologies for DNA sequencing has facilitated the identification of those targets (2).
Several studies recently reported the vaccination of melanoma patients with neoantigen vaccines (8–10). Although T cell responses could be elicited against a subset of the candidate neoantigens evaluated in these trials, functional validation, including analysis of the ability of T cells to recognize naturally processed and presented antigens, was only carried out for a limited number of reactivities. Although these trials demonstrated the feasibility, safety, and immunogenicity of such vaccines, clear evidence of their clinical efficacy is lacking. An immunogenic vaccination platform capable of encoding multiple tumor-relevant antigens that can be manufactured in a personalized setting is essential for developing neoantigen vaccines for patients with the common epithelial cancers. Furthermore, the selection of vaccine neoantigens that are relevant and immunogenic remains a major hurdle. Here, we developed a pipeline for the selection of defined vaccine neoantigens expressed by the autologous cancer and recognized by the patient’s tumor-infiltrating lymphocytes (TILs) that were functionally tested for their immunogenicity. This vaccine, named mRNA-4650, is composed of an mRNA backbone encoding up to 20 different antigens. In addition to the defined antigens, the vaccine backbone contains any mutation in TP53, KRAS, or PIK3CA identified by exome sequencing of the autologous tumor and up to 15 HLA class I candidate neoantigens that were predicted to bind to a patient’s MHC alleles. We vaccinated patients under the clinical trial NCI-18-C-0072 and evaluated the safety, immunogenicity, and clinical efficacy of the personalized mRNA vaccine.
Results
Patients and methods.
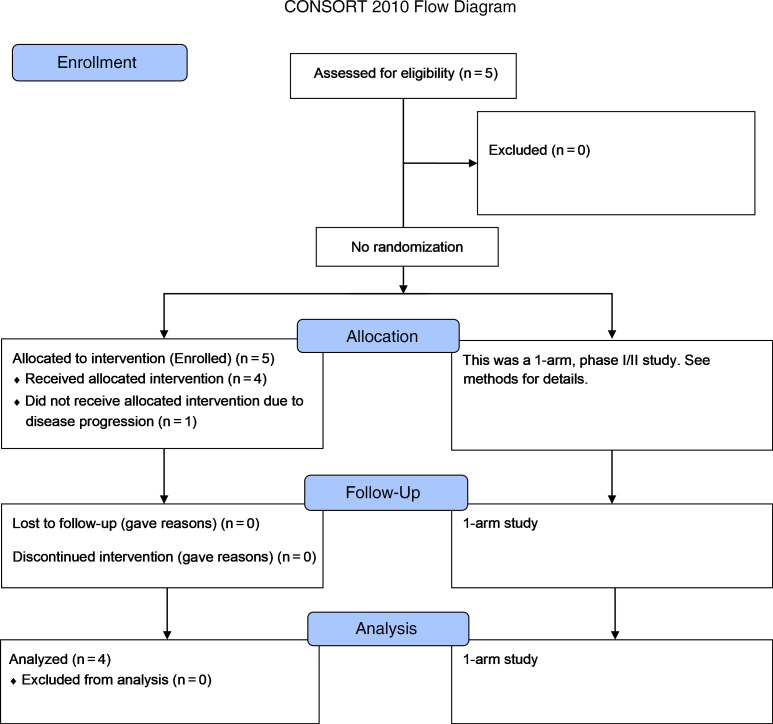
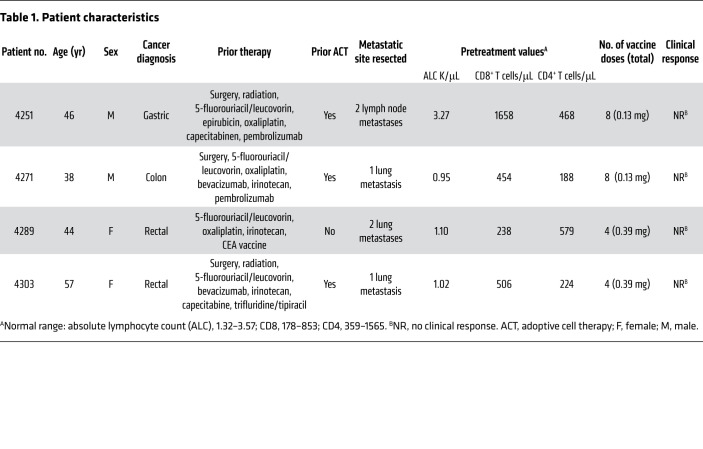
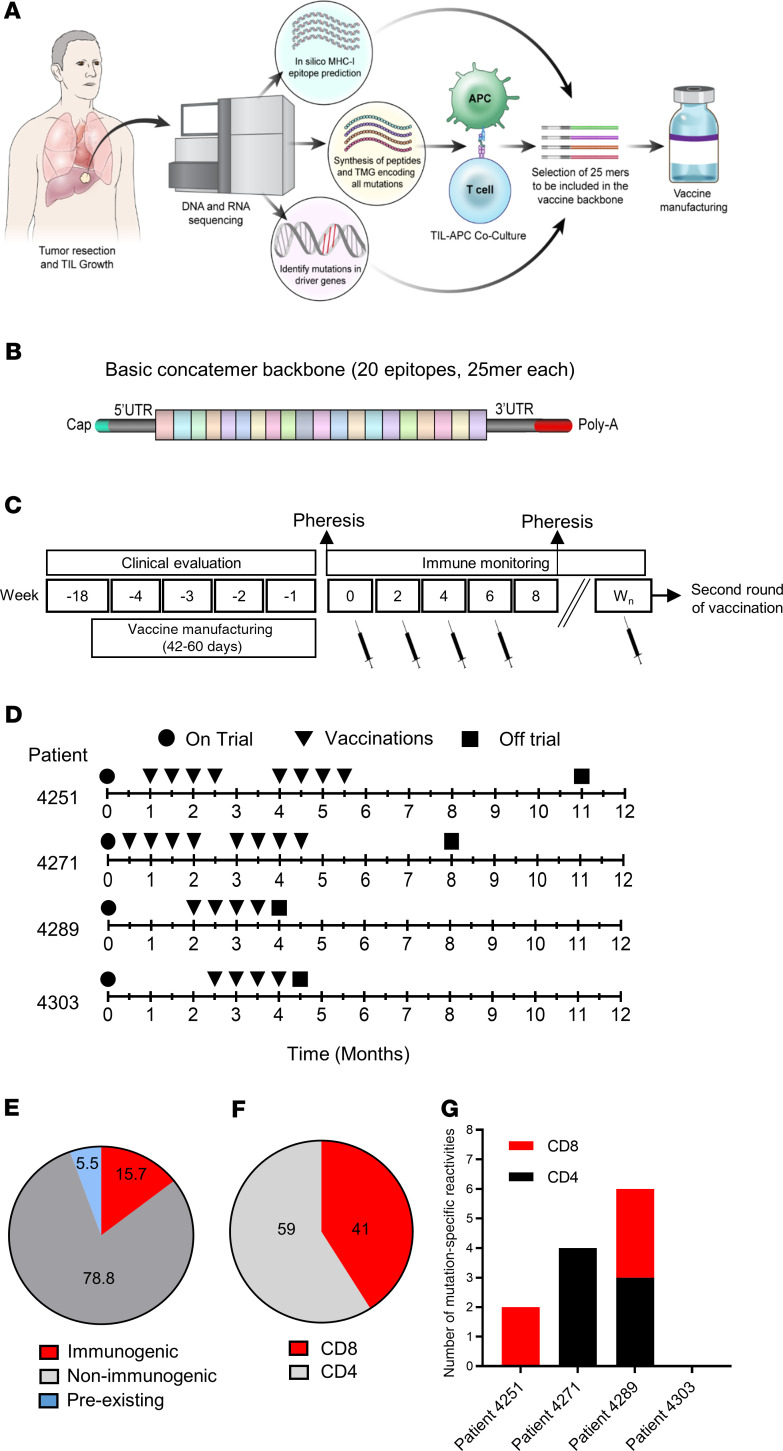
Between March 29, 2018, and November 13, 2019, four patients with metastatic gastrointestinal (GI) cancer were treated with an mRNA vaccine encoding neoantigens expressed by the autologous cancer (see CONSORT diagram in Figure 1). The baseline characteristics for each patient are listed in Table 1. All patients were diagnosed and heavily pretreated with multiple agents. Three of 4 patients (patients 4251, 4271, and 4303) were previously treated by us with TILs. Two patients (4251 and 4271) had previously received an anti–programmed cell death 1 (anti–PD-1) agent. Patients were treated with an mRNA vaccine encoding a combination of defined neoantigens expressed by the autologous cancer, mutations in expressed driver genes, and HLA-I–predicted immunogenic mutations (Figure 2A). To identify defined antigens, the metastatic tumor was harvested, and TILs were grown for future testing. Each excised tumor and a paired PBMC sample were sequenced to identify tumor-specific mutations. Neoantigens recognized by autologous TILs were identified by high-throughput immunologic screening using long peptides and tandem minigenes (TMGs) covering all mutated epitopes, as previously described (2, 11). In addition to the defined antigens, we also included any mutation in the TP53, KRAS, or PIK3CA driver genes and up to 15 in silico–predicted HLA-I potential neoantigens. Sequences composed of 25 aa with the mutation flanked by 12 normal aa on each side were electronically submitted to Moderna Therapeutics for the manufacturing of a TMG-based vaccine (Figure 2B). The turnaround time for all vaccines was between 42 and 60 days. Once ready, the vaccines were shipped, and the patients were vaccinated at the NIH Clinical Center. The patients were vaccinated intramuscularly 4 times at 2-week intervals (Figure 2, C and D). Patients 4251 and 4271 were treated with 0.13 mg mRNA vaccine, and patients 4289 and 4303 with 0.39 mg. In all 4 patients, we observed grade 1 and 2 toxicities that rapidly resolved and no grade 3 or severe adverse events (SAEs) (Supplemental Table 1; supplemental material available online with this article; https://doi.org/10.1172/JCI134915DS1). As shown in Figure 2E, a total of 15.7% of the potential neoantigens induced specific T cell immunity; of those, 59% were CD4 epitopes and 41% were CD8 epitopes (Figure 2F). The number of mutations induced by the vaccine was 2 for patient 4251, 4 for patient 4271, and 6 for patient 4289 (Figure 2G).
Figure 1. CONSORT diagram of the clinical study.
Description of the clinical trial.
Table 1. Patient characteristics.
Figure 2. Vaccine design, prior treatments, and safety.
(A) Illustration of the pipeline used to select the vaccine antigens. (B) The basic concatemer vaccine structure. (C) Overview of the vaccination schedule and immune monitoring. Wn, week number. (D) Patient-specific timeline of clinical trial progression. (E) Summary of preexisting, immunogenic, and nonimmunogenic vaccine antigens. (F) Percentage of neoantigen-specific CD8+ and CD4+ T cells from all patients. (G) Number of neoantigen-specific reactivities found in each patient.
Immunogenicity of mRNA-4650 in patient 4251.
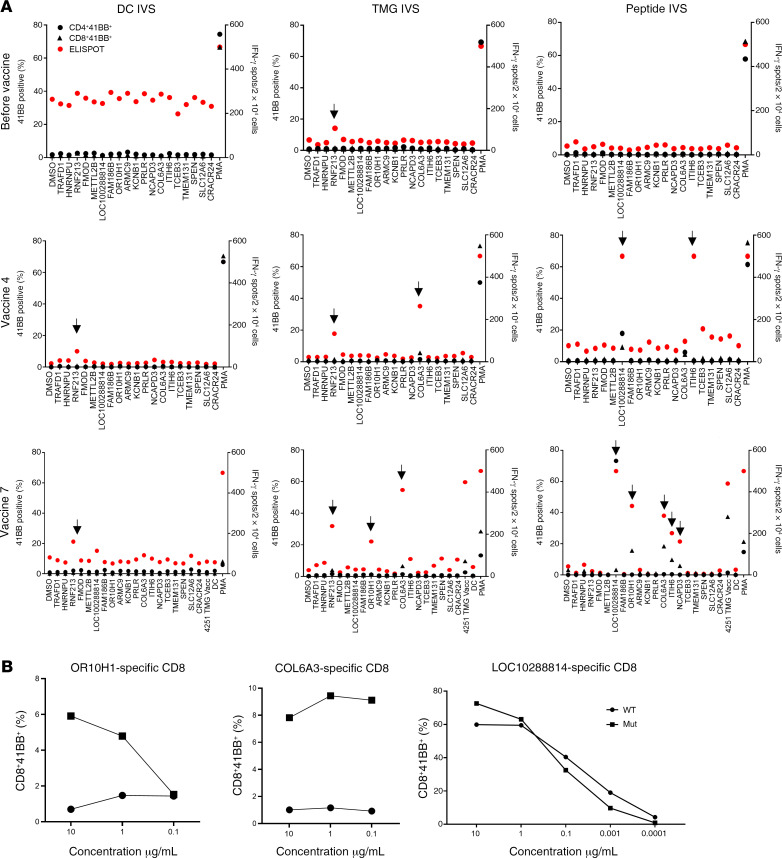
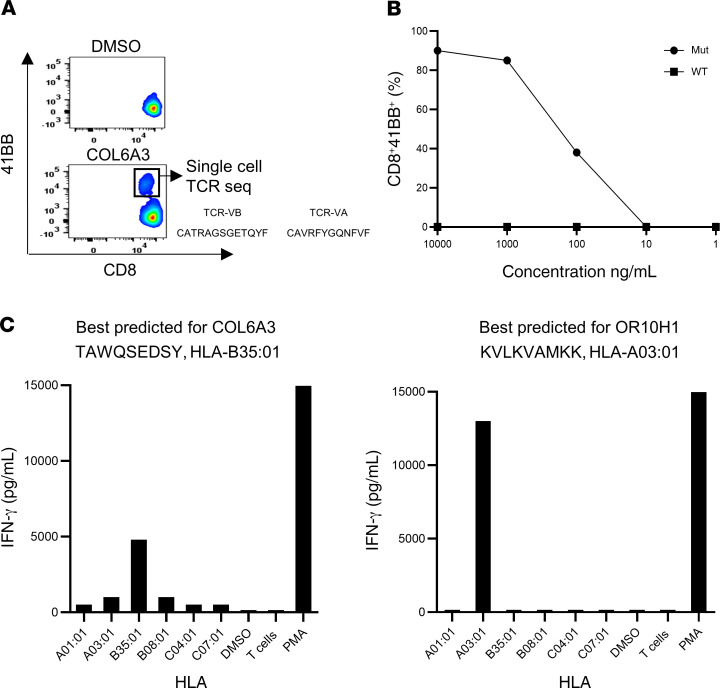
The first patient enrolled in the trial was patient 4251, a 45-year-old male diagnosed with gastric adenocarcinoma. Patient 4251 was screened in our laboratory for the presence of TILs reactive against somatic mutations (12). Four defined neoantigens were found in the initial screen: HNRNPUF580I, RNF213P4766H, FMODS332N, and TRAFD1R11L. The tumor-sequencing data for patient 4251 did not show any mutations in driver genes. The patient was previously treated at the NIH Clinical Center with TILs targeting somatic mutations and was treated later with pembrolizumab. We selected an additional 15 HLA-I–predicted epitopes based on these sequencing data and produced a vaccine composed of a total of 19 sequences (Supplemental Table 2). The patient was immunized with 0.13 mg of the personalized mRNA-4650 vaccine and evaluated for T cell responses to the vaccine peptides. To evaluate the immunogenicity of mRNA-4650 (Supplemental Figure 1), pheresis products were collected before and after vaccination, and PBMCs were used to generate monocyte-derived DCs. We then performed in vitro stimulation (IVS) by stimulating T cells obtained from pre- and post-vaccination PBMC samples for 10 days with either autologous DCs that were pulsed with 25 mer peptides covering all vaccine epitopes or transfected with a TMG construct encoding sequences similar to those of the vaccine. Analysis of the reactivity of T cells obtained from a prevaccine pheresis revealed that the T cells recognized RNF213, one of the neoantigens recognized by the previously administered TILs that could potentially represent the response of T cells that persisted in the peripheral blood following treatment (Figure 3A). Following the administration of 4 vaccines, we observed T cell reactivities against 2 mutated peptides, COL6A3 (CD8) and LOC1000288014 (CD4). The patient had stable disease following the first 4 vaccines and thus received a second cycle of vaccinations. Following the administration of 3 additional vaccinations, we observed reactivities against mutant OR10H1 (CD8), ITIH (CD4), and NCAPD3 (CD4) candidate neoantigens. To evaluate reactivity of the vaccine-specific T cells to the WT sequences, we restimulated, sorted, and expanded the CD4- and CD8-reactive T cells on the basis of their ability to upregulate 4-1BB expression following antigen activation. We observed mutation-specific reactivity for both OR10H1 and COL6A3 neoantigens, whereas the LOC1000288014 cells showed equivalent responses to titered doses of the mutant and WT peptides (Figure 3B). To further analyze the mutation-specific T cells, we restimulated and sorted the COL6A3-specific cells for single-cell T cell receptor (TCR) sequencing, which led to the identification of dominant TCR α and β chain sequences (Figure 4A). Analysis of the reactivity of PBMCs from patient 4251 that were transduced with a retroviral vector encoding the COL6A3 TCR indicated that the TCR mediated recognition of the mutant but not the WT peptide (Figure 4B). Further analysis demonstrated that COL6A3- and OR10H1-reactive T cells were restricted by HLA-B35:01 and HLA-A03:01, respectively (Figure 4C).
Figure 3. Immune monitoring for patient 4251.
(A) T cells were negatively selected from PBMCs and subjected to IVS using either TMG-transfected or peptide-loaded DCs. DCs alone served as a negative control. IVS cultures were then restimulated with DCs loaded with single peptides and tested either by flow cytometry for 4-1BB expression or IFN-γ secretion using an ELISPOT assay. Data from before vaccine administration, after 4 vaccines, and after 7 vaccines following peptide or TMG restimulation are presented. Positive responses were defined as a 3-fold increase in IFN-γ and 4-1BB or OX40 expression above the DMSO control levels. All positive responses are indicated with black arrows. (B) Positive T cell cultures showing at least a 3-fold increase compared with the DMSO sample from A were cocultured for 18 hours with autologous DCs that were loaded with WT or mutated long peptide (Mut). Cells were tested for antigen recognition by flow cytometry evidence of 4-1BB upregulation (results are representative of 1 of 2 experiments).
Figure 4. Immune monitoring for patient 4251.
(A) COL6A3 cells were restimulated and sorted according to 4-1BB upregulation into 96-well plates for single-cell TCR sequencing. (B) TCR-transduced PBLs were cocultured with DCs pulsed with a serial dilution of COL6A3-mutated (Mut) or WT peptides (results are representative of 1 of 2 experiments). (C) COS-7 cells were transfected with each of the patient’s class I HLAs, loaded with peptides, and cocultured with COL6A3- and OR10H1-specific cells. Reactivity was determined by upregulation of the 4-1BB surface marker.
Immunogenicity of mRNA-4650 in patient 4271.
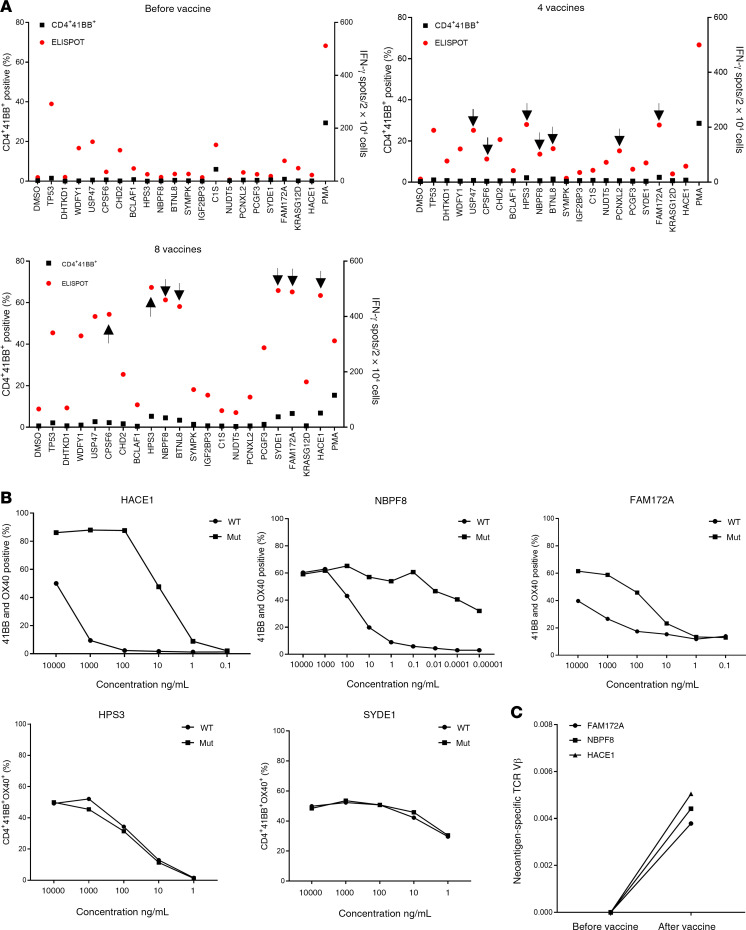
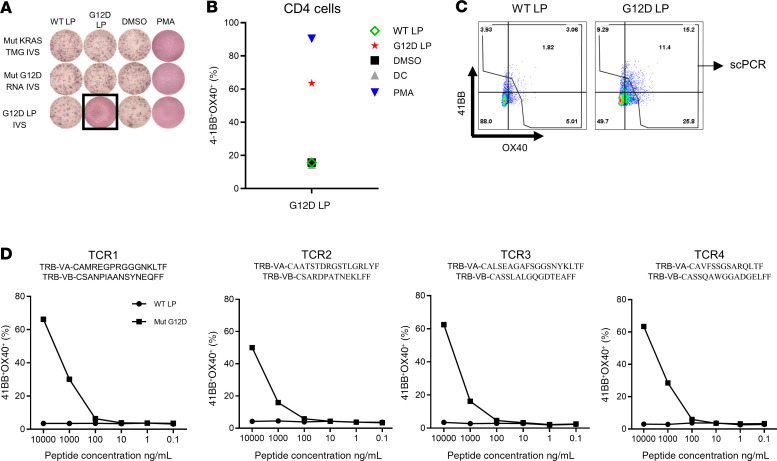
Although we observed mainly CD8 responses following vaccination of patient 4251, vaccination of the other patients resulted in the stimulation of CD4+ T cells. Screening of TILs from patient 4271, a 37-year-old male with metastatic colon cancer who was treated with TILs selected for neoantigen reactivity and later with pembrolizumab (Figure 2D), revealed reactivity against 5 different neoantigens (12): CPSF6G178E (CD8), WDFY1E44K (CD8), DHTKD1V643I (CD8), CHD2K1351R (CD4), and USP47F1156L (CD4). The 5 defined neoantigens, 2 driver gene mutations (TP53C96F and KRASG12D), and 13 predicted neoantigens were included in the vaccine backbone (Supplemental Table 3), and the patient was immunized with 0.13 mg of the personalized mRNA-4650 vaccine. Analysis of the prevaccine T cells revealed a reactivity against 2 of the defined neoantigens (WDFY1 and USP47) that potentially represented the reactivity of T cells that persisted following TIL treatment and a low-level CD4+ T cell response against 2 new antigens, TP53 and C1S (Figure 5A). Although found on the initial screen, we were unable to sort and expand those T cell populations to evaluate their WT recognition and peptide titration, but T cell reactivities against 6 additional candidates, CHD2, HPS3, NBPF8, BTNL8, PCNXL2, and FAM172A, were detected after 4 vaccines (Figure 5A). The patient had stable disease following the first 4 vaccines and received a second cycle of vaccinations, and following a total of 8 vaccines, 2 additional reactivities against HACE1 and SYDE1 were identified (Figure 5A). Restimulation and sorting of the neoantigen-specific populations (Figure 5A) based on 4-1BB upregulation led to the expansion of T cell cultures reactive to 5 of the candidate neoantigens, 3 of which — HACE1, NBPF8, and FAM172A — appeared to specifically recognize the mutant and not the WT peptide, and 2 of which — HPS3 and SYDE1 — did not discriminate between the mutant and corresponding WT peptides (Figure 5B). To further validate the reactivity of T cells generated following vaccination, we restimulated the HACE1-, NBPF8-, and FAM172A-specific T cells with peptide-pulsed DCs. We then sorted cells that upregulated 4-1BB expression following antigen stimulation, and performed TCR VB sequencing of the sorted T cells. The TCR VB analysis revealed that the neoantigen-specific clones were detectable only after vaccination (Figure 5C). Although we found no reactivity against mutated KRAS in the initial screen, T cells isolated from patient 4271 after 4 vaccinations were subjected to IVS for 10 days with either KRASG12D peptide or a TMG containing all KRAS mutations and a full-length KRASG12D construct (Supplemental Figure 2). We tested the IVS cultures against DCs loaded with WT and mutated KRAS peptides or DCs that were transfected with KRAS TMG or a full-length KRASG12D construct. We observed mutation-specific T cell reactivity against KRASG12D in the T cell culture in vitro sensitized with the long peptide, whereas no reactivity against the WT peptide was observed (Figure 6A), and flow cytometric analysis of the cocultures showed that the mutation-specific T cells were CD4+ (Figure 6B). Restimulation of the cultures with the KRASG12D peptide and sorting of 4-1BB+ cells for single-cell TCR sequencing (Figure 6C) led to the identification of 4 different TCRα and TCRβ chains (Figure 6D), which were synthesized, cloned, and retrovirally transduced into autologous peripheral blood lymphocytes (PBLs) (13, 14). A coculture of the TCR-transduced PBLs with DCs loaded with different concentrations of the mutated and WT KRAS peptides demonstrated that the 4 TCRs specifically recognized the KRASG12D neoepitope and not the WT sequence (Figure 6D).
Figure 5. Immune monitoring for patient 4271.
(A) T cells were negatively selected from PBMCs, and IVS was performed using either TMG-transfected or peptide-loaded DCs. DCs alone served as a negative control. IVS cultures were then restimulated with DCs loaded with single peptides and tested either by flow cytometry for 4-1BB upregulation or by ELISPOT assays for IFN-γ secretion. Data are presented for before vaccine administration, after 4 vaccines, and after 8 vaccines following peptide restimulation. Positive responses were defined as a 3-fold increase in IFN-γ and 4-1BB or OX40 expression above the DMSO control level. All positive responses are indicated with black arrows. (B) Positive T cell cultures showing at least a 3-fold increase compared with the DMSO sample level from A were cocultured for 18 hours with autologous DCs that were loaded with WT or mutant long peptides. Cells were tested for antigen recognition by flow cytometry for 4-1BB expression (results are representative of 1 of 2 experiments). (C) Neoantigen-specific cells were restimulated and sorted according to 4-1BB upregulation into 96-well plates for single-cell TCR sequencing. PBMCs were collected before and after vaccination and sent for TCR VB sequencing. The data show the frequency of neoantigen-specific cells before and after vaccination.
Figure 6. KRASG12D-specific TCR detection, generation, and analysis.
(A) T cells were negatively selected from PBMCs, and IVS was performed using full-length KRAS RNA, KRAS TMGs, or peptide-loaded DCs. IVS cultures were restimulated with autologous DCs loaded with 10 μg/mL WT or G12D long peptide (LP), DMSO, or PMA (positive control). Reactivity was tested by ELISPOT assay for IFN-γ secretion (A) and flow cytometry for 4-1BB/OX40 upregulation (B). (C) Positive cells were restimulated and sorted according to 4-1BB upregulation into 96-well plates for single-cell TCR sequencing. (D) TCR Vα and TCR Vβ sequences found by single-cell TCR sequencing. TCR Vβ and TCR Vα pairs were cloned into a retroviral vector, transduced into autologous PBLs, and tested for reactivity with different concentrations of KRASG12D or WT long peptide–loaded autologous DCs.
Immunogenicity of mRNA-4650 in patient 4289.
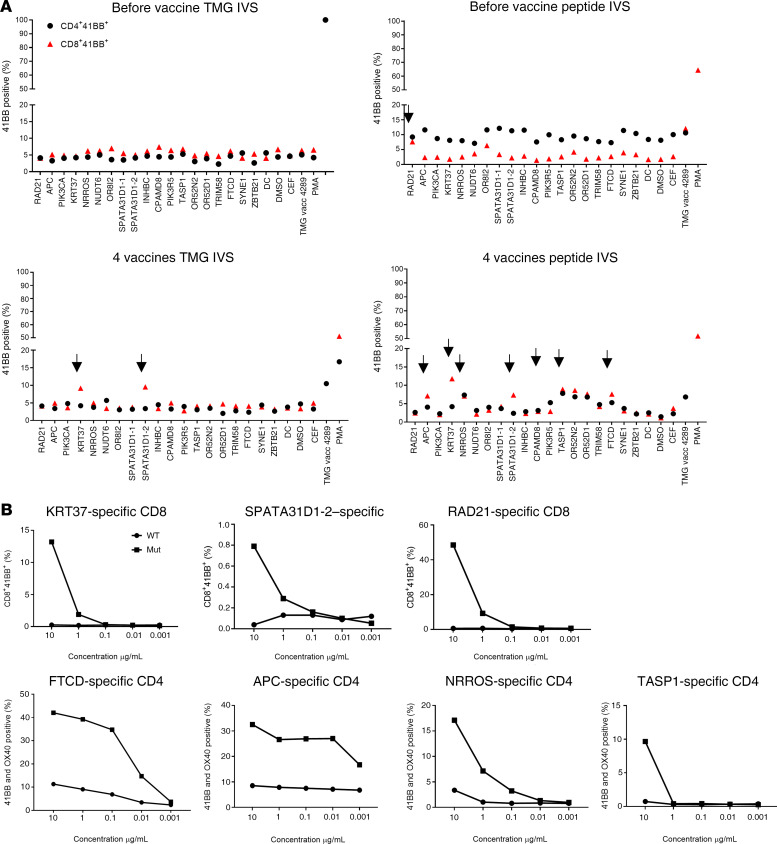
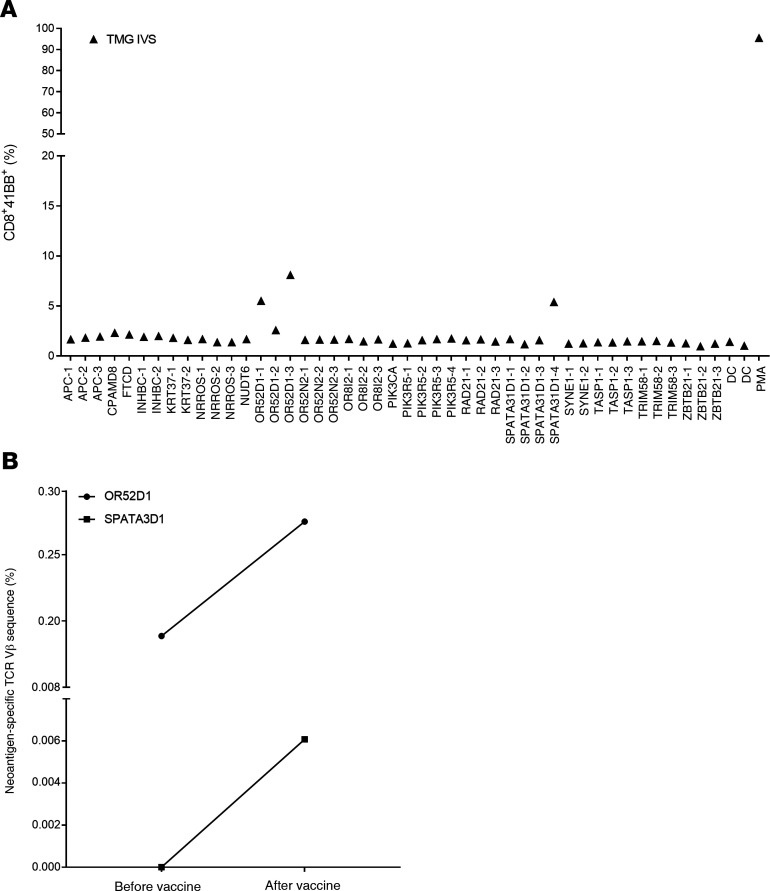
Given the good safety profile of the first 2 patients, the mRNA-4650 vaccine dose was escalated to 0.39 mg. The first patient vaccinated with that dose was patient 4289, a 42-year-old female with metastatic rectal cancer who was screened for TILs reactive against neoantigens but was the only patient in our trial who was not treated with TILs before vaccination (Table 1). The TIL screen revealed CD4+ T cell reactivity against RAD21D162V (12), which, along with 2 mutations in driver genes (APCA1474fs and PIK3CAD162V) and 15 predicted neoantigens, were included in the vaccine backbone (Supplemental Table 4). In our assessment of vaccine immunogenicity, the only neoepitope reactivity identified in the peripheral blood before vaccination appeared to be directed against RAD21, but in contrast to the reactivity observed in the patient’s TILs, this reactivity appeared to be limited to the CD8 rather than the CD4 compartment (Figure 7A). Following 4 vaccines, we identified a total of 9 potential neoantigens recognized by T cells stimulated with either peptides or TMGs (Figure 7A). Testing cultures that had been sorted on the basis of upregulation of 4-1BB expression in response to peptide stimulation and expanded by OKT3 stimulation provided evidence of mutation-specific reactivity against two CD8 epitopes (KRT37 and SPATA31D1-2) and 3 CD4 epitopes (FTCD, APC, and NRROS) (Figure 7B). Another CD4+ T cell culture showed reactivity against TASP1, but only at high peptide concentrations. We also screened the TMG IVS culture against a library of predicted HLA-I peptides, which revealed another CD8 reactivity against OR52D1 (Figure 8A). As with patient 4271, we restimulated and sorted 4-1BB+ cells from each neoantigen-specific T cell culture and performed TCR VB analysis of these samples and of PBMCs collected from the patient. We only found higher post-vaccination frequencies of 2 neoantigen-specific clones (OR52D1 and SPATA3D1) present in the PBMC samples (Figure 8B).
Figure 7. Immune monitoring for patient 4289.
(A) T cells were negatively selected from PBMCs, and IVS using either TMG-transfected or peptide-loaded DCs was performed. DCs alone served as a negative control. IVS cultures were then restimulated with DCs loaded with single peptides and tested either by flow cytometry for 4-1BB expression or ELISPOT assay for IFN-γ secretion. Data from before vaccination and after 4 vaccines are presented following peptide restimulation. Positive responses were defined as a 3-fold increase in IFN-γ and 4-1BB or OX40 expression above the DMSO control level. All positive responses are indicated with black arrows. (B) Positive T cell cultures showing at least a 3-fold increase from the DMSO sample level from A were cocultured for 18 hours with autologous DCs that were loaded with WT or mutant long peptide (results are representative of 1 of 2 experiments). Cells were tested for antigen recognition by flow cytometric analysis of 4-1BB expression.
Figure 8. Immune monitoring for patient 4289.
(A) Positive T cell cultures from Figure 7A were cocultured for 18 hours with autologous DCs that were loaded with mutation-predicted minimal epitopes. Cells were tested for antigen recognition by flow cytometric analysis of 4-1BB expression. (B) Neoantigen-specific cells were restimulated and sorted according to 4-1BB upregulation into 96-well plates for single-cell TCR sequencing. PBMCs were collected before and after vaccination for TCR Vβ sequencing.
Immunogenicity of mRNA-4650 in patient 4303.
An additional patient with rectal cancer enrolled in our trial (patient 4303, Supplemental Table 5) received a total of 4 vaccines at a dose of 0.39 mg. The patient was vaccinated with an mRNA vaccine composed of 1 defined neoantigen (RBM42), 2 mutations in driver genes (TP53 and KRAS) detected by exome and RNA-Seq, and 16 predicted potential neoantigens. Following our immune monitoring pipeline, we did not observe any vaccine-related stimulation of either preexisting or new reactivities.
Discussion
In this work, we tested the safety and immunogenicity of a novel mRNA vaccine encoding defined neoantigens, mutations in driver genes, and HLA-I–predicted epitopes in patients with metastatic GI cancer. The maximum tolerated dose (MTD) was not reached in this trial. The maximum dose tested was 0.39 mg, and we observed no severe side effects. Although we did not observe any clinical responses, in 3 of 4 patients, we could detect both CD8 and CD4+ neoantigen-specific T cells elicited by the vaccine. The clinical trial is now concluded. This trial was designed originally as a phase I/II trial. The basic design of the phase I part was supposed to include 3 patients per dose for 3 doses (0.04 mg, 0.13 mg, and 0.39 mg). Because Moderna conducted a parallel clinical trial and already cleared the first dose (0.04 mg), we skipped the 0.04 mg dose and started from the 0.13 mg dose. As our first 2 patients were treated on the 0.13 mg dose, Moderna cleared the dose, and we continued with the 0.39 mg dose for the last 2 patients. As no clinical response was observed, and because Moderna is now conducting a clinical trial with the combination of the anti–PD-1 agent, we decided not to proceed with the phase II part of the clinical trial. The main purpose of incorporating defined neoantigens that were functionally validated using TIL cultures was to attempt to vaccinate patients with clinically relevant antigens, which was not previously done in reported vaccine trials. No increase in the frequency of T cells specific for defined neoantigens included in the vaccine was observed in any patient. Although in some patients (patients 4251 and 4271) we observed preexisting immunity against some of the defined neoantigens, possibly from their TIL treatment, none of the defined antigens was further stimulated by the vaccine. In patients 4251 and 4271, additional vaccinations elicited new T cell reactivities, possibly because the vaccinations further stimulated low-frequency T cells. All of our analyses were performed in PBMCs, as we did not have available tumor tissue to analyze the intratumoral T cell repertoire after vaccination. The majority of memory T cells reside in tissues (15), and thus the PBMC analysis can be misleading, as it may underrepresent neoantigen-reactive T cell populations. Additionally, TILs that persist from earlier treatment can be terminally differentiated and less responsive to vaccines. Interestingly, although we tried to sort and expand the preexisting reactivities in samples from patients 4251 (RNF213) and 4271 (WDFY1 and USP47), none of the cultures grew, possibly because of their exhausted differentiation status. Also, patients previously treated with TILs had undergone conditional lymphodepletion with cyclophosphamide and fludarabine as part of the TIL protocol, which can reset the endogenous T cell repertoire and delay the emergence of new CD4+ and CD8+ T cells. Taken together, these factors can potentially explain the lack of stimulation of the vaccine-defined neoantigens. In 1 patient (patient 4303), we observed no T cell reactivity after vaccination. This could have been due to the lack of antigenic epitopes in the vaccine backbone or other clinical or physical aspects.
Interestingly, although we used a prediction algorithm for HLA-I–restricted peptides, the vaccine elicited mainly CD4+, and not CD8+, T cell–specific responses as previously reported by others (10). Although it is largely accepted that endogenous peptides give rise mostly to HLA-I–restricted epitopes, it seems that the vaccine preferably induced CD4+ T cell responses. This phenomenon could possibly occur as a result of the high expression levels of the vaccine mRNA that gives rise to peptides that can be loaded on tissue-resident antigen-presenting cells (APCs) and stimulate CD4+ T cells. It is also possible that the clonal heterogeneity of CD4+ T cells is broader than that of CD8+ T cells, and that this can contribute to a broader antigenic coverage. As seen with other therapeutic cancer vaccines, we could increase the frequency of cancer-specific T cells in the patients’ PBMCs but observed no clinical benefit. Four of 5 patients enrolled in the trial were treated with at least 1 round of vaccines (see CONSORT diagram in Figure 1). Although it is feasible to screen patients’ TILs for neoantigen reactivity, it is an expensive and time-consuming process that will limit the applicability of this vaccination approach. Moreover, the use of identified cancer neoantigens did not seem to contribute to the clinical effectiveness of the vaccine. Therefore, future trials should possibly use faster and less expensive processes to select potential neoantigens. Unfortunately, we could not conduct any functional or phenotypic studies, mainly because we detected vaccine-induced neoantigen responses only following IVS. In that case, the cells were already stimulated in the presence of cytokines and therefore lost their initial phenotype.
Vaccines as single agents have not historically been effective in eradicating established tumors across a wide range of antigens (1). However, evidence for the immunogenicity of a neoantigen vaccine in patients with glioblastoma was recently published (16), including the observation of intratumoral infiltration of vaccine-induced T cells. Despite the lack of tumor shrinkage in the present pilot trial, the immunogenicity data presented here open the possibility of treating patients with common epithelial cancers with combinations of vaccine and other immune modulators, such as checkpoint inhibitors. Such an mRNA neoantigen vaccine could also possibly be used to improve adoptive T cell therapy with neoantigen-specific cells by restimulating T cells in vivo.
Methods
Data reporting.
No statistical methods were used to predetermine the sample size. The experiments were not randomized, and the investigators were not blinded to allocation during the experiments or outcome assessments.
Study design.
This clinical trial was designed to determine the clinical response, immunogenicity, and safety of mRNA-4650 in patients with metastatic melanoma, GI, or genitourinary cancers. Patients with metastatic melanoma, GI, or genitourinary cancers underwent tumor resection and apheresis. Whole-exome sequencing (WES) was performed under the protocol to identify all cancer mutations, and TILs were grown and expanded. After a sufficient yield of TILs (5 × 10⁷ cells) was expanded, immunogenic mutations were identified by high-throughput immunologic screening using long peptides and TMGs covering all mutated epitopes to identify the exact mutations recognized by autologous T cells. Also, up to 15 predicted neoantigens were selected on the basis of WES and RNA-Seq and their binding affinity to the patients’ HLA molecules. The final nucleotide sequences of the mutated 25 mer epitopes and/or driver genes were transmitted electronically to Moderna Therapeutics for production of the NCI-4650 drug product. Patients received a vaccine at 2-week intervals for 4 cycles. All patients received at least 1 course of treatment (4 vaccination cycles). Immunologic tests were performed by analyzing circulating T cells reactive with the immunizing antigens. If a 3-fold increase in the precursor level of preexisting neoantigen-specific T cells or new reactivity were present in the blood at detectable levels after 1 complete course, the patients were vaccinated for the second and final course of treatment using the same vaccine dose.
mRNA-4650 production.
A plasmid encoding the RNA polymerase promoter followed by the 5′-UTR, an ORF (encoding for polyepitope concatemer), the 3′-UTR, and a poly(A) tail was overexpressed in E. coli, linearized, and purified to homogeneity. mRNA synthesis was performed as described previously (17). mRNA was created by in vitro transcription, and cap 1 was used to improve translation efficiency. After purification, the mRNA was buffer exchanged into sodium citrate buffer and stored at –20°C until use. Lipid nanoparticle (LNP) formulations were prepared using a modified procedure of a method previously described (18). Formulation of mRNA was performed through ethanol injection nanoprecipitation by mixing acidified RNA and lipids dissolved in ethanol at a 3:1 ratio (aqueous/ethanol). After pH adjustment, the mRNA-loaded LNPs were buffer exchanged into a 93 mM Tris, 7% propylene glycol (PG), 1 mM diethylenetriamine pentaacetic acid (DTPA) solution and stored at –20°C until use. Final particle size and encapsulation were less than 100 nm and more than 80%, respectively, with endotoxin below 10 EU/mL.
In vitro stimulation for immune monitoring.
Apheresis samples were thawed, washed, and resuspended to 5 × 10⁶ to 10 × 106 cells/mL with AIM-V media (Life Technologies, Thermo Fisher Scientific), and 1.75 × 10⁸ to 2 × 10⁸ viable cells were incubated in T-175 flasks (Corning) at 37°C. After 2 hours, the flasks were washed vigorously with PBS 2 to 3 times to collect nonadherent T cells for T cell sorting. For the adherent T cells, 30 mL DC media composed of RPMI containing 5% human serum, 100 U/mL penicillin, 100 μg/mL streptomycin, 2 mM l-glutamine, 800 IU/mL GM-CSF (Leukine), and 200 U/mL IL-4 (PeproTech) was added, followed by incubation at 37°C in 5% CO2. On day 4 or 5, cells were harvested and freshly used or frozen for further use. DCs were seeded into low-attachment 12- or 6-well plates for peptide loading or TMG transfection. For peptide loading, DCs were loaded with 10 to 15 μg/μL peptide or peptide pools for 2 hours. For TMG transfection, RNA electroporation was performed, and the cells were incubated for 8 to 12 hours before IVS. DCs were harvested by washing with PBS and then incubated for 5 minutes in 5 mL 0.9 mM EDTA-PBS. DCs were washed with DC medium and resuspended at a concentration of 5 × 10⁵ cells/mL. PBMCs were negatively selected for CD3 (Miltenyi Biotec), collected, counted, and spun. T cells were resuspended in CTL medium at a concentration of 2 × 10⁶ cells/mL. IL-21 at 60 ng/mL was added to the T cell fraction (resulting in a final concentration of 30 ng/mL after the addition of the DCs). DCs were mixed with T cells at a 1:1 (vol/vol) ratio (resulting in a 4:1 T cell/DC ratio: 1 × 10⁶ T cells/2.5 × 105 DCs). Five hundred microliters of the cell mix was transferred into individual wells of a 48-well plate. Cells were incubated at 37°C for 72 hours. For the first feeding, the cells were checked under the microscope and 500 μL warm CTL medium containing 60 ng/mL IL-21 and 3000 IU/mL IL-2 (referring to the final concentration in the culture medium) was added to each well and incubated at 37°C for 72 hours. For the second feeding, 1 mL warm CTL medium containing 60 ng/mL of IL-21 and 3000 IU/mL IL-2 was added to each well of a 12-well plate. Cells and medium from each well of the old plate were transferred to the new 12-well plate, and the cells were incubated for 48 hours. For the third feeding, 2 mL warm CTL medium containing 60 ng/mL of IL-21 and 3000 IU/mL IL-2 (referring to the final concentration in the culture medium) was added to each well of a 6-well plate. Cells and medium from each well of the old 12-well plate were transferred to individual wells of the new 6-well plate, and the cells were incubated for 72 hours. Following this step, the cells were kept in CTL medium containing 3000 IU/mL IL-2.
Generation of autologous APCs.
Monocyte-derived, immature DCs were generated using the plastic adherence method (13, 14). Briefly, autologous pheresis samples were thawed, washed, resuspended to 5 × 10⁶ to 10 × 106 cells/mL with AIM-V media (Life Technologies, Thermo Fisher Scientific), incubated at approximately 1 × 10⁶ cells/cm2 in an appropriate size tissue culture flask, and then incubated at 37°C in 5% CO2. After 120 minutes, nonadherent T cells were collected, the flasks were vigorously washed with PBS, and adherent T cells were incubated with RPMI (Life Technologies, Thermo Fisher Scientific) containing 5% human serum, 100 U/mL penicillin, 100 μg/mL streptomycin, 2 mM l-glutamine, 800 IU/mL granulocyte macrophage–CSF (GM-CSF), and 800 U/mL IL-4 (PeproTech). On days 4 through 7, fresh DCs were collected. Fresh or freeze-thawed DCs were used in experiments on days 4 and 5 after initial stimulation.
WES and RNA-Seq library preparation, next-generation sequencing, and data analysis.
Genomic DNA and total RNA from fresh tumor (FrTu) and matched normal apheresis samples obtained from patients 4213, 4148, 4238, and 4171 were purified using AllPrep DNA/RNA (80204, QIAGEN) following the manufacturer’s suggestions. Whole-exome library construction and exon capture of approximately 20,000 coding genes were performed using the SureSelectXT Target Enrichment System (5190-8646, Agilent Technologies) for paired-end libraries coupled with Human All Exon V6 RNA Bait (5190-8863, Agilent Technologies). WES libraries were subsequently sequenced on a NextSeq 500/550 desktop sequencer (Illumina). The library was prepared using genomic DNA (3 μg) isolated from the FrTu tissue following the manufacturer’s protocol. Paired-end sequencing was done with a High-Output Flow Cell Kit (300 cycles) (FC-404-2004, Illumina) using v2 of a reagent/flow cell kit (Illumina). Further, RNA-Seq libraries were prepared using 2 μg total RNA and the Illumina TruSeq RNA Stranded Library Prep Kit according to the manufacturer’s protocol. RNA-Seq libraries were paired-end sequenced on the NextSeq 500/550 Desktop Sequencer (Illumina), again using the same mechanism described above to generate more than 25 million paired-end reads.
Sequence alignment, processing, and variant calling.
The output from the sequencer was demultiplexed and converted to the FASTQ format using bcl2fastq software (Illumina). Reads were trimmed for quality and to remove an adapter sequence using Trimmomatic software (19). Once trimmed, the exome reads were aligned to the hg19 genome using NovoAlign (Novocraft Technologies) (20) to create initial starting bams. RNA-Seq reads were aligned to hg19 using the STAR 2-pass alignment process (21). Both RNA-Seq and exome bam files were preprocessed according to the Genome Analysis Toolkit (GATK) best practices protocol. Exome single nucleotide variants (SNVs) were called using Strelka, Somatic Sniper, Varscan2, and Mutect. Insertions and deletions (In/Dels) were called using Strelka and Varscan2. For neoantigens arising from SNVs, the cutoff criteria for the evaluation of a variant were as follows: tumor and normal coverage of 10 or greater, a tumor variant read count of 4 or higher, a tumor variant frequency of 7% or higher, and 2 or more callers calling the variant. For neoantigens arising from In/Dels, the criteria were the same except that there were no caller criteria. RNA variants were called with Varscan with no cutoffs. Somatic variants were annotated using ANNOVAR against 3 separate reference databases (RefGene [RefSeq Gene], Ensembl, and UCSC). All variants that met the cutoff criteria and those found in the Catalogue of Somatic Mutations in Cancer (COSMIC) database regardless of cutoff criteria had neoepitopes generated using an in-house python script. This script produces 25 mers with 12 aa flanking the mutation on either side where possible. When this was not possible because the mutation location was closer than 12 aa from the beginning or end of a transcript, the maximum number of aa that could flank the mutation were used. For In/Del mutations, the corresponding change was made to the cDNA sequence, and then 12 aa before the mutation (where possible) were extracted as well as all aa beyond the mutation until the first stop codon was encountered. If no stop codon was encountered, the neoepitope encompassed the entire sequence up to the end of the cDNA transcript.
In silico HLA binding prediction.
A patient’s HLAs were predicted from the exome tumor sample, the exome normal sample, and the tumor RNA using the PHLAT bioinformatics algorithm (https://sites.google.com/site/phlatfortype). If there were differences in allelic predictions, the top 2 most frequently predicted loci for each HLA were used. The 25 mers previously generated were then run through netMHCpan-3.0 for each class I HLA, and minimal epitopes of 8, 9, 10, 11, and 12 mer lengths were generated. For class II HLAs, the 25 mers were run through netMHCpanII-3.1 and minimal epitopes of 10, 11, 12, 13, 14, and 15 mers were generated. All predicted binders not containing the mutated aa were removed. All 25 mers were also run through netchop-3.1 and scores for proteosomal cleavage for each aa were recorded. To determine which variants should be screened, several steps were performed. Filtering was done as follows: (a) retained variants had to possess at least 1 transcript that had evidence of coding for a protein; (b) retained variants had to be found to be present in at least 2 of the annotation databases (NCBI, UCSC, Ensembl), with the rationale that genes or transcripts with less support should be removed; (c) retained variants could only appear in our sequencing data at a rate 2.5% or lower. This excluded the known driver genes described in the Wellcome Sanger’s Cancer Gene Census (CGC) list.
An observed positive rate table was created from an analysis of more than 8000 screened 25 mers. A combination of filters was applied to the data, and the observed positive rate for all 25 mers that remained after that filtering was recorded. The filters included (a) exome pass 1, 0 = yes, no; (b) RNA seen 1, 0 = yes, no filter; (c) gene expression quartile ≥1, 2, 3, 4; (d) netMHCpan3.0 rank ≤5, 4, 3, 2, 1, 0.75, 0.50, 0.25, 0.1; (e) netCHOP Cterm score ≥0, 0.1, 0.2, 0.3, 0.4, 0.5, 0.6, 0.7, 0.8, 0.9; (f) netCHOP 20S score ≥0, 0.1, 0.2, 0.3, 0.4, 0.5, 0.6, 0.7, 0.8, 0.9; and (g) number of minimals that met the last 3 criteria ≥1, 2, 3, 4, 5.
Taking all possible combinations, approximately 45,000 different filters were applied. Each 25 mers was analyzed to determine which filtering groups it fit into, and the highest observed positive rate from these groups was then assigned to the 25 mers. After all retained 25 mers had an observed positive rate, the variants with evidence in RNA-Seq data were taken, sorted by the observed rate, and ranked in descending order, after which the same was done to the remaining 25 mers.
Construction of TMGs and in vitro transcription.
For TMG construction (22, 23), each nonsynonymous variant identified as a minigene was constructed encoding the mutant aa flanked by 12 amino acids of the WT sequence. TMGs were cloned into pcRNA2SL using EcoRI and BamHI. Following linearization of the constructs, phenol-chloroform extraction was performed, and the DNA was precipitated with sodium acetate and ethanol. Next, 1 μg linearized DNA was used to generate in vitro–transcribed RNA with the mMESSAGE mMACHINE T7 Ultra Kit (Life Technologies, Thermo Fisher Scientific) as instructed by the manufacturer. RNA was precipitated using LiCl2 and resuspended at 1 μg/μl.
Peptide pulsing.
Peptides were made in-house or purchased from GenScript. Briefly, autologous or allogeneic DCs were harvested, washed, and resuspended at 0.5 × 10⁶ to 1 × 10⁶ cells/mL concentration in DC media supplemented with 800 IU/mL GM-CSF and 800 U/mL IL-4. Next, cells were incubated with peptides for 2 to 12 hours at 37°C in 5% CO2. Before coculture, DCs were collected, washed twice with PBS, and resuspended in 50/50 media and then used for coculture assays.
IFN-γ ELISPOT and ELISA coculture assays and flow cytometry for CD134 and CD137 activation marker staining.
When DCs were used as targets for T cells, 3 × 10⁴ to 1 × 10⁵ cells/well were used in 96-well plates. When cell lines were used as target T cells, 2 × 10⁴ to 5 × 10⁴ cells/well were used in 96-well plates. Effector T cells (1 × 10⁴ to 2 × 10⁴ cells/well) were used in 96-well plates. All cocultures were performed in 50/50 media in the absence of exogenously added cytokines. Phorbol 12-myristate 13-acetate–ionomycin mixture (eBioscience) was used as a positive control. IFN-γ ELISPOT assays were performed on MultiScreen-IP filter plates (MilliporeSigma). Each plate was pretreated with 50 μL 70% ethanol/well for less than 2 minutes, washed 4 times with ultra-pure water (Quality Biological), and then coated with 10 μg/mL IFN-γ capture antibody (100 μl/well, clone: 1-D1K, Mabtech, diluted in PBS) overnight at 4°C. Anti-CD3 antibody (clone OKT3, Miltenyi Biotec, 1–10 μg/mL) was added to the positive control wells. On the day of coculture, each plate was washed 5 times with PBS and blocked with complete medium without IL-2 for at least 30 minutes at room temperature. After overnight coculture (18–24 hours), the cells were harvested and transferred into a round-bottom 96-well plate for flow cytometric staining and analysis. Each ELISPOT plate was washed 5 times with PBS containing 0.05% Tween-20 (MP Biomedicals) and incubated for 2 hours with 1 μg/mL, 0.22-μm-filtered anti–human IFN-γ detection antibody (clone 7-B6-1, Mabtech, 100 μL/well, diluted in PBS plus 0.5% FBS). Each plate was washed 5 times with PBS and incubated for 1 hour with streptavidin–alkaline phosphatase (streptavidin-ALP) (Mabtech, 100 μL/well, 1:3000 diluted with PBS plus 0.5% FBS), followed by 3 washes with ddH2O and development with 0.45-μm-filtered KPL BCIP/NBT substrate solution (Abcam, 100 μL/well) for 5 to 10 minutes. The reaction was stopped by rinsing thoroughly with cold tap water. After the plates completely dried, each ELISPOT plate was scanned and counted using an ImmunoSpot plate reader and associated software (Cellular Technologies). The harvested cells were stained for surface expression of CD134 and CD137 and assessed using the BD FACSCanto I, BD FACSCanto II, or BD LSR Fortessa system. All flow cytometric data were analyzed with FlowJo software (Tree Star).
Single-cell sorting and single-cell reverse transcription PCR.
Single-cell reactive T cells were sorted into a 96-well plate containing reverse transcription PCR (RT-PCR) buffer based on activation markers (CD134, CD137) or tetramer staining using a BD FACSAria instrument. TCR sequences from the single sorted cells were obtained by a series of 2 nested PCR reactions (24). Multiplex PCR with multiple Vα and Vβ region primers and 1 primer for Cα and Cβ regions each was performed using the One-Step RT-PCR Kit (QIAGEN). The RT-PCR reaction was performed accordingly to the manufacturer’s instructions using the following cycling conditions: 50°C for 15 minutes, 95°C for 2 minutes, 95°C for 15 seconds, and 60°C for 4 minutes, repeated for 18 cycles. For the second amplification reaction, 4 μL from the first RT-PCR product was used as a template in a total of 25 μL PCR mix using HotStarTaq DNA Polymerase (QIAGEN) and multiple internally nested Vα and Vβ region primers and 1 internally nested primer for Cα and Cβ regions each (the final concentration of each primer was 0.6 μM). The cycling conditions were 95°C for 15 minutes, 94°C for 30 seconds, 50°C for 30 seconds, 72°C for 1 minute repeated for 50 cycles, and 72°C for 10 minutes. Samples were kept at 4°C. The PCR products were purified and sequenced by the Sanger sequencing method with internally nested Cα and Cβ region primers from Beckmann Coulter.
TCR survey and deep sequencing.
TCR Vβ deep sequencing was performed by immunoSEQ, Adaptive Biotechnologies on genomic DNA isolated from peripheral blood T cells and frozen tumor tissues. T cell numbers in sequenced samples ranged from approximately 2 × 10⁴ to 1 × 10⁶ cells. TCR B chain (TRB) clonality and productivity were analyzed using immunoSEQ Analyzer 3.0. Only productive TCR rearrangements were used in the calculations of TCR frequencies.
TCR cloning, retrovirus production, and transduction of T cells.
For TCR cloning and transduction of T cells (14, 22), TRA V-J–encoding sequences were fused to mouse TCRβ constant chain, and TRB V-D-J–encoding sequences were fused to mouse TCRɑ constant chain (25). Mouse constant chains were modified to improve TCRɑβ pairing (25). The full-length TRB and TRA chains were separated by a furin SGSG P2A linker. The TCR construct was cloned into a pMSGV1 retroviral vector.
For transduction, autologous or allogeneic pheresis samples were thawed and set to 2 × 10⁶ cells/mL in T cell media, which consisted of a 50/50 mixture of RPMI and AIM-V media supplemented with 5% in-house human serum, 10 μg/mL gentamicin (CellGro), 100 U/mL penicillin and 100 μg/mL streptomycin, and 2 mM l-glutamine (all from Life Technologies, Thermo Fisher Scientific). Cells (2 × 10⁶ cells/mL) were stimulated in a 24-well plate with 50 ng/mL soluble OKT3 (Miltenyi Biotec) and 300 IU/mL IL-2 (Chiron Corporation) for 2 days before retroviral transduction. Retroviral supernatants were generated in the HEK293GP packaging line (14, 24). Briefly, a pMSGV1 plasmid encoding mutation-specific TCR (2 μg/well) and the envelope-encoding plasmid RD114 (0.75 μg/well) were cotransfected into 1 × 10⁶ 239GP cells/well of 6-well poly-d-lysine–coated plates using Lipofectamine 2000 (Life Technologies, Thermo Fisher Scientific). Retroviral supernatants were collected 42 to 48 hours after transfection, diluted 1:1 with DMEM media, and centrifuged onto Retronectin-coated (10 μg/mL, Takara), nontissue culture–treated 6-well plates at 2000g for 2 hours at 32°C. Stimulated T cells (2 × 10⁶ cells/well at 0.5 × 10⁶ cells/mL in IL-2 containing T cell media) were then spun onto the retrovirus plates for 10 minutes at 300g to 350g. Stimulated T cells were transduced overnight, removed from the plates, and further cultured in recombinant IL-2–containing (rIL-2–containing) T cell media. GFP and mock transduction controls were included in the transduction experiments. Cells were typically assayed 10 to 14 days after retroviral transduction.
Antibodies.
The following titrated anti-human antibodies (all from BD Biosciences) were used for cell surface staining: CD3-AF700 (561027, 1:100 dilution) or APC-H7 (560176, 1:100 dilution), CD4-FITC, phycoerythrin (PE), PE-Cy7, APC-H7 (clone SK3), CD8-PE-Cy7 (335787, 1:100 dilution), OX40-PE-Cy7 (563663, 1:7 dilution) or FITC (555837, 1:7 dilution), and 4-1BB-APC (550890, 1:7 dilution). For cell stimulation, purified anti-CD3 was used at 30 ng/mL (130-093-387, Miltenyi Biotec).
Data availability.
All exome and RNA-Seq data were deposited in the NCBI’s database of Genotypes and Phenotypes (dbGaP) (ID: phs001003.v1.p1).
Study approval.
The study was performed under an Investigator IND from the FDA, and the protocol was approved by the IRB of the NCI, NIH and registered with ClinicalTrials.gov (NCT03480152). All patients provided written informed consent.
Author contributions
GC designed the study, performed the experiments, analyzed the data, and wrote the manuscript. JJG performed all the bioinformatics related to the study. TZ and KH were involved in the design, analysis, and supervision of mRNA production. NL performed experiments to asses vaccine immunogenicity. BCP performed all single-cell TCR sequence experiments. MRP was involved in the study design and analysis of the data. RY performed experiments involving the identification of T cells targeting vaccine antigens. FJL performed experiments. MSJ performed the HLA verification assays. TDP performed all exome sequencing and RNA-Seq. SLG supervised the clinical team, analyzed data, and wrote the manuscript. SLG, CTM, SS, MLS, AP and PDC were involved in patient care and collection of clinical data. PFR designed the study and analyzed data. SAR contributed to the study design, experiment design, wrote the manuscript, and supervised the project. All authors discussed the results.
Supplementary Material
Acknowledgments
We thank A. Mixon and S. Farid for flow cytometry support and other members of the Surgery Branch for helpful discussions and technical support. We thank the medical arts service at the NIH for figure editing. We thank Cognition Studio Inc. for making the graphical abstract related to this work. This research was supported by the Center for Cancer Research’s intramural research program of the NCI, NIH.
Version 1. 10/05/2020
Electronic publication
Version 2. 11/02/2020
Print issue publication
Footnotes
Conflict of interest: TZ is an employee of Moderna and holds equity in the company. KH was an employee of Moderna during the time this study was being conducted. SAR, GC, NL, and RY are inventors on a patent application (no. E-165-2020-0-US-01).
Copyright: © 2020, American Society for Clinical Investigation.
Reference information: J Clin Invest. 2020;130(11):5976–5988.https://doi.org/10.1172/JCI134915.
Contributor Information
Gal Cafri, Email: galcafri@gmail.com.
Tal Zaks, Email: Tal.Zaks@modernatx.com.
Kristen Hopson, Email: kristenparkhopson@gmail.com.
Noam Levin, Email: noam.levin@nih.gov.
Biman C. Paria, Email: biman_paria@nih.gov.
Rami Yossef, Email: rami.yoseph@nih.gov.
Todd D. Prickett, Email: prickettt@mail.nih.gov.
Samantha Seitter, Email: samantha.seitter@nih.gov.
Paul F. Robbins, Email: Paul_Robbins@nih.gov.
Steven A. Rosenberg, Email: sar@mail.nih.gov.
References
- 1.Rosenberg SA, Yang JC, Restifo NP. Cancer immunotherapy: moving beyond current vaccines. Nat Med. 2004;10(9):909–915. doi: 10.1038/nm1100. [DOI] [PMC free article] [PubMed] [Google Scholar]
- 2.et al. Mining exomic sequencing data to identify mutated antigens recognized by adoptively transferred tumor-reactive T cells. Nat Med. 2013;19(6):747–752. doi: 10.1038/nm.3161. [DOI] [PMC free article] [PubMed] [Google Scholar]
- 3.et al. Immunogenicity of somatic mutations in human gastrointestinal cancers. Science. 2015;350(6266):1387–1390. doi: 10.1126/science.aad1253. [DOI] [PMC free article] [PubMed] [Google Scholar]
- 4.et al. Immune recognition of somatic mutations leading to complete durable regression in metastatic breast cancer. Nat Med. 2018;24(6):724–730. doi: 10.1038/s41591-018-0040-8. [DOI] [PMC free article] [PubMed] [Google Scholar]
- 5.et al. A phase II study of tumor-infiltrating lymphocyte therapy for human papillomavirus-associated epithelial cancers. Clin Cancer Res. 2019;25(5):1486–1493. doi: 10.1158/1078-0432.CCR-18-2722. [DOI] [PMC free article] [PubMed] [Google Scholar]
- 6.et al. Identification of neoantigen-reactive tumor-infiltrating lymphocytes in primary bladder cancer. J Immunol. 2019;202(12):3458–3467. doi: 10.4049/jimmunol.1801022. [DOI] [PMC free article] [PubMed] [Google Scholar]
- 7.et al. Unique neoantigens arise from somatic mutations in patients with gastrointestinal cancers. Cancer Discov. 2019;9(8):1022–1035. doi: 10.1158/2159-8290.CD-18-1494. [DOI] [PMC free article] [PubMed] [Google Scholar]
- 8.Carreno BM, et al. Cancer immunotherapy. A dendritic cell vaccine increases the breadth and diversity of melanoma neoantigen-specific T cells. Science. 2015;348(6236):803–808. doi: 10.1126/science.aaa3828. [DOI] [PMC free article] [PubMed] [Google Scholar]
- 9.Ott PA, et al. An immunogenic personal neoantigen vaccine for patients with melanoma. Nature. 2017;547(7662):217–221. doi: 10.1038/nature22991. [DOI] [PMC free article] [PubMed] [Google Scholar]
- 10.et al. Personalized RNA mutanome vaccines mobilize poly-specific therapeutic immunity against cancer. Nature. 2017;547(7662):222–226. doi: 10.1038/nature23003. [DOI] [PubMed] [Google Scholar]
- 11.et al. Efficient identification of mutated cancer antigens recognized by T cells associated with durable tumor regressions. Clin Cancer Res. 2014;20(13):3401–3410. doi: 10.1158/1078-0432.CCR-14-0433. [DOI] [PMC free article] [PubMed] [Google Scholar]
- 12.et al. Unique neoantigens arise from somatic mutations in patients with gastrointestinal cancers. Cancer Discov. 2019;9(8):1022–1035. doi: 10.1158/2159-8290.CD-18-1494. [DOI] [PMC free article] [PubMed] [Google Scholar]
- 13.Gros A, et al. Prospective identification of neoantigen-specific lymphocytes in the peripheral blood of melanoma patients. Nat Med. 2016;22(4):433–438. doi: 10.1038/nm.4051. [DOI] [PMC free article] [PubMed] [Google Scholar]
- 14.et al. Immunogenicity of somatic mutations in human gastrointestinal cancers. Science. 2015;350(6266):1387–1390. doi: 10.1126/science.aad1253. [DOI] [PMC free article] [PubMed] [Google Scholar]
- 15.Farber DL, Yudanin NA, Restifo NP. Human memory T cells: generation, compartmentalization and homeostasis. Nat Rev Immunol. 2014;14(1):24–35. doi: 10.1038/nri3567. [DOI] [PMC free article] [PubMed] [Google Scholar]
- 16.et al. Neoantigen vaccine generates intratumoral T cell responses in phase Ib glioblastoma trial. Nature. 2019;565(7738):234–239. doi: 10.1038/s41586-018-0792-9. [DOI] [PMC free article] [PubMed] [Google Scholar]
- 17.Richner JM, et al. Modified mRNA vaccines protect against Zika virus infection. Cell. 2017;168(6):1114–1125.e10. doi: 10.1016/j.cell.2017.02.017. [DOI] [PMC free article] [PubMed] [Google Scholar]
- 18.et al. A novel amino lipid series for mRNA delivery: improved endosomal escape and sustained pharmacology and safety in non-human primates. Mol Ther. 2018;26(6):1509–1519. doi: 10.1016/j.ymthe.2018.03.010. [DOI] [PMC free article] [PubMed] [Google Scholar]
- 19.Bolger AM, Lohse M, Usadel B. Trimmomatic: a flexible trimmer for Illumina sequence data. Bioinformatics. 2014;30(15):2114–2120. doi: 10.1093/bioinformatics/btu170. [DOI] [PMC free article] [PubMed] [Google Scholar]
- 20. NovoAlign|Novocraft. http://www.novocraft.com/products/novoalign Accessed August 19, 2020.
- 21.et al. STAR: ultrafast universal RNA-seq aligner. Bioinformatics. 2013;29(1):15–21. doi: 10.1093/bioinformatics/bts635. [DOI] [PMC free article] [PubMed] [Google Scholar]
- 22.et al. PD-1 identifies the patient-specific CD8+ tumor-reactive repertoire infiltrating human tumors. J Clin Invest. 2014;124(5):2246–2259. doi: 10.1172/JCI73639. [DOI] [PMC free article] [PubMed] [Google Scholar]
- 23.et al. Mining exomic sequencing data to identify mutated antigens recognized by adoptively transferred tumor-reactive T cells. Nat Med. 2013;19(6):747–752. doi: 10.1038/nm.3161. [DOI] [PMC free article] [PubMed] [Google Scholar]
- 24.et al. Tumor- and neoantigen-reactive T-cell receptors can be identified based on their frequency in fresh tumor. Cancer Immunol Res. 2016;4(9):734–743. doi: 10.1158/2326-6066.CIR-16-0001. [DOI] [PMC free article] [PubMed] [Google Scholar]
- 25.Cohen CJ, Zhao Y, Zheng Z, Rosenberg SA, Morgan RA. Enhanced antitumor activity of murine-human hybrid T-cell receptor (TCR) in human lymphocytes is associated with improved pairing and TCR/CD3 stability. Cancer Res. 2006;66(17):8878–8886. doi: 10.1158/0008-5472.CAN-06-1450. [DOI] [PMC free article] [PubMed] [Google Scholar]
Associated Data
This section collects any data citations, data availability statements, or supplementary materials included in this article.
Supplementary Materials
Data Availability Statement
All exome and RNA-Seq data were deposited in the NCBI’s database of Genotypes and Phenotypes (dbGaP) (ID: phs001003.v1.p1).


