

Abstract
Background
Antibody responses to virus reflect exposure and potential protection.
Methods
We developed a highly specific and sensitive approach to measuring antibodies against SARS-CoV-2 for population-scale immune surveillance. Antibody positivity was defined as a dual-positive response against both the receptor-binding domain and nucleocapsid proteins of SARS-CoV-2. Antibodies were measured by immunoprecipitation assays in capillary blood from 15,771 children aged 1 to 18 years living in Bavaria, Germany, and participating in a public health type 1 diabetes screening program (ClinicalTrials.gov: NCT04039945), in 1,916 dried blood spots from neonates in a Bavarian screening study (ClinicalTrials.gov: NCT03316261), and in 75 SARS-CoV-2-positive individuals. Virus positive incidence was obtained from the Bavarian health authority data.
Findings
Dual-antibody positivity was detected in none of the 3,887 children in 2019 (100% specificity) and 73 of 75 SARS-CoV-2-positive individuals (97.3% sensitivity). Antibody surveillance in children during 2020 resulted in frequencies of 0.08% in January to March, 0.61% in April, 0.74% in May, 1.13% in June, and 0.91% in July. Antibody prevalence from April 2020 was 6-fold higher than the incidence of authority-reported cases (156 per 100,000 children), showed marked variation between the seven Bavarian regions (p < 0.0001), and was not associated with age or sex. Transmission in children with virus-positive family members was 35%. 47% of positive children were asymptomatic. No association with type 1 diabetes autoimmunity was observed. Antibody frequency in newborns was 0.47%.
Conclusions
We demonstrate the value of population-based screening programs for pandemic monitoring.
Funding
The work was supported by funding from the BMBF (FKZ01KX1818).
Keywords: SARS-CoV-2 antibody, seroprevalence, receptor binding domain, RBD, nucleocapsid antigen, public health screening, type 1 diabetes
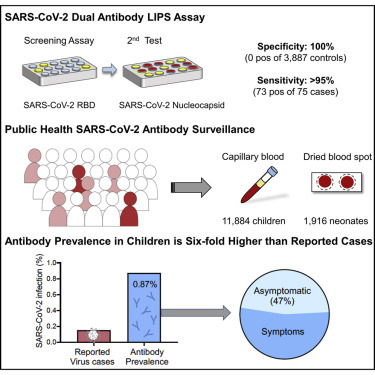
Graphical Abstract
Context and Significance
Children are shown to have lower rates of SARS-CoV-2 infection than adults. Monitoring low incidence populations such as children requires highly specific methods. We developed a specific (100%) and sensitive (>95%) strategy to detect SARS-CoV-2 antibodies as a measure of infection. Public health antibody surveillance in over 11,000 children in Bavaria, Germany during 2020 found an antibody frequency of 0.87% from April to July, which was 6-fold higher than the health authority-reported SARS-CoV-2 incidence in children. There was a large regional variation in antibody frequency, but no age or sex differences were observed. Transmission to children within virus-positive families was 35%. Questionnaire data suggested that limiting virus testing to children with symptoms or SARS-CoV-2-positive contact would miss 25% of all childhood cases.
Hippich et al. developed a highly specific and sensitive dual antibody strategy for public health surveillance of SARS-CoV-2 antibody prevalence. In testing more than 11,000 children in Germany, they report an antibody prevalence that is 6-fold higher than the health authority-reported SARS-CoV-2 incidence, including 50% of antibody-positive children without symptoms.
Introduction
Severe acute respiratory syndrome coronavirus 2 (SARS-CoV-2) has infected millions of humans and has led to a widespread shutdown of communities, countries, and continents.1 The responses implemented to control the spread of the virus have varied from complete lockdown and closure of schools with the intent to slow the spread of the virus to relatively benign measures in the hope that there would be sufficient exposure to achieve herd immunity. Immunoglobulin G (IgG) antibodies provide a measure of exposure and potentially also immunity to the virus.2 , 3 Several assays that measure antibodies to SARS-CoV-2 have been developed, and some are available commercially.4, 5, 6, 7, 8 The frequency of individuals with an immune response to SARS-CoV-2 ranged from <1% to >10% in prior reports, depending on the test used and the virus spread in the population tested.9, 10, 11, 12, 13, 14, 15 However, a widely discussed limitation of measuring antibodies to SARS-CoV-2 is an inadequate specificity of assays, which can result in an overestimate of the true prevalence of antibodies, especially in populations or communities with limited exposure.8 , 16, 17, 18 For example, the population frequency of reported virus-positive cases in the majority of European countries is <1% (https://www.worldometers.info/coronavirus/). A test with 99% specificity will, therefore, result in a large proportion of false positive results if applied for immune surveillance in these countries. True antibody prevalence, therefore, requires an approach that has a specificity close to 100%. This is rarely achieved by a single test and appears not to be the case for SARS-CoV-2 antibody tests.8 An alternative strategy is to screen with one sensitive test followed by additional diagnostic tests in those positive in the screening test.19 This strategy is used successfully by us and others to diagnose the pre-symptomatic stage of type 1 diabetes in children, a condition present in <0.5% of the population.20 , 21
Almost all studies reporting the prevalence of SARS-CoV-2 antibodies in a population have used a single test.9 , 11, 12, 13, 14 We believe that a two-stage approach might provide a sensitive and specific approach for detecting SARS-CoV-2 antibodies. Therefore, using sensitive assays against the predominant target antigens of SARS-CoV-2, the receptor-binding domain (RBD), and the nucleocapsid antigen, we have developed and validated an approach for immune surveillance of SARS-CoV-2. We have applied this approach to population-based screening of children in the Fr1da study21 , 22 and newborn screening in the Freder1k study23 to determine the extent of immunity in the German state of Bavaria. This is the state with the highest reported incidence of SARS-CoV-2 in Germany. Bavaria went into lockdown in late March and gradually reopened in early May.
The Fr1da and Freder1k studies provided us with an opportunity to track the prevalence of SARS-CoV-2 antibodies from prior to the first appearance of the virus in Germany through the period of lockdown and reopening and to compare antibody prevalence to reported virus-positive incidences in children in the same region.
Results
Specificity and Sensitivity of SARS-CoV-2 Antibody Tests
To establish a threshold for positivity, we measured antibodies to the RBD protein of SARS-CoV-2 using a luciferase immunoprecipitation system (LIPS) in samples collected from 3,221 children (1,562 girls, 48.5%; median age, 3.0, interquartile range [IQR], 2.1–4.2 years) enrolled in the Bavarian Fr1da study between August 2019 and December 2019 before the start of the coronavirus disease 2019 (COVID-19) pandemic in Germany (Figure 1 ; Table S1). The distribution of antibody titer ranged from 0.0 to 5.7 arbitrary units (AU) calculated from a calibration curve (Figure S1A). The logarithmic mean was 0.0 AU and the logarithmic mean plus 5 standard deviations (SDs) was 0.9 AU. A total of 22 of 3,221 (0.68%; specificity, 99.32%) children had values >0.9 AU (Figure 2 A). In comparison, 74 of 75 (98.67% sensitivity) individuals with either an active virus-positive infection or who were previously virus positive (virus-positive cohort) had values >0.9 AU, ranging from 1.3 to 600 AU. Values >6 AU were only found in the virus-positive cohort (62/75 cases), but there was an overlap between virus-positive cases and controls for values between 0.9 and 6 AU.
Figure 1.
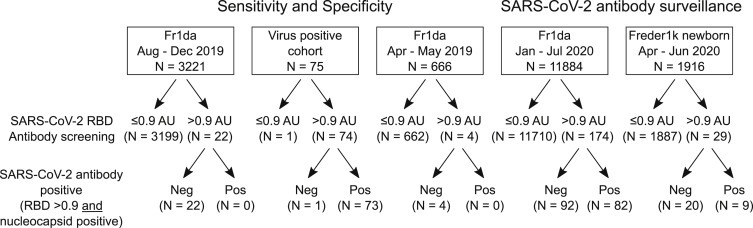
Number of Individuals Tested for SARS-CoV-2 Antibodies
The total numbers from each group, the numbers positive at the screening, and confirmation stages are shown. AU, arbitrary unit; RBD, receptor binding domain; SARS-CoV-2, severe acute respiratory syndrome coronavirus 2. See also Table S1.
Figure 2.
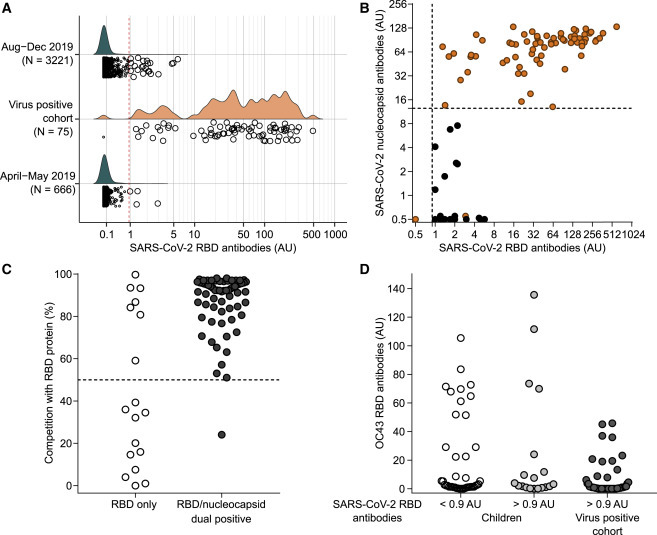
SARS-CoV-2 Antibody Sensitivity and Specificity
(A) SARS-CoV-2 RBD antibody titers in 3,321 children sampled between August and December 2019, in 75 people with a confirmed SARS-CoV-2 antibody-positive virus test, and 666 children sampled in April or May 2019. The red broken line shows the logarithmic mean plus 5 SD at >0.9 AU. Samples with values >0.9 AU are shown as large circles.
(B) Antibodies to SARS-CoV-2 nucleocapsid protein (y axis) and RBD antibodies (x axis) in children sampled in 2019 with RBD antibodies >0.9 AU (open circles) and in SARS-CoV-2 virus-positive cases (filled circles). The broken lines indicate the threshold for positivity assigned to each antibody.
(C) Inhibition of binding to Nluc-SARS-CoV-2 RBD protein by competition with purified RBD protein (y axis) in children (open circles) and virus-positive cases (filled circles) with RBD antibodies >0.9 AU. The samples were separated into nucleocapsid protein antibody-negative (left) and -positive (right) samples. The broken line indicates 50% inhibition.
(D) Antibodies to the RBD of the beta coronavirus OC43 in children (y axis) with SARS-CoV-2 RBD antibodies <0.9 AU (open circles) and >0.9 AU (gray filled circles), and in virus-positive cases (dark gray filled circles).
AU, arbitrary unit; PCR, polymerase chain reaction; RBD, receptor binding domain; SARS-CoV-2, severe acute respiratory syndrome coronavirus 2. See also Figures S1 and S2.
We reasoned that people who were exposed to the virus were more likely to have antibodies to other SARS-CoV-2 antigens. Therefore, we tested samples with RBD antibody titers >0.9 AU for antibodies against the SARS-CoV-2 nucleocapsid protein (Figure 2B). None of the 22 children with RBD antibodies >0.9 AU and 73 of 75 of the virus-positive cases had anti-nucleocapsid antibodies. Therefore, we defined anti-SARS-CoV-2 positivity as an RBD antibody titer of >0.9 AU and positive for anti-nucleocapsid antibodies. To validate this definition, we tested a further 666 samples collected from children in April or May 2019 (Figure 2A). Of these, four (0.60%) had RBD antibody titers >0.9 AU and none of these four had anti-nucleocapsid antibodies. Therefore, we observed positivity for antibodies to SARS-CoV-2 in 0 of 3,887 children sampled prior to January 2020 (100% specificity) and in 73 of 75 virus-positive individuals (97.3% sensitivity).
To provide further confidence in the definition of antibody-positive status, competition of binding to the nanoluciferase-tagged SARS-CoV-2 RBD with purified RBD protein was performed in samples with RBD antibody titers >0.9 AU (Figures 2C and S1B). Binding was inhibited by >50% in 72 of 73 dual-positive samples and in 7 of 20 samples positive for just RBD antibodies (p < 0.0001). To determine whether some of the RBD binding may be associated with binding to other beta coronaviruses, 62 children with SARS-CoV-2 RBD antibody titers of >0.9 AU (n = 19) or <0.9 AU (n = 43) and 50 of the confirmed virus-positive individuals with SARS-CoV-2 RBD antibodies were also tested against OC43 RBD (Figure 2D). Binding to OC43 RBD was observed in each group, but it was lower in the confirmed virus-positive cohort than in children with SARS-CoV-2 RBD antibody titers >0.9 AU (p = 0.011) or <0.9 AU (p = 0.001). We found no correlation between antibodies to SARS-CoV-2 RBD and OC43 RBD in the samples from children (r = 0.08; p = 0.55; Figure S2A) or the confirmed virus-positive cohort (r = −0.12; p = 0.38; Figure S2B). Finally, antibodies to SARS-CoV-2 measured using the LIPS assay in the patient samples were correlated with the results obtained using an enzyme-linked immunosorbent assay (ELISA; Euroimmun, Luebeck, Germany) (LIPS RBD: r = 0.64, p = 0.0027; LIPS nucleocapsid: r = 0.72, p = 0.0004; Figures S2C and S2D).
Public Health Screening: SARS-CoV-2 Antibody Distribution in Children during the Pandemic
Antibodies to the SARS-CoV-2 RBD were tested in 11,884 children (5,853 girls, 49.3%) enrolled in the Bavarian Fr1da study between January 2020 and July 2020 (Figure 1). The median age at sample collection was 3.2 years (IQR, 2.2 to 5.1 years) (Table S1). The RBD antibody titer was >0.9 AU in 174 of 11,884 children. The frequency of RBD antibody positivity ranged from 6 of 1,026 (0.58%) children enrolled in February to 40 of 2,206 (1.81%) children enrolled in June (Figure 3 A). Dual positivity for RBD and nucleocapsid antibodies was observed in 82 children, including 1 of 513 (0.19%) children sampled in January, 0 of 1,026 in February, 1 of 1,099 (0.09%) in March, 9 of 1,472 (0.61%) in April, 21 of 2,822 (0.74%) in May, 25 of 2,206 (1.13%) children in June, and 25 of 2,746 (0.91%) children in July (p < 0.001; Figure 3B; Table S2). Binding to the RBD was inhibited in 43 of 43 tested dual RBD and nucleocapsid antibody-positive samples and in 23 of 54 samples with RBD antibody titers >0.9 AU without nucleocapsid antibodies (p < 0.0001; Figure S3). Therefore, significant antibody responses to SARS-CoV-2 were observed in children in Bavaria from April 2020. There were no differences in the antibody frequencies between boys (41 of 4,674, 0.88%) and girls (39 of 4,571, 0.85%; p = 0.99) from April to July, and no difference in antibody frequency between children aged 0 to 6 years (66 of 7,821, 0.84%) and children aged 7 to 18 years (14 of 1,425, 0.98%; p = 0.72) in April to July (Table S3).
Figure 3.
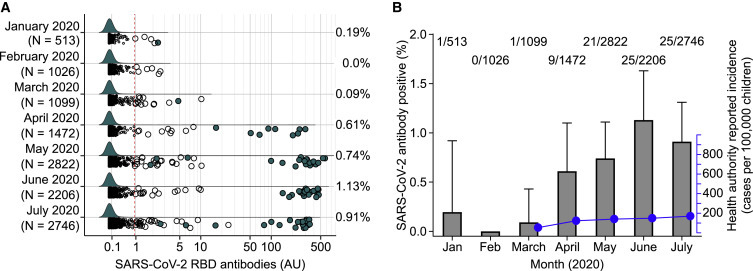
Immune Surveillance for SARS-CoV-2 Antibodies in the Fr1da Study for Children with Samples Obtained in 2020
(A) SARS-CoV-2 RBD antibody values in 11,884 children sampled between January and July 2020. Samples with antibody titers >0.9 AU are shown as large circles. Samples fulfilling the definition of antibody-positive status (RBD antibody titers >0.9 AU and positive for anti-nucleocapsid antibodies) are indicated as filled circles. The red broken lines indicate the logarithmic mean plus 5 SD at >0.9 AU.
(B) Frequency of SARS-CoV-2 antibody-positive children per month in 2020 (gray bars and left y axis) and the cumulative incidence of health authority reported virus-positive children by the end of each month from March through to July (blue dots and lines, right y axis). Error bars show the upper 95% confidence interval for the antibody prevalence.
AU, arbitrary unit; IgG, immunoglobulin G; RBD, receptor binding domain; SARS-CoV-2, severe acute respiratory syndrome coronavirus 2. See also Tables S2, S3 and S4 and Figures S3 and S4.
Incidence of Health Authority-Reported Virus-Positive Cases in Bavarian Children
The incidence of SARS-CoV-2 virus-positive cases in Bavaria was determined from health authority-reported data (Bavarian Health and Food Safety Authority). In comparison to the antibody frequencies, the cumulative incidence of authority-reported virus-positive cases in Bavarian children aged 0 to 18 years was around 2-fold lower at March (46 per 100,000), and around 6- to 8-fold lower at the end of April (111 per 100,000), May (129 per 100,000), June (136 per 100,000), and July (156 per 100,000) (Figure 3B). Unlike the SARS-CoV-2 antibodies, the incidence of authority-reported virus-positive cases was lower in children aged 0 to 6 years (111 per 100,000 at the end of July) than in children aged 7 to 18 years (182 per 100,000; p < 0.0001) and both were lower than in adults (438 per 100,000; p < 0.0001) (Table S4).
Regional Differences in SARS-CoV-2 Antibody Frequencies among Bavarian Children
In addition to the temporal spread of the antibody responses, the Fr1da study provided an opportunity to examine demographic differences in antibody frequencies. Bavaria is divided into seven administrative regions, with four northern- (approximately 40% of the Bavarian population) and three southern-located regions. There was a marked variation in the frequency of SARS-CoV-2 antibody-positive children from April and July between regions (p < 0.0001; Figure 4 A; Table S5), ranging from 0.28% (4/1,418) in Middle Franconia to 1.63% (9/551) in Lower Bavaria (p = 0.0023). Prevalence was 3.5-fold higher in the southern regions (66 of 5,268; 1.25%, 95% confidence interval [CI], 0.97–1.59) than in the northern regions (14 of 3,914; 0.36%, 95% CI, 0.20–0.60; p < 0.0001). There was also an east-west gradient. Nearby locations with marked variation in frequencies were also observed. For example, 8 of 164 (4.9%) children tested from the adjacent Starnberg and Landsberg districts were positive compared with 5 of 730 (0.7%; p = 0.0006) children tested in the Augsburg district, which is adjacent to Landsberg. The highest incidence of health authority-reported SARS-CoV-2-positive cases in children aged 0 to 18 years was also observed in southern and eastern Bavarian regions and lowest in the north-western regions, but was discordant with the antibody frequencies for Swabia and for Upper Franconia (Figure 4B; Table S6). In a logistic regression analysis, the frequency of SARS-CoV-2 antibodies was associated with living in southern Bavaria (odds ratio [OR], 3.6; 95% CI, 2.1–6.7; p < 0.001), but not with older age (OR, 1.25; 95% CI, 0.67–2.17; p = 0.45) or sex (OR, 1.02; 95% CI, 0.65–1.59; p = 0.94; Table S7).
Figure 4.
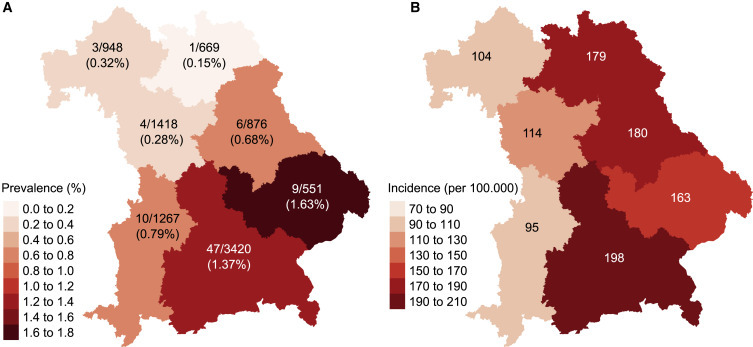
Regional Variation in SARS-CoV-2 Antibody Prevalence and Health Authority-Reported Incidence of Virus-Positive Cases
(A) The frequency of antibody-positive children for the period of April to July 2020 in the seven administrative regions of Bavaria is indicated as a heatmap. The number of antibody-positive children out of the total number tested in the regions is also indicated.
(B) The incidence of health authority-reported virus-positive children per 100,000 children inhabitants by July 31, 2020 in the seven administrative regions indicated as a heatmap.
Follow-Up of Children with Antibodies to SARS-CoV-2
Follow-up blood samples were obtained in 17 SARS-CoV-2 antibody-positive children after a median of 98 days (range, 36 to 134). RBD antibodies were titrated in both sets of samples. RBD antibody titers increased from the first sample (median, 666.4 AU; IQR 123.5–941.3) to the second sample (median, 875.0 AU; IQR, 643.0–1,167.1; p = 0.03) (Figure S4A). No differences were observed between the first and second sample for nucleocapsid antibody titers (Figure S4B). One child with 1.83 AU for SARS-CoV-2 RBD antibodies in the first sample became RBD antibody negative (0.63 AU) after 42 days but retained nucleocapsid antibodies (60 AU to 37 AU).
Inhibition of RBD Binding to ACE2 by SARS-CoV-2 Antibodies in Children
There was insufficient sample available in the children to perform virus neutralization tests. We, therefore, established an assay to measure the capacity of sera positive for SARS-CoV-2 antibodies to inhibit the binding of RBD to recombinant biotinylated ACE2. Binding inhibition ranged from −0.2% to 26.3% (median, 15.8%) in SARS-CoV-2 antibody-negative children (n = 22) and from −5.8% to 94.1% (median, 59.4%) in SARS-CoV-2 antibody-positive children (n = 74; p < 0.0001) (Figure 5 A). Binding inhibition was >26.3% in 61 of 74 (82.4%) antibody-positive children. Binding inhibition in the antibody-positive samples was correlated with SARS-CoV-2 RBD antibody titer (r = 0.71; p < 0.0001) (Figure 5B).
Figure 5.
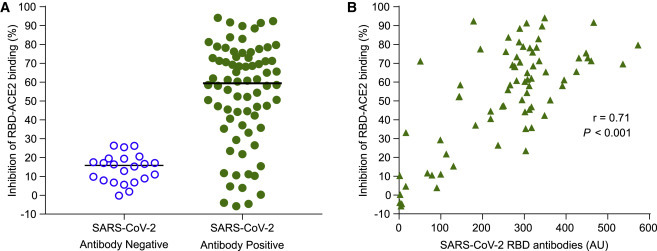
Serum Inhibition of RBD Binding to Its Receptor ACE2
(A) The ability of SARS-CoV-2 antibody-negative sera (open circles, n = 22 children) and -positive sera (filled green circles, n = 74 children) to inhibit the binding of nanoluciferase-tagged RBD to biotinylated recombinant ACE2 coated streptavidin Sepharose beads. Maximum RBD binding to ACE2-Sepharose beads corresponded to approximately 90,000 light units and background binding of RBD to uncoated beads corresponded to approximately 300 light units.
(B) Inhibition of binding (y axis) is shown against the SARS-CoV-2 RBD antibody titer (x axis) for the antibody-positive children (n = 74).
Antibodies to SARS-CoV-2, Symptoms, and Virus Positivity
Questionnaires on previous SARS-CoV-2 virus positivity and symptoms were completed by parents for 4,859 children enrolled from the middle of April to July (Figure 6 ; Table S8). A previous virus-positive result was reported by parents for 12 (0.25%) children, COVID-19-like or flu-like symptoms were reported in 514 (10.6%) children, including 9 of 12 virus-positive children, and 88 (1.8%) children had a virus-positive family member. No symptoms in the child and no previous virus positivity in the child or family members were reported in 4,296 (88.4%) children. SARS-CoV-2 antibodies were observed in 46 (0.95%) of the 4,859 children. This included 11 of the 12 (91.7%) children reported as SARS-CoV-2 virus positive, 20 of 77 (26%) children without a virus-positive report but with a virus-positive family member, 4 of 474 (0.84%) children with symptoms but without a virus-positive report or virus-positive family member, and in 11 of 4,296 (0.3%) of the remaining children (p < 0.0001). There were no differences in the SARS-CoV-2 RBD antibody titers in the positive children between these groups (Figure S5).
Figure 6.
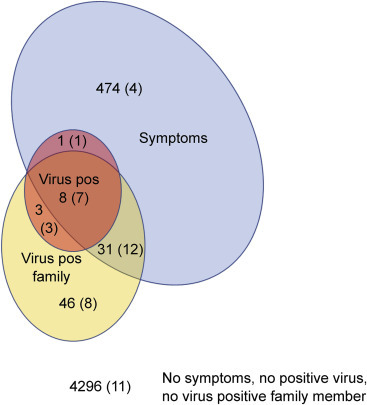
SARS-CoV-2 Antibodies in Relation to Family Communicated Virus Positivity and Symptoms
The questionnaire data from 4,859 children are shown as a Venn diagram depicting children who were indicated as virus positive (pale red, n = 12), having COVID-19-like or flu-like symptoms (blue, n = 514), having a virus-positive family member (n = 88), and those without virus, symptoms, or a virus-positive family member (n = 4,296). The number of children in each of the Venn diagram sectors is indicated and the number of the children in each sector who was SARS-CoV-2 antibody-positive is given in parentheses.
Of the 47 SARS-CoV-2 antibody-positive or virus-positive children with completed questionnaires, 22 (46.8%) did not report symptoms, and 11 (24%) were reported to have no symptoms and no family member with a positive COVID-19 test. Conversely, 36 of the 47 (77%) SARS-CoV-2 antibody-positive or questionnaire virus-positive children could be identified from within the subgroup of 563 children who had symptoms or a virus-positive family member. Extrapolating these data to virus screening strategies in children indicates that limiting virus testing to the children who have symptoms or a virus-positive family member would require testing of 11.6% of the Bavarian childhood population, with a positivity rate of up to 6.4%, and identify 77% of the total virus-positive cases in the childhood population.
The family data provided an opportunity to assess potential transmission rates to children. Of the 88 children who had at least 1 virus-positive family member, 30 (34.1%) were positive for SARS-CoV-2 antibodies, 11 (12.5%) were reported as virus-positive, and 31 (35.2%) were either antibody or viruspositive. There was no difference in age between the 31 children who were antibody or virus positive (median, 4.1 years; IQR, 2.1–5.1) and the 57 who were negative (median, 3.9 years; IQR, 2.9–5.1; p = 0.91) and no difference in sex between the two groups (55% male versus 49% male; p = 0.80).
Antibodies to SARS-CoV-2, Type 1 Diabetes, and Type 1 Diabetes-Associated Islet Autoantibodies
All children in the Fr1da study were also tested for islet autoantibodies and type 1 diabetes. A total of 236 children were islet autoantibody positive in samples taken between January and July 2020, including 28 with newly detected islet autoantibodies (22 with multiple islet autoantibodies, 6 with single islet autoantibodies) and 208 children previously identified with multiple islet autoantibodies who were sampled as part of follow-up for progression to clinical type 1 diabetes. None of the 28 children with newly detected antibodies was SARS-CoV-2 antibody positive and no increase in the frequency of islet autoantibodies was observed (9 of 2,638, 0.34% from January to March versus 19 of 9,246, 0.21% in April to July; p = 0.25). Two of 208 children with previously detected islet autoantibodies (0.96%) had antibodies to SARS-CoV-2. A total of 12 children progressed to clinical type 1 diabetes in 2020, including 8 children between April and July 2020. None of these 12 children had antibodies to SARS-CoV-2, and of the 82 children with positive SARS-CoV-2 antibodies, none developed type 1 diabetes.
Dried Blood Spot Measurement of Anti-SARS-CoV-2 Antibodies in Newborns
The ability to measure antibodies to SARS-CoV-2 in dried blood spots may facilitate widespread screening. Therefore, we developed a protocol based on overnight elution of stored blood spot punches, as previously described.24 Validating the dried blood spot assay, SARS-CoV-2 RBD antibody titers in the blood spot eluate from SARS-CoV-2 antibody-positive and -negative individuals were highly correlated with those obtained from the corresponding serum samples (Figure 7 A). To estimate the prevalence of SARS-CoV-2 antibodies in women at delivery, anti-SARS-CoV-2 RBD antibodies and, subsequently, nucleocapsid protein antibodies were measured in the eluates from dried blood spots of 1,916 newborn children (936 girls, 48.9%; median age, 2 days; IQR, 0–2 days) enrolled in the Bavarian Freder1k study from April to June 2020 (Figure 1). In total, 9 (0.47%) of the samples were SARS-CoV-2 antibody positive (anti-RBD > 0.9 AU and nucleocapsid antibody positive), including 1 of 757 (0.1%) newborns in April, 3 of 784 (0.4%) in May, and 5 of 375 (1.3%) in June (Figure 7B; Table S9).
Figure 7.
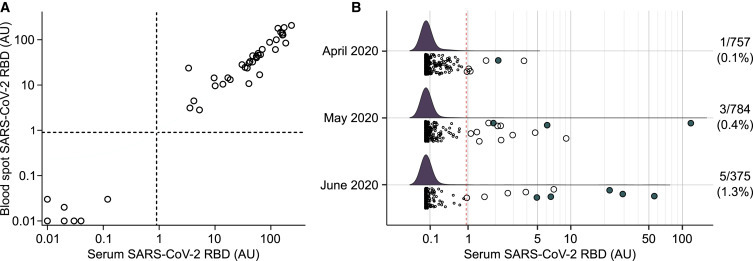
SARS-CoV-2 Antibodies in Newborns
(A) Relationship between SARS-CoV-2 RBD antibody titers in serum (x axis) and the blood spot eluate (x axis) from the same blood draw (n = 45) obtained by the luciferase immunoprecipitation assay used to measure SARS-CoV-2 antibodies, which was adapted to measure eluates from dried blood spots. The dried blood spots were stored at −80°C for a median of 51 days (range, 14 to 66 days) prior to elution and testing.
(B) SARS-CoV-2 RBD antibody titers in the blood spot eluates in 1,916 neonates born between April and June 2020. Samples with RBD antibody titers >0.9 are shown as large circles. Samples fulfilling the definition of positive (anti-RBD >0.9 AU and positive for nucleocapsid protein antibodies) are indicated as filled circles. The dried blood spots from neonates were stored at −80°C for a median of 34 days (range, 7 to 80 days) prior to elution and testing. The red broken line indicates the logarithmic mean plus 5 SD at >0.9 AU.
AU, arbitrary unit; RBD, receptor binding domain; SARS-CoV-2, severe acute respiratory syndrome coronavirus 2. See also Table S9.
Discussion
We developed a highly specific and sensitive strategy to monitor the COVID-19 pandemic in a public health setting. Key elements of the strategy involved screening for IgG antibodies to the virus’ RBD with a highly sensitive test and testing for antibodies to a second antigenic region, the nucleocapsid protein, in individuals who were positive for RBD antibodies. Using this approach, we found an overall SARS-CoV-2 antibody prevalence between April and July 2020 of 0.87% in Bavarian children and 0.47% in newborns. The antibody frequency in children was around 6-fold higher than the incidence of health authority-reported SARS-CoV-2-positive cases in Bavaria, and a 6-fold variation in antibody prevalence was found across the seven Bavarian regions. Almost half of the antibody-positive children did not show symptoms, and transmission rates in children with a virus-positive family member were 35%.
The prevalence of the antibodies in children was substantially higher than the incidence of health authority-reported SARS-CoV-2 cases, but it was nevertheless indicative of low overall exposure to SARS-CoV-2 in children and pregnant women. Bavaria has the highest incidence of SARS-CoV-2 cases in Germany (https://www.lgl.bayern.de/; https://www.rki.de/) and, although there are specific districts with substantially higher frequencies, we do not expect the antibody prevalence to be higher in other German states. Estimates in other countries, mainly in adults, have suggested up to 10-fold higher exposure rates than the authority-reported SARS-CoV-2 cases.25 The extreme specificity of our approach and the relatively high proportion of the Bavarian population that is tested for virus strengthen our estimate of a 6-fold increase in exposure over reported cases in children. We did not observe increased antibody frequencies in the newborn samples (maternal antibodies) as compared to the children. We had no additional information on these positive samples and are, therefore, unable to determine whether the low prevalence is due to low exposure, transmission, and/or immune responses to SARS-CoV-2 in pregnant women.
As frequently noted,5 , 8 , 10, 11, 12, 13 , 16, 17, 18 the estimated frequency is largely influenced by the specificity of the testing strategy and methods used, potentially leading to greatly overestimated population prevalence. Our study demonstrated how a strategy that combines a screening test with a confirmatory test can achieve the necessary specificity of 100% without compromising sensitivity. We do not claim that the LIPS assays used in this study are superior to existing tests and stress that neither the RBD nor the nucleocapsid antibody test had 100% specificity. The use of either test alone would have identified many false positives, and we emphasize that a critical aspect of our study is the demonstration that 100% specificity can be achieved if multiple assays are used. To our knowledge, this and the study performed in Spain10 are the only public health screenings that have used a second different test for confirmation to determine population antibody prevalence. The Centers for Disease Control recommends a similar strategy (https://www.cdc.gov/coronavirus/2019-ncov/lab/resources/antibody-tests-guidelines.html) but does not state that the confirmatory test should target a different SARS-CoV-2 antigen. We suggest that our approach has the advantage of a low rate of false positives arising from cross-reactivity to other beta coronaviruses if positivity is defined using both the RBD and nucleocapsid protein. The availability of sensitive and specific multiplexed assays that measure and distinguish antibodies to multiple SARS-CoV-2 antigens may improve the practicality of the approach and may increase sensitivity.
The study has a number of strengths. The test procedure and thresholds to define positives were developed using many samples obtained prior to the first reported cases of SARS-CoV-2 infection in Germany (January 2020) and were validated using a second set of samples. These samples were collected under the same conditions as samples used for immune surveillance. The specificity of positives was validated further by competition assays. We were also able to show that samples with high-titer RBD antibodies identified in 2020 inhibited the binding of SARS-CoV-2 RBD to its receptor, ACE2, suggesting that these antibodies are likely to interfere with virus entry and may have infection-neutralizing potential. Follow-up measurements, which were performed on 20% of the positive children, did not show a loss of IgG antibodies over a median period of 3 months, except in one child with low titer antibodies. The study covers the whole of Bavaria and has been shown to be representative of its pediatric population21 (https://www.lgl.bayern.de/), and antibody prevalence could be directly compared to the incidence of health authority-reported virus-positive children in the region over the same time period. The samples were derived from capillary blood, which facilitates the application of this screening strategy in the general population, and the test procedure was extended to testing dried blood spots on filter paper. The procedure has been set up for relatively high throughput, including semi-automated processes for punching dried blood spots, and robotic handling of samples and currently allows for over 1,000 samples to be tested daily.
The temporal and regional differences in prevalence are consistent with our expectations. IgG antibodies against the virus can take 1–4 weeks to manifest and, because the majority of infections in Germany occurred in March and April, an increase in the prevalence and antibody titers among positive samples from March is expected. A higher prevalence in southern and eastern Bavaria was also consistent with the reported frequency of virus-positive cases. Nevertheless, the regional and district variations in antibody prevalence show and confirm notable differences in exposure across a single state, highlighting the importance and likely benefit of broad virus monitoring that can detect local outbreaks and allow local isolation. Although antibody measurements cannot be used for screening due to the delay in their manifestation, they provide important retrospective surveillance data to prepare for the future. Accordingly, it should be emphasized that population-based screening studies with consented biobanking of blood samples, like the Fr1da study, provide an exceptional resource that will allow us to assess and track viral exposure in the community quickly, especially if combined with questionnaires on exposure. The inclusion of IgM and IgA antibody measurements would allow the detection of earlier cases and should be considered if these measurements were sufficiently specific.
There is interest in the possibility of SARS-CoV-2 infection causing or accelerating the onset of diabetes, including type 1 diabetes.26 Evidence includes a case report of type 1 diabetes following SARS-CoV-2 infection.27 The Fr1da study was designed to detect and follow children with pre-symptomatic type 1 diabetes.21 We observed no increase in the frequency of pre-symptomatic type 1 diabetes and no association between SARS-CoV-2 antibodies and type 1 diabetes autoantibodies or the development of type 1 diabetes in islet autoantibody-positive children, suggesting that SARS-CoV-2 will not lead to a large increase in the incidence of autoimmune type 1 diabetes in childhood.
The study also provided data that may be relevant to understanding transmission rates in children as well as practical information for tracking virus-positive children. Almost two-thirds of children who had virus-positive family members were negative for SARS-CoV-2 antibodies and virus. Although we do not have data on efforts to minimize exposure in these children, the finding suggests a less than 50% transmission rate to children. Transmission rate in children is consistently shown to be lower than in adults.28 The large majority of studies, however, show transmission rates of less than 20% in children,29, 30, 31, 32 which is markedly lower than our estimate. Most of the previous findings were from China and, unlike our study, few were based on serology. It is largely accepted that children have fewer symptoms than adults and, as a result, are less frequently tested for virus positivity.29 , 33 , 34 Consistent with this, almost half of the antibody-positive children were asymptomatic, indicating that only testing children with symptoms will not be effective in identifying virus-positive children. Around half of the asymptomatic cases had virus-positive family members. Therefore, a strategy that tests children with symptoms and children who had contact with virus-positive individuals is likely to identify the majority, but not all, of childhood cases.
Tracking virus exposure in a pandemic was made possible by the availability of highly specific and sensitive virus antibody testing using a two-step multiple antigen approach and population screening programs with consented biobanking. The ability to quickly implement testing in the population before and after the spread of virus has provided a realistic estimate of exposure that is around 1% of the childhood population of Bavaria, Germany, with substantial regional variation but no sex or marked age-related differences. Based on these findings, exposure is around 6-fold higher than the childhood incidence of health authority-reported virus-positive cases. We, therefore, strongly advocate the implementation of national disease screening programs, which can be rapidly made available to help the readiness of countries to contain virus spread and monitor the impact of containment policies.
Limitations of Study
The relative stability of antibodies over time was based on follow-up samples from only 20% of the antibody-positive children and, therefore, may be inaccurate. The inhibiting antibody capacity of the antibodies in children was estimated by a surrogate method as there was insufficient sample volume for virus-neutralizing antibody assays. We did not validate the specificity of our approach in samples from individuals who were known to have been exposed to other coronaviruses. We expect that the 2019 samples, all of which were negative, included children who had previously been infected by other beta coronaviruses. Nevertheless, we cannot exclude the presence of false positives due to beta coronavirus cross-reactivity. Questionnaires with information on virus positivity and symptoms were not completed for a large number of children enrolled in April to July and, although the study was performed as part of a type 1 diabetes screening program, we cannot exclude the possibility of selection bias for virus-positive children in some pediatric clinics. The frequency of questionnaire-reported virus-positive children (0.23%) was similar to the health authority-reported virus-positive prevalence (0.16%) among children aged 0–18 years in Bavaria, suggesting little or no bias. Moreover, the frequency of SARS-CoV-2 antibodies among children with completed questionnaires (0.95%) was also similar to the antibody frequency in the total cohort (0.87%). It is also possible that the sensitivity of dual antigen testing has missed some true positive cases that have antibodies to other regions of the spike protein35 and that additional antigens may further increase sensitivity without compromising specificity. Finally, only IgG antibodies were measured, and we cannot assess whether the inclusion of IgM or IgA could improve the screening strategy.
STAR★Methods
Key Resources Table
| REAGENT or RESOURCE | SOURCE | IDENTIFIER |
|---|---|---|
| Biological Samples | ||
| Human serum (Fr1 da study) | Institute of Diabetes Research, Helmholtz Center Munich | N/A |
| Human blood spots (Freder1k study) | Institute of Diabetes Research, Helmholtz Center Munich | N/A |
| Human serum (SARS-CoV-2 positive individuals, Munich Bioresource Study) | Institute of Diabetes Research, Helmholtz Center Munich | N/A |
| Human serum (SARS-CoV-2 positive individuals) | Institute of Virology, Technical University Munich | N/A |
| Chemicals, Peptides, and Recombinant Proteins | ||
| Nanoluciferase-tagged RBD | Vito Lampasona (this paper) | N/A |
| Nanoluciferase-tagged Nucleocapsid protein | Vito Lampasona (this paper) | N/A |
| Protein A-Sepharose CL-4B | GE Healthcare | GE17-0780-01 |
| Streptavidin Sepharose High Performance | GE Healthcare | GE17-5113-01 |
| Purified recombinant RBD | Kathrin de la Rosa (this paper) | N/A |
| Biotinylated purified recombinant ACE2 | Kathrin de la Rosa (this paper) | N/A |
| Critical Commercial Assays | ||
| Nano-Glo Luciferase Assay | Promega | N1120 |
| Experimental Models: Cell Lines | ||
| Expi293F cells | Thermo Fisher Scientific Life Technologies | A14527; RRID:CVCL_D615 |
| Recombinant DNA | ||
| Plasmid pCMV-TnT | Promega | L5620 |
| Plasmid IL6sp-secNluc-SARS-CoV-2-RBD | Vito Lampasona (this paper) | N/A |
| Plasmid Nluc-SARS-CoV-2- nucleocapsid | Vito Lampasona (this paper) | N/A |
| Plasmid IL6sp-secNluc-HuCoV-OC43-RBD | Vito Lampasona (this paper) | N/A |
| Software and Algorithms | ||
| GraphPad Prism Version 8.3.1 | GraphPad Software, San Diego, CA | N/A |
| R v4.0.2 package finalfit v1.0.2 | https://CRAN.R-project.org/doc/FAQ/R-FAQ.html | https://cran.r-project.org/web/packages/finalfit/index.html |
Resource Availabilty
Lead Contact
Further information and requests for resources and reagents should be directed to and will be carried out by the Lead Contact, Anette-G Ziegler (anette-g.ziegler@helmholtz-muenchen.de).
Materials Availability
Requests for purified recombinant RBD and biotinylated purified recombinant ACE2 should be directed to the Lead Contact.
Data and Code Availability
All reasonable requests for raw and analyzed data and materials will be promptly reviewed by the corresponding author to determine whether the request is subject to confidentiality obligations. Any data that can be shared will be made available from the corresponding author on reasonable request, with appropriate additional ethical approvals, and released via a material transfer agreement.
Experimental Model and Subject Details
Public Health Screening Population
The Fr1 da study is a public health research study in Bavaria, Germany that offers screening for type 1 diabetes-associated autoantibodies to children without a previous diagnosis of diabetes in the context of Well-Child Care visits. Capillary blood samples are collected by primary care pediatricians and sent to the central laboratory located at Helmholtz Zentrum, Munich, Germany. Sera not used for autoantibody testing may be stored in the Helmholtz biobank. A total of 684 primary care pediatricians in Bavaria participate in the study. The detailed study design is published elsewhere.21 , 22 Biobanked samples obtained in April and May 2019 and between August 2019 and July 2020 were tested for antibodies to SARS-CoV-2. Demographic data (age, sex) and, since April 2020 optional information data about SARS-CoV-2 infections in the child or family, or symptoms of COVID-19 or flu-like disease in the child were collected using a questionnaire at the pediatric visit. The database and study were coordinated by Helmholtz Zentrum. Written informed consent was obtained from the children’s parents or legal guardians. The Fr1 da study and testing of antibodies to SARS-CoV-2 were approved by the institutional review board at Technical University of Munich, Munich, Germany (#70/14 s and #235/20 s).
The Freder1k study is part of the Global Platform of the Prevention of Autoimmune Diabetes (GPPAD).36 It offers screening for increased genetic risk of type 1 diabetes as a path for enrollment into primary prevention trials among children in Bavaria, Germany.23 Dried blood spots are collected on filter paper cards by obstetric clinics during routine newborn screening and sent to the central laboratory located at Helmholtz Zentrum. For blood spots not used for genetic testing of type 1 diabetes risk, storage at −80°C in the Helmholtz biobank is offered. A total of 33 obstetric departments in Bavaria participate in the study. Biobanked blood spots obtained from April to June 2020 were punched (DBS Puncher®; Perkin Elmer, Waltham, MA) and eluted overnight in 50 μL of buffer at 40°C, and the eluate was tested for autoantibodies to SARS-CoV-2. The median storage time from collection to sample testing was 34 days (range 7 to 80 days). Written informed consent was obtained from the children’s parents or legal guardians. Ethical approval was obtained from the Technical University of Munich (number 138/17 s).
Virus-positive cohort
Serum and dried blood spots were obtained from 55 people with recent COVID-19 and polymerase chain reaction (PCR)-confirmed virus infection from the Helmholtz community (Munich Bioresource Study) with ethical approval from Technical University of Munich (number 5049/11). Dried blood spots were stored at −80°C for a median time of 51 days (range, 16 to 66 days) before testing. Sera and blood spots were not tested in the same assays. In addition, 20 samples from patients with active or recent COVID-19 and ELISA-positive SARS-CoV-2 antibodies were kindly provided by the Virology Department of the Hospital of the Technical University of Munich.
Information on the sex and age of study subjects is displayed in Table S1.
Method Details
SARS-CoV-2 antibody tests
The nanoluciferase-tagged RBD and nucleocapsid proteins were prepared and provided by Vito Lampasona (Ospedale San Raffaele, Milan, Italy). Coding sequences were obtained as synthetic genes (Eurofins Genomics, Eurofins Scientific Group, Luxembourg) for cloning into modified pCMV-TnT (Promega, Madison, WI) vectors containing secretory Nanoluciferase (RBD) modified to contain the IL-6 signal peptide or Nanoluciferase (nucleocapsid protein) reporters. Recombinant nanoluciferase-tagged antigens were expressed by transient transfection of plasmid into Expi293F cells (Expi293 Expression System, Thermo Fisher Scientific Life Technologies, Carlsbad, CA, USA). Recombinant proteins were harvested in the supernatant after 48 h. The recombinant antigens were then aliquoted and stored frozen at −80°C. Antibodies were measured by LIPS assays.37 , 38 We developed assays similar to those used to measure antibodies to Coxsackie B virus39 and proinsulin.40 Briefly, serum (1 μL) or blood spot eluate (20 μL) was added to buffer (25 μL) containing 4 million light units (counts per second [cps]) of luciferase-tagged protein in deep 96-well plates, incubated at room temperature for 2 h, followed by the addition of buffer (50 μL) containing glycine-treated protein A Sepharose (GE Healthcare, Chicago, IL). Plates were incubated for 1 h at 4°C, washed six times with wash buffer (750 μL). Protein A Sepharose was transferred to a microplate (OptiPlate-96, Perkin Elmer), substrate (40 μL) was added, and the captured light units were measured on a multimode microplate reader (GloMax Explorer, Promega). The values were converted to arbitrary units using a calibration curve of serum obtained from a PCR-positive donor (Munich Diabetes Bioresource, Munich, Germany) diluted in negative serum over a range of 0.1 to 100 AU and included in every assay (Figure S1A). The inter-assay coefficients of variation for control samples with values of 5.8 and 1.4 AU in the anti-SARS-CoV-2 RBD assay were 17% and 17%, respectively. For antibody positive children who had a follow-up sample, RBD antibodies in both samples were titrated (undiluted, 1/10, 1/100, 1/1000) and the titer extrapolated from the lowest dilution that yielded a result within the calibration curve range (i.e., less than 100 AU). The Fr1 da and Freder1k study samples were first screened to detect anti-RBD antibodies, and samples with antibody titers > 0.9 AU were then tested for anti-nucleocapsid antibodies and in competition assays with purified RBD protein. For the competition assays, duplicate wells with additional buffer (5 μL) (control) or buffer (5 μL) containing purified RBD protein (40 μg) (competitor) were tested. Inhibition was defined as a reduction in the AU by > 50% in the presence of the competitor. Antibodies to the RBD of the OC43 beta coronavirus were measured LIPS as described for SARS-CoV-2 RBD antibodies. Antibodies in samples obtained from the Virology Department of the Hospital of the Technical University of Munich were also measured using a commercially available Euroimmun SARS-CoV-2 IgG antibody ELISA (Euroimmun AG, Lübeck, Germany).
Inhibition of RBD-ACE2 binding
Biotinylated purified recombinant ACE2 (prepared and provided by Kathrin de la Rosa, MDC, Berlin) was combined with streptavidin Sepharose beads (GE Healthcare) at a ratio of 40 ng per 5 μl beads and incubated overnight at 4°C. Serum (1 μL) was incubated with nanoluciferase-tagged RBD (25 μL) containing 4x10⁵ light units for 1.5 h at room temperature and added to 5-times washed ACE2-Sepharose beads in 30 μL assay buffer (the equivalent of 40 ng recombinant protein/5 μL bead mix was used per 1 μL serum) and the beads plus serum/RBD mix incubated for 2h at room temperature on a shaker. Beads were washed five times in wash buffer and the luciferase activity remaining on the beads measured as for the SARS-CoV-2 antibody LIPS assay. Maximum binding was determined by incubating washed ACE2-Sepharose beads with nanoluciferase-tagged RBD in the absence of serum. Background binding of nanoluciferase-tagged RBD to Sepharose beads was determined by incubating nanoluciferase-tagged RBD with sepahrose beads in the absence of ACE2. Binding inhibition (%) was calculated as ((Maximum binding – background) – (binding in the presence of serum – background))/(Maximum binding – background)∗100.
Quantification and Statistical Analysis
The incidence of virus-positive cases in Bavaria (cases per 100,000 inhabitants) was calculated as the ratio of the cumulative number of cases reported to the Bavarian Health and Food Safety Authority by the end of each month in each of the age groups examined to the number of inhabitants in Bavaria in each age group as reported in December 2019. Comparisons between groups were performed by Fisher’s exact test for categorical variables or the Mann–Whitney U test for quantitative variables, and correlations were calculated using Spearman’s test with GraphPad Prism Version 8.3.1 (GraphPad Software, San Diego, CA). Univariable and multivariable logistic regression was performed using data for children with samples obtained between April and July 2020 with complete age, sex, sample date, and location information, using the package finalfit v1.0.2 in R v4.0.2. All reported P values are two-tailed and a P value of < 0.05 was considered significant.
Additional Resources
Fr1da Study ClinicalTrials.gov Identifier: NCT04039945 https://clinicaltrials.gov/ct2/show/NCT04039945
Freder1k Study ClinicalTrials.gov Identifier: NCT03316261 https://clinicaltrials.gov/ct2/show/NCT03316261
Acknowledgments
The work was supported by grants from the Federal Ministry of Education and Research (grant FKZ01KX1818) and the German Center for Diabetes Research (DZD e.V.). The Fr1da study is funded by LifeScience-Stiftung (HMGU19.01), JDRF (3-SRA-2019-718-Q-R), and The Helmsley Charitable Trust (G-1911-03274 and G-1911-03274). The Freder1k study is funded by The Helmsley Charitable Trust (GPPAD-02 and G-2018PG-T1D022). We are grateful to the participating families and children and members of the Fr1da and Freder1k study teams. We thank Christiane Winkler for project management; Marlon Scholz, Claudia Matzke, Phillip Sifft, Cigdem Gezginci, Katharina Sarcletti, Stefanie Jacobsen, Willi Gräz, Merve Vurucu, and Rebecca Niewoehner for technical assistance; Sandra Steinebrunner and Melanie Bunk for assistance with patient management; and Nana Kwarteng, Anja Heublein, Charlotte Koch, Claudia Ramminger, Jennifer Schmidt, Joanna Stock, Annette Knopff, Nadine Klein, Laura Wörner, Lisa Ruwolt, Mona Walter, Yvonne Kriesen, Annette Munzinger, Cornelia Kraus, and Jasmin Ohli for data organization. We also thank the primary care pediatricians and clinicians from obstetric departments in Bavaria for participating in the Fr1da and Freder1k studies. For a complete list of participating Fr1da primary care pediatricians and Freder1k obstetric clinicians, please see the Supplemental Information.
Author Contributions
M. Hippich, L.H., R.A., and H.K. measured SARS-CoV-2 antibodies. S.H. and A.K. provided logistical support and prepared the samples. J.M.Z.G., M. Heigermoser, and F.H. established the database and performed the statistical analyses. D.A.E., T.C.W., and B.A.M. were responsible for the acquisition of samples. J.S. and F.V. performed data entry and cleaning and supported study logistics. M.S., L.P., and V.L. established antigen constructs and provided the antigen for the tests. K.D.R. provided recombinant proteins. U.P. contributed samples from COVID-19-positive patients. M.B. provided data on health authority-reported virus-positive cases and incidence in Bavaria. E.B. established and oversaw all the antibody measurements. A.G.Z. and E.B. were responsible for study design and data analyses. A.G.Z. was the principal investigator and was responsible for study conduct. E.B. and A.G.Z. drafted the manuscript. M. Hippich, L.H., R.A., and P.A. were involved in the interpretation of the results and preparation of the manuscript. All authors read and approved the final version of the manuscript.
Declaration of Interests
The authors declare no competing interests.
Published: October 29, 2020
Footnotes
Supplemental Information can be found online at https://doi.org/10.1016/j.medj.2020.10.003.
Supplemental Information
References
- 1.Zhu N., Zhang D., Wang W., Li X., Yang B., Song J., Zhao X., Huang B., Shi W., Lu R., et al. China Novel Coronavirus Investigating and Research Team A Novel Coronavirus from Patients with Pneumonia in China, 2019. N. Engl. J. Med. 2020;382:727–733. doi: 10.1056/NEJMoa2001017. [DOI] [PMC free article] [PubMed] [Google Scholar]
- 2.Long Q.X., Liu B.Z., Deng H.J., Wu G.C., Deng K., Chen Y.K., Liao P., Qiu J.F., Lin Y., Cai X.F., et al. Antibody responses to SARS-CoV-2 in patients with COVID-19. Nat. Med. 2020;26:845–848. doi: 10.1038/s41591-020-0897-1. [DOI] [PubMed] [Google Scholar]
- 3.Long Q.X., Tang X.J., Shi Q.L., Li Q., Deng H.J., Yuan J., Hu J.L., Xu W., Zhang Y., Lv F.J., et al. Clinical and immunological assessment of asymptomatic SARS-CoV-2 infections. Nat. Med. 2020;26:1200–1204. doi: 10.1038/s41591-020-0965-6. [DOI] [PubMed] [Google Scholar]
- 4.Amanat F., Stadlbauer D., Strohmeier S., Nguyen T.H.O., Chromikova V., McMahon M., Jiang K., Arunkumar G.A., Jurczyszak D., Polanco J., et al. A serological assay to detect SARS-CoV-2 seroconversion in humans. Nat. Med. 2020;26:1033–1036. doi: 10.1038/s41591-020-0913-5. [DOI] [PMC free article] [PubMed] [Google Scholar]
- 5.Deeks J.J., Dinnes J., Takwoingi Y., Davenport C., Spijker R., Taylor-Phillips S., Adriano A., Beese S., Dretzke J., Ferrante di Ruffano L., et al. Cochrane COVID-19 Diagnostic Test Accuracy Group Antibody tests for identification of current and past infection with SARS-CoV-2. Cochrane Database Syst. Rev. 2020;6:CD013652. doi: 10.1002/14651858.CD013652. [DOI] [PMC free article] [PubMed] [Google Scholar]
- 6.Riccò M., Ferraro P., Gualerzi G., Ranzieri S., Henry B.M., Said Y.B., Pyatigorskaya N.V., Nevolina E., Wu J., Bragazzi N.L., Signorelli C. Point-of-Care Diagnostic Tests for Detecting SARS-CoV-2 Antibodies: A Systematic Review and Meta-Analysis of Real-World Data. J. Clin. Med. 2020;9:1515. doi: 10.3390/jcm9051515. [DOI] [PMC free article] [PubMed] [Google Scholar]
- 7.Zhang Z.L., Hou Y.L., Li D.T., Li F.Z. Diagnostic efficacy of anti-SARS-CoV-2 IgG/IgM test for COVID-19: A meta-analysis. J. Med. Virol. 2020 doi: 10.1002/jmv.26211. Published online June 22, 2020. [DOI] [PMC free article] [PubMed] [Google Scholar]
- 8.Lisboa Bastos M., Tavaziva G., Abidi S.K., Campbell J.R., Haraoui L.P., Johnston J.C., Lan Z., Law S., MacLean E., Trajman A., et al. Diagnostic accuracy of serological tests for covid-19: systematic review and meta-analysis. BMJ. 2020;370:m2516. doi: 10.1136/bmj.m2516. [DOI] [PMC free article] [PubMed] [Google Scholar]
- 9.Sood N., Simon P., Ebner P., Eichner D., Reynolds J., Bendavid E., Bhattacharya J. Seroprevalence of SARS-CoV-2-Specific Antibodies Among Adults in Los Angeles County, California, on April 10-11, 2020. JAMA. 2020;323:2425–2427. doi: 10.1001/jama.2020.8279. [DOI] [PMC free article] [PubMed] [Google Scholar]
- 10.Pollán M., Pérez-Gómez B., Pastor-Barriuso R., Oteo J., Hernán M.A., Pérez-Olmeda M., Sanmartín J.L., Fernández-García A., Cruz I., Fernández de Larrea N., et al. ENE-COVID Study Group Prevalence of SARS-CoV-2 in Spain (ENE-COVID): a nationwide, population-based seroepidemiological study. Lancet. 2020;396:535–544. doi: 10.1016/S0140-6736(20)31483-5. [DOI] [PMC free article] [PubMed] [Google Scholar]
- 11.Stringhini S., Wisniak A., Piumatti G., Azman A.S., Lauer S.A., Baysson H., De Ridder D., Petrovic D., Schrempft S., Marcus K., et al. Seroprevalence of anti-SARS-CoV-2 IgG antibodies in Geneva, Switzerland (SEROCoV-POP): a population-based study. Lancet. 2020;396:313–319. doi: 10.1016/S0140-6736(20)31304-0. [DOI] [PMC free article] [PubMed] [Google Scholar]
- 12.Xu X., Sun J., Nie S., Li H., Kong Y., Liang M., Hou J., Huang X., Li D., Ma T., et al. Seroprevalence of immunoglobulin M and G antibodies against SARS-CoV-2 in China. Nat. Med. 2020;26:1193–1195. doi: 10.1038/s41591-020-0949-6. [DOI] [PubMed] [Google Scholar]
- 13.Bryan A., Pepper G., Wener M.H., Fink S.L., Morishima C., Chaudhary A., Jerome K.R., Mathias P.C., Greninger A.L. Performance Characteristics of the Abbott Architect SARS-CoV-2 IgG Assay and Seroprevalence in Boise, Idaho. J. Clin. Microbiol. 2020;58 doi: 10.1128/JCM.00941-20. e00941–e20. [DOI] [PMC free article] [PubMed] [Google Scholar]
- 14.Erikstrup C., Hother C.E., Pedersen O.B.V., Mølbak K., Skov R.L., Holm D.K., Sækmose S.G., Nilsson A.C., Brooks P.T., Boldsen J.K., et al. Estimation of SARS-CoV-2 infection fatality rate by real-time antibody screening of blood donors. Clin. Infect. Dis. 2020 doi: 10.1093/cid/ciaa849. Published online June 25, 2020. [DOI] [PMC free article] [PubMed] [Google Scholar]
- 15.Salje H., Tran Kiem C., Lefrancq N., Courtejoie N., Bosetti P., Paireau J., Andronico A., Hozé N., Richet J., Dubost C.L., et al. Estimating the burden of SARS-CoV-2 in France. Science. 2020;369:208–211. doi: 10.1126/science.abc3517. [DOI] [PMC free article] [PubMed] [Google Scholar]
- 16.Whitman J.D., Hiatt J., Mowery C.T., Shy B.R., Yu R., Yamamoto T.N., Rathore U., Goldgof G.M., Whitty C., Woo J.M., et al. Test performance evaluation of SARS-CoV-2 serological assays. medRxiv. 2020 doi: 10.1101/2020.04.25.20074856. [DOI] [Google Scholar]
- 17.Espejo A.P., Akgun Y., Al Mana A.F., Tjendra Y., Millan N.C., Gomez-Fernandez C., Cray C. Review of Current Advances in Serologic Testing for COVID-19. Am. J. Clin. Pathol. 2020;154:293–304. doi: 10.1093/ajcp/aqaa112. [DOI] [PMC free article] [PubMed] [Google Scholar]
- 18.Kumleben N., Bhopal R., Czypionka T., Gruer L., Kock R., Stebbing J., Stigler F.L. Test, test, test for COVID-19 antibodies: the importance of sensitivity, specificity and predictive powers. Public Health. 2020;185:88–90. doi: 10.1016/j.puhe.2020.06.006. [DOI] [PMC free article] [PubMed] [Google Scholar]
- 19.Branda J.A., Body B.A., Boyle J., Branson B.M., Dattwyler R.J., Fikrig E., Gerald N.J., Gomes-Solecki M., Kintrup M., Ledizet M., et al. Advances in Serodiagnostic Testing for Lyme Disease Are at Hand. Clin. Infect. Dis. 2018;66:1133–1139. doi: 10.1093/cid/cix943. [DOI] [PMC free article] [PubMed] [Google Scholar]
- 20.Ziegler A.G., Rewers M., Simell O., Simell T., Lempainen J., Steck A., Winkler C., Ilonen J., Veijola R., Knip M., et al. Seroconversion to multiple islet autoantibodies and risk of progression to diabetes in children. JAMA. 2013;309:2473–2479. doi: 10.1001/jama.2013.6285. [DOI] [PMC free article] [PubMed] [Google Scholar]
- 21.Ziegler A.G., Kick K., Bonifacio E., Haupt F., Hippich M., Dunstheimer D., Lang M., Laub O., Warncke K., Lange K., et al. Fr1da Study Group Yield of a Public Health Screening of Children for Islet Autoantibodies in Bavaria, Germany. JAMA. 2020;323:339–351. doi: 10.1001/jama.2019.21565. [DOI] [PMC free article] [PubMed] [Google Scholar]
- 22.Raab J., Haupt F., Scholz M., Matzke C., Warncke K., Lange K., Assfalg R., Weininger K., Wittich S., Löbner S., et al. Fr1da Study Group Capillary blood islet autoantibody screening for identifying pre-type 1 diabetes in the general population: design and initial results of the Fr1da study. BMJ Open. 2016;6:e011144. doi: 10.1136/bmjopen-2016-011144. [DOI] [PMC free article] [PubMed] [Google Scholar]
- 23.Winkler C., Haupt F., Heigermoser M., Zapardiel-Gonzalo J., Ohli J., Faure T., Kalideri E., Hommel A., Delivani P., Berner R., et al. GPPAD Study Group Identification of infants with increased type 1 diabetes genetic risk for enrollment into Primary Prevention Trials-GPPAD-02 study design and first results. Pediatr. Diabetes. 2019;20:720–727. doi: 10.1111/pedi.12870. [DOI] [PMC free article] [PubMed] [Google Scholar]
- 24.Bingley P.J., Rafkin L.E., Matheson D., Steck A.K., Yu L., Henderson C., Beam C.A., Boulware D.C., TrialNet Study Group Use of Dried Capillary Blood Sampling for Islet Autoantibody Screening in Relatives: A Feasibility Study. Diabetes Technol. Ther. 2015;17:867–871. doi: 10.1089/dia.2015.0133. [DOI] [PMC free article] [PubMed] [Google Scholar]
- 25.Havers F.P., Reed C., Lim T., Montgomery J.M., Klena J.D., Hall A.J., Fry A.M., Cannon D.L., Chiang C.F., Gibbons A., et al. Seroprevalence of Antibodies to SARS-CoV-2 in 10 Sites in the United States, March 23-May 12, 2020. JAMA Intern Med. 2020 doi: 10.1001/jamainternmed.2020.4130. Published online July, 21, 2020. [DOI] [PMC free article] [PubMed] [Google Scholar]
- 26.Rubino F., Amiel S.A., Zimmet P., Alberti G., Bornstein S., Eckel R.H., Mingrone G., Boehm B., Cooper M.E., Chai Z., et al. New-Onset Diabetes in Covid-19. N. Engl. J. Med. 2020;383:789–790. doi: 10.1056/NEJMc2018688. [DOI] [PMC free article] [PubMed] [Google Scholar]
- 27.Hollstein T., Schulte D.M., Schulz J., Glück A., Ziegler A.G., Bonifacio E., Wendorff M., Franke A., Schreiber S., Bornstein S.R., Laudes M. Autoantibody-negative insulin-dependent diabetes mellitus after SARS-CoV-2 infection: a case report. Nat. Metab. 2020 doi: 10.1038/s42255-020-00281-8. [DOI] [PubMed] [Google Scholar]
- 28.Goldstein E., Lipsitch M., Cevik M. On the effect of age on the transmission of SARS-CoV-2 in households, schools and the community. medRxiv. 2020 doi: 10.1101/2020.07.19.20157362. [DOI] [PMC free article] [PubMed] [Google Scholar]
- 29.Bi Q., Wu Y., Mei S., Ye C., Zou X., Zhang Z., Liu X., Wei L., Truelove S.A., Zhang T., et al. Epidemiology and transmission of COVID-19 in 391 cases and 1286 of their close contacts in Shenzhen, China: a retrospective cohort study. Lancet Infect. Dis. 2020;20:911–919. doi: 10.1016/S1473-3099(20)30287-5. [DOI] [PMC free article] [PubMed] [Google Scholar]
- 30.Jing Q.L., Liu M.J., Zhang Z.B., Fang L.Q., Yuan J., Zhang A.R., Dean N.E., Luo L., Ma M.M., Longini I., et al. Household secondary attack rate of COVID-19 and associated determinants in Guangzhou, China: a retrospective cohort study. Lancet Infect. Dis. 2020;20:1141–1150. doi: 10.1016/S1473-3099(20)30471-0. [DOI] [PMC free article] [PubMed] [Google Scholar]
- 31.Li W., Zhang B., Lu J., Liu S., Chang Z., Cao P., Liu X., Zhang P., Ling Y., Tao K., Chen J. The characteristics of household transmission of COVID-19. Clin. Infect. Dis. 2020:ciaa450. doi: 10.1093/cid/ciaa450. [DOI] [PMC free article] [PubMed] [Google Scholar]
- 32.Zhang J., Litvinova M., Liang Y., Wang Y., Wang W., Zhao S., Wu Q., Merler S., Viboud C., Vespignani A., et al. Changes in contact patterns shape the dynamics of the COVID-19 outbreak in China. Science. 2020;368:1481–1486. doi: 10.1126/science.abb8001. [DOI] [PMC free article] [PubMed] [Google Scholar]
- 33.Cevik M., Bamford C.G.G., Ho A. COVID-19 pandemic-a focused review for clinicians. Clin. Microbiol. Infect. 2020;26:842–847. doi: 10.1016/j.cmi.2020.04.023. [DOI] [PMC free article] [PubMed] [Google Scholar]
- 34.Hildenwall H., Luthander J., Rhedin S., Hertting O., Olsson-Åkefeldt S., Melén E., Alfvén T., Herlenius E., Ryd Rinder M. Paediatric COVID-19 admissions in a region with open schools during the two first months of the pandemic. Acta Paediatr. 2020 doi: 10.1111/apa.15432. Published online June 21, 2020. [DOI] [PMC free article] [PubMed] [Google Scholar]
- 35.Liu L., Wang P., Nair M.S., Yu J., Rapp M., Wang Q., Luo Y., Chan J.F., Sahi V., Figueroa A., et al. Potent neutralizing antibodies against multiple epitopes on SARS-CoV-2 spike. Nature. 2020;584:450–456. doi: 10.1038/s41586-020-2571-7. [DOI] [PubMed] [Google Scholar]
- 36.Ziegler A.G., Danne T., Dunger D.B., Berner R., Puff R., Kiess W., Agiostratidou G., Todd J.A., Bonifacio E. Primary prevention of beta-cell autoimmunity and type 1 diabetes - The Global Platform for the Prevention of Autoimmune Diabetes (GPPAD) perspectives. Mol. Metab. 2016;5:255–262. doi: 10.1016/j.molmet.2016.02.003. [DOI] [PMC free article] [PubMed] [Google Scholar]
- 37.Burbelo P.D., Ching K.H., Klimavicz C.M., Iadarola M.J. Antibody profiling by Luciferase Immunoprecipitation Systems (LIPS) J. Vis. Exp. 2009;32:1549. doi: 10.3791/1549. [DOI] [PMC free article] [PubMed] [Google Scholar]
- 38.Burbelo P.D., Lebovitz E.E., Notkins A.L. Luciferase immunoprecipitation systems for measuring antibodies in autoimmune and infectious diseases. Transl. Res. 2015;165:325–335. doi: 10.1016/j.trsl.2014.08.006. [DOI] [PMC free article] [PubMed] [Google Scholar]
- 39.Ashton M.P., Eugster A., Walther D., Daehling N., Riethausen S., Kuehn D., Klingel K., Beyerlein A., Zillmer S., Ziegler A.G., Bonifacio E. Incomplete immune response to coxsackie B viruses associates with early autoimmunity against insulin. Sci. Rep. 2016;6:32899. doi: 10.1038/srep32899. [DOI] [PMC free article] [PubMed] [Google Scholar]
- 40.Liberati D., Wyatt R.C., Brigatti C., Marzinotto I., Ferrari M., Bazzigaluppi E., Bosi E., Gillard B.T., Gillespie K.M., Gorus F., et al. A novel LIPS assay for insulin autoantibodies. Acta Diabetol. 2018;55:263–270. doi: 10.1007/s00592-017-1082-y. [DOI] [PubMed] [Google Scholar]
Associated Data
This section collects any data citations, data availability statements, or supplementary materials included in this article.
Supplementary Materials
Data Availability Statement
All reasonable requests for raw and analyzed data and materials will be promptly reviewed by the corresponding author to determine whether the request is subject to confidentiality obligations. Any data that can be shared will be made available from the corresponding author on reasonable request, with appropriate additional ethical approvals, and released via a material transfer agreement.