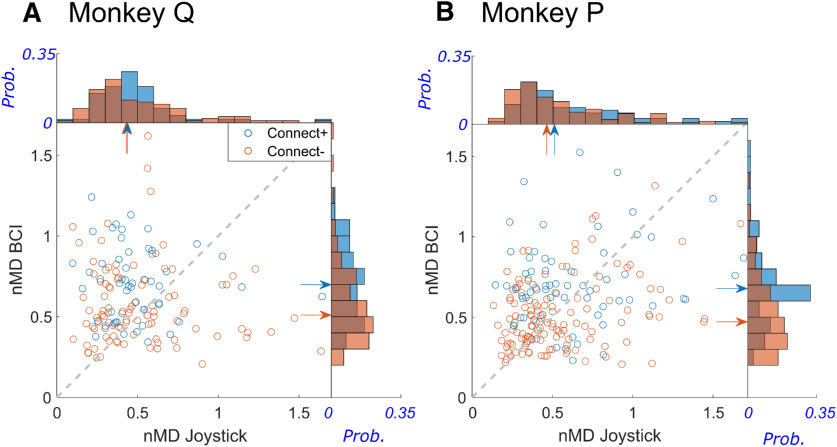
Figure 10.
nMDs of Connect+ units and Connect– units compared during joystick versus BCI trials. A, Monkey Q. B, Monkey P. Scatter plots show that the nMDs of Connect+ units (blue circles) were higher during BCI trials, as the majority of blue circles fall above the dashed line of unity slope. The same was not true for Connect– units (orange circles). Marginal histograms show the probability distributions of Connect+ nMDs (blue) and Connect– nMDs (orange) during BCI trials (right) which were significantly different, and during joystick trials (top) which were not. Blue and orange arrows represent the medians for Connect+ and Connect– unit populations, respectively. In these scatterplots, outliers with nMD > 1.7 have been excluded for purposes of display; including the outliers did not change the results.

