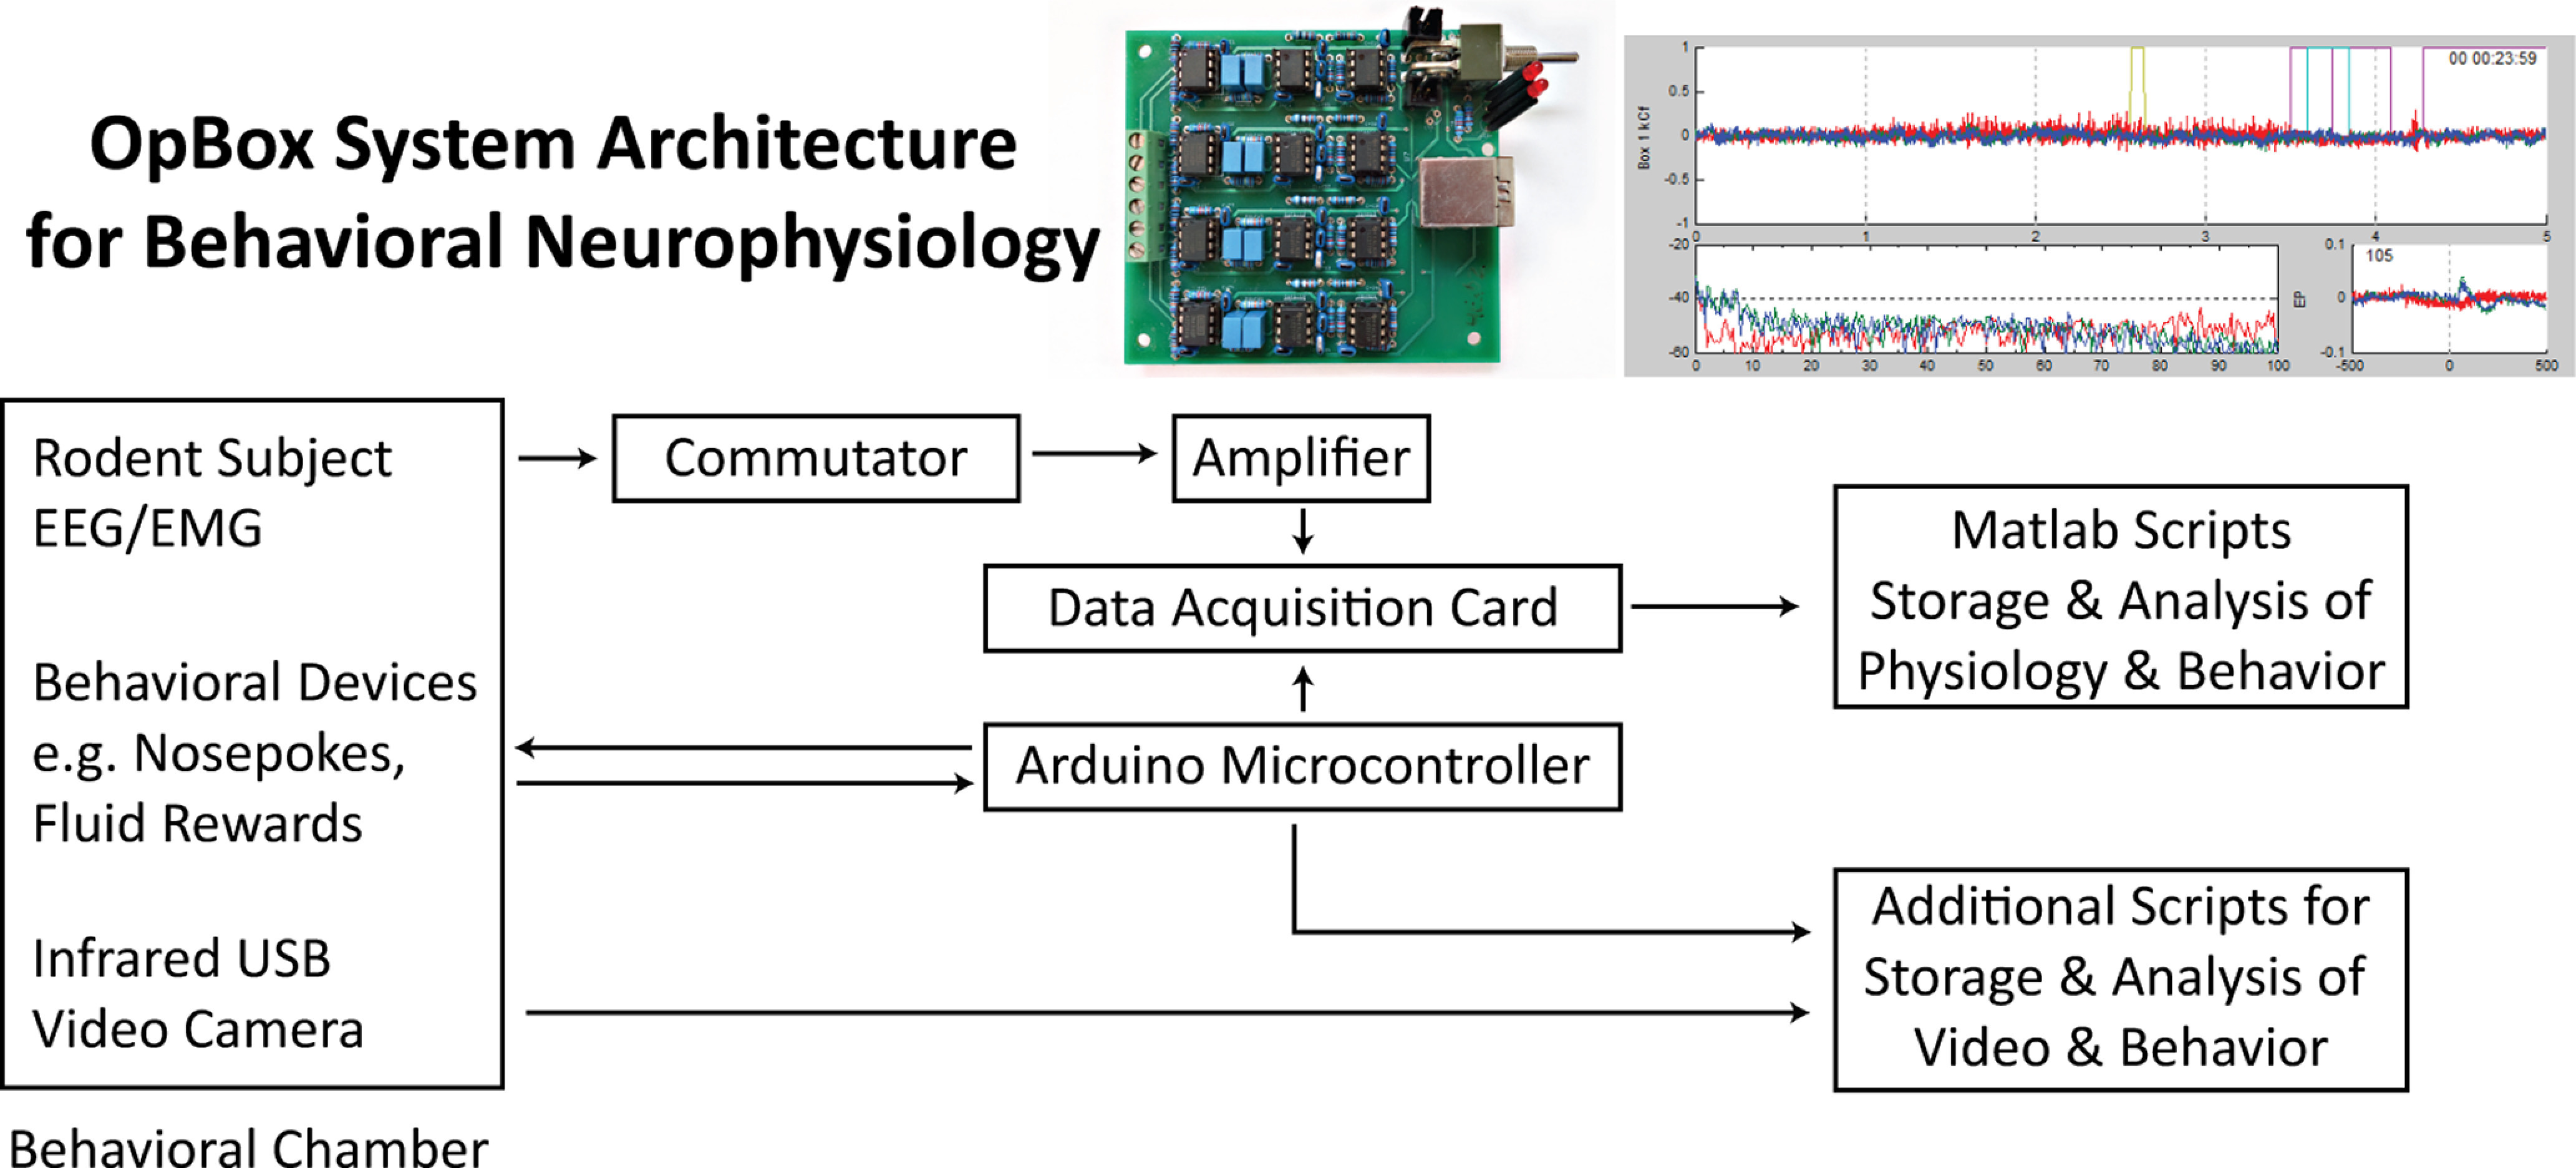
Figure 1.

Overall architecture of the OpBox system. On the leftmost are the subjects and devices that may be placed within a behavioral chamber. Arrows in the top part of the figure indicate the flow of electrophysiology (EEG and EMG) data to the amplifier, data acquisition card, and software scripts. Additional arrows indicate the ability to add behavioral and video modules as well. Pictures of modules described in this paper in detail (OpBox amplifier and MATLAB GUI) are shown above their respective nodes.
