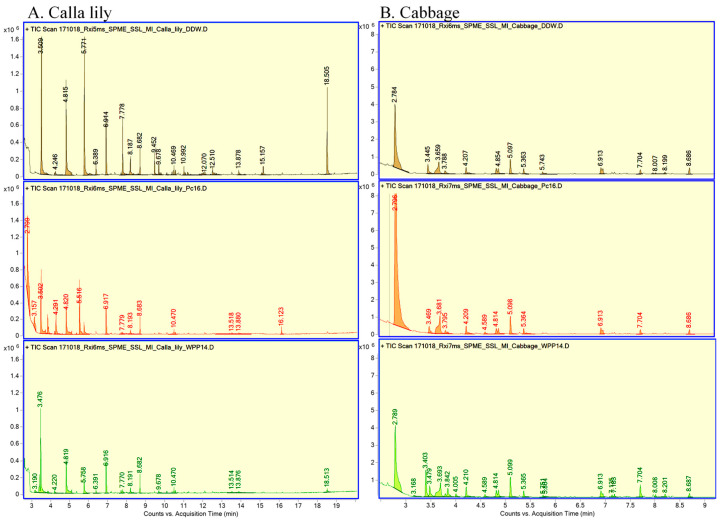
Figure 3.
Chromatograms of volatile organic compounds (VOCs) produced by leaf samples, (A) calla lily and (B) cabbage samples (double-distilled water (DDW)-black, Pc16- red, WPP14-green), following infiltration with bacteria, and incubation in airtight jars at 28 °C for 24 h, and adsorption onto a SPME fiber. The adsorbed compounds were analyzed using Agilent GC 7890A and 5975C MSD, and mass spectra were acquired in positive electron-impact (EI) scan mode (m/z 20–350). Identification of the VOCs was performed by comparing their mass spectra and retention times with the NIST/EPA/NIH Mass Spectral Database (NIST 05, National Institute of Standards and Technology, Gaithersburg, MD, USA; see Table 2 and Table 3). Representative chromatograms from two independent experiments are presented.

