Figure 5.
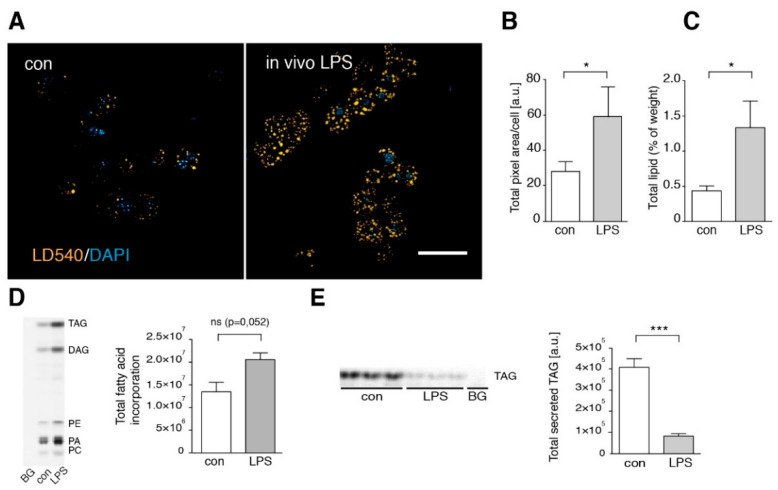
In vivo LPS treatment leads to hepatic steatosis. (A) Hepatocytes were isolated from in vivo LPS-treated (LPS) or untreated (control) mice. Cells were stained with LD540 and DAPI to visualize lipid droplet (LD). Scale bar: 50 µM. (B) Quantification of the total fluorescent LD area per cell (n = 3). (C) Averaged total lipids (weight %) in livers of control (con) and LPS-treated animals (LPS) (n ≥ 4). (D) To determine fatty acid incorporation, hepatocytes were incubated with alkyne fatty acids for 10 min. Lipids were extracted and labeled lipids analyzed as described in Experimental Procedures. Left: image of a representative TLC plate. Right: quantification of total fluorescent lipids/lane (n = 3). (E) For determination of VLDL secretion, chase medium was collected after 2 min alkyne fatty acid pulse and 120 min chase time, analyzed as above, and the amount of VLDL was determined from the TAG signal. Left: Image of the TLC plate, right: quantification of total secreted TAG (n = 3). Data are visualized as mean values with SEM. Significance was analyzed with a two-tailed Student’s t-test. Statistical significance is indicated as follows: ns, not significant, * p < 0.05, *** p < 0.001.

