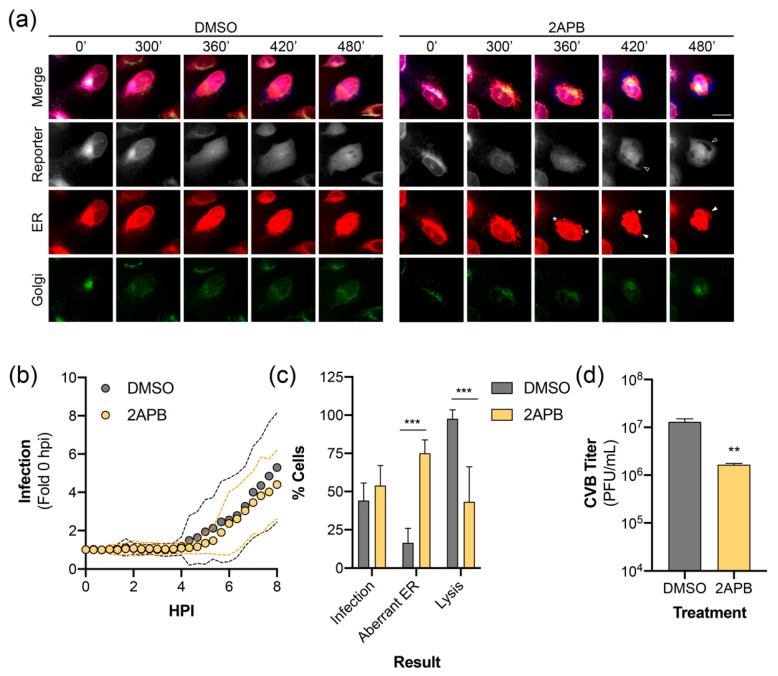
Figure 5.
ER calcium channel inhibition alters CVB-induced ER remodeling. (a) Representative time points of an image series from live-cell imaging of mEmerald (Golgi, green), BFP (reporter, gray), mCherry (ER, red), and merged panels from U2OS cells expressing RepOr treated with DMSO or 2APB (100 μM) with CVB. Aberrant ER structures are indicated as protein aggregates (*), inflated ER (white arrowhead in ER panels), which exclude cytoplasmic BFP (empty arrowheads in reporter panels). Scale bars are 20 μm. (b) CVB infection kinetics of individual U2OS cells expressing RepOr treated with DMSO (n = 24) or 2APB (100 μM, n = 24). Data is shown as the average (dots) ± SD (dashed lines) infection signal every 20 min from 0 to 8 hpi, presented as fold change compared to 0 hpi. (c) Phenotypes of cells from live-cell imaging of DMSO or 2APB (100 μM) treated U2OS cells expressing RepOr infected with CVB. Data is shown as the percentage of cells showing nuclear translocation of the reporter at 8 hpi (Infection), percentage of cells showing infection containing aberrant ER structures (Aberrant ER), or the percentage of cells showing reporter translocation at 8 hpi that resulted in lysis by 16 hpi (Lysis), as determined by loss of reporter signal upon loss of membrane integrity (as described in Materials and Methods 2.8.5). The data was collected from two independent experiments, with four separate fields/experiment. Significance was determined by one-way ANOVA, *** p < 0.0005. (d) Titer of extracellular virus from CVB infected U2OS cells treated with DMSO or 2APB (100 μM) at 10 hpi. The data is shown as the average ± SD titer (PFU/mL) from three independent experiments. Significance was determined by student’s t-test, ** p < 0.005.

