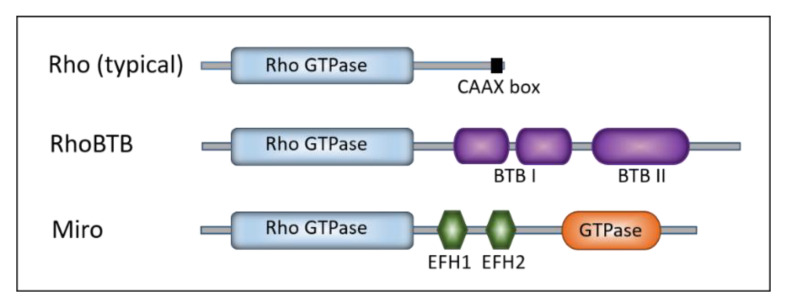
Figure 1.
Schematic representation of Rho GTPases. Colored boxes represent characteristic structures: the Rho GTPase domain (light blue), CAAX box (black), BTB (broad complex/tramtrack/bric-a-brac) domain I and II (violet), EFH (EF-hand calcium binding) domain 1 and 2 (green), and the second GTPase domain in Miro (orange).

