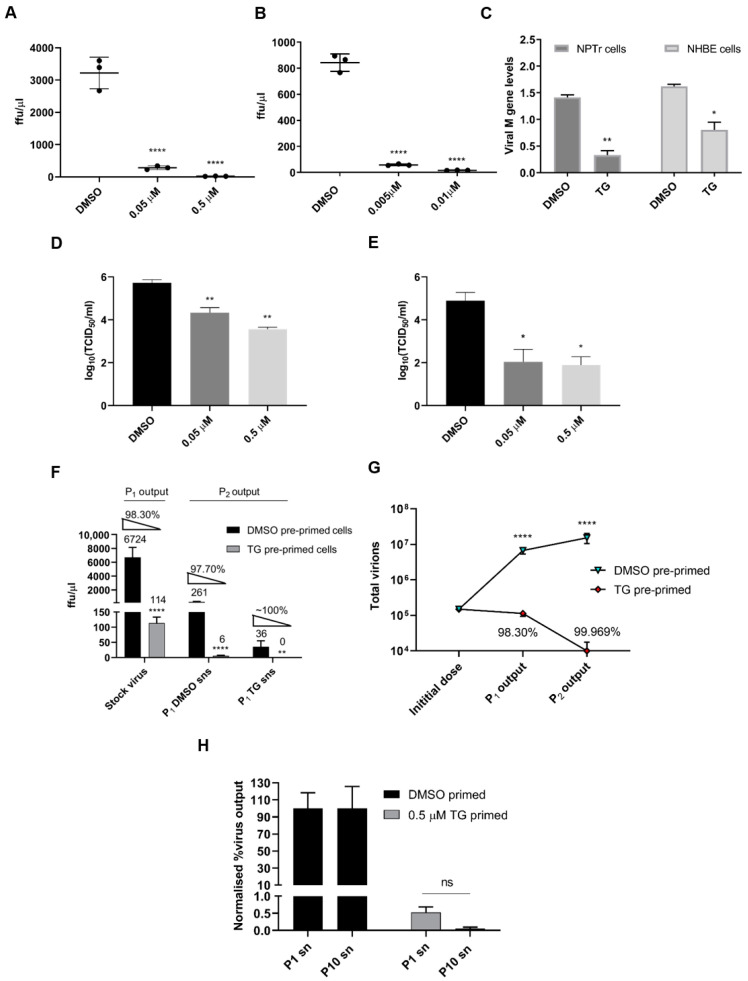
Figure 1.
Brief TG priming of NPTr and NHBE cells blocks progeny influenza virus production. (A) NPTr cells and (B) NHBE cells were incubated for 30 min with TG or DMSO control at the indicated concentrations, PBS washed and infected for 12 and 24 h, respectively, with USSR H1N1 virus at 0.5 MOI. Spun supernatants (sns) were used to infect MDCK cells for 6 h in FFAs. Significance determined by one-way ANOVA, relative to DMSO control. (C) NPTr cells and NHBE cells were primed with TG (0.5 and 0.01 µM, respectively) or DMSO for 30 min, and infected with USSR H1N1 virus (0.5 and 1.0 MOI, respectively) for 24 h. Culture media were then harvested to determine presence of viral M-gene RNA. Significance determined by paired t-test. (D,E) MDCK cells were incubated for 30 min with TG or DMSO control at the indicated concentrations, PBS washed and infected for 24 h with (D) equine H3N8 and (E) canine H3N8 virus. TCID50 assay was performed to quantify virus output. Significance determined by one-way ANOVA, relative to DMSO control. (F) P1 sns were derived from 0.5 µM TG or DMSO pre-primed (for 30 min) NPTr cells infected with stock virus (USSR H1N1 at 0.5 MOI) for 23 h. Fresh NPTr cells (P2) pre-primed with respective TG or DMSO were infected with corresponding P1 sns for 23 h. Volume of P1 supernatants used was the same as the starting stock virus volume. Significance based on mixed model analysis was relative to corresponding DMSO pre-primed cells. (G) Total progeny virus yield from initial virus infection on P1 cells, pre-primed with DMSO or TG, followed by sequential infection with P1 supernatants on P2 cells correspondingly pre-primed with DMSO or TG. Significance based on mixed effect analysis was relative to corresponding DMSO pre-primed cells. Log (total virus yield) displayed. Each % refers to reduction in virus output relative to initial virus dose from TG priming. (H) At passage 1 (P1), cells were infected with 20 HA units of USSR H1N1 virus for 2 h, PBS washed and cultured for 3 days in the continuous presence of 0.05 µM TG or DMSO control in serum-free OptiMEM media, supplemented with TPCK trypsin at 0.2 µg/mL. Spun P1 sns were used for the next passage; a total of 10 serial passages were completed. P1 and P10 sns were subsequently used in duplicates to separately infect for 2 h NPTr cells, pre-infection primed for 30 min with 0.5 µM TG or DMSO, washed with PBS and cultured in OptiMEM for a further 22 h, after which harvested sns were used in 6 h FFAs on MDCK cells to determine progeny virus output expressed in percentage where corresponding DMSO control output was set at 100%. Two-way ANOVA, Sidak’s multiple comparisons test, showed no significance (ns) in virus inhibition between P1 and P10 TG-derived sns. Significance determined by Mann Whitney test, relative to corresponding DMSO control. * p <0.05, ** p <0.01, **** p <0.0001. All assays were in triplicates and were performed three times.

