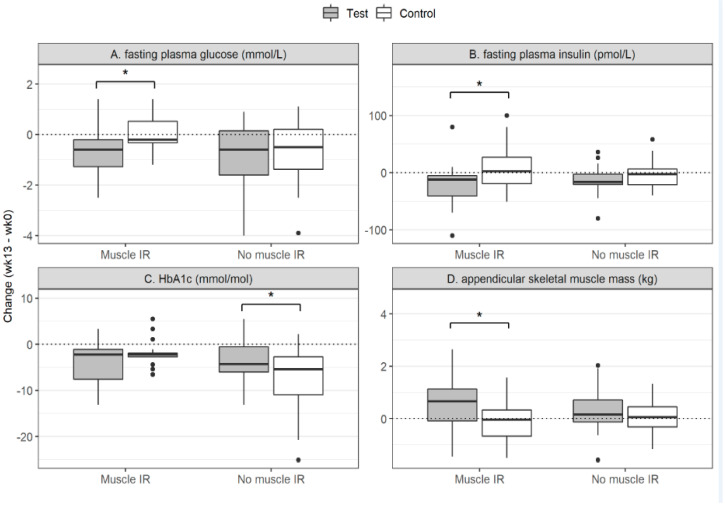
Figure 1.
The changes in glycemic and physiological variables due to the intervention. HbA1c: glycated hemoglobin A1c; IR: insulin resistance; MIR: muscle insulin resistance. The changes in the fasting plasma glucose (A), fasting plasma insulin (B), HbA1c (C) and in appendicular skeletal muscle mass (D) are presented for the MIR group (left) and the no-MIR group (right) in each plot. The filled boxed (grey) represent the group supplemented with the protein drink; the non-filled boxed (white) represent the group provided with the control drink. Statistics was done within the MIR and no-MIR group and not between the groups. The groups are shown in the same plot for comparison. The box plots show quartile 1-quartile 3 of the data with the line representing the median. * p < 0.05.

