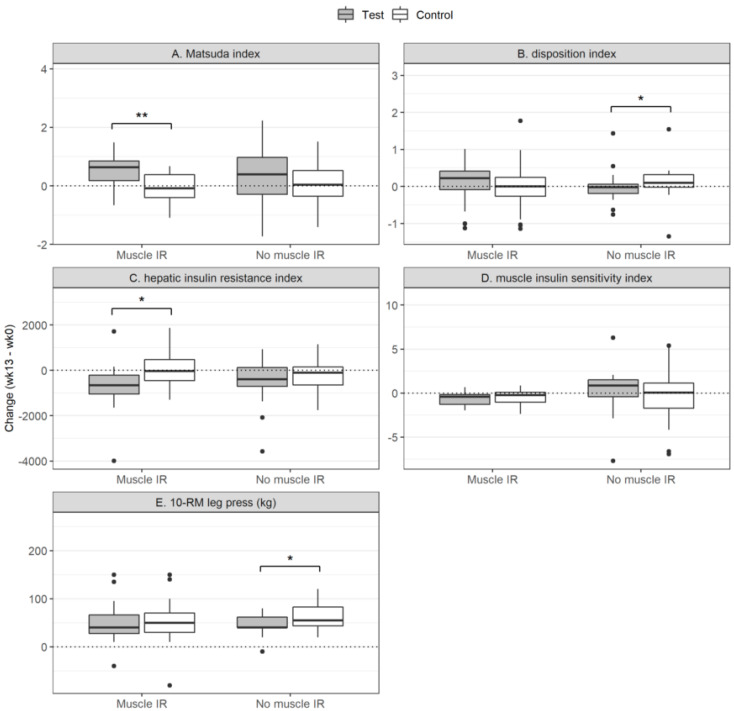
Figure 2.
Insulin resistance indices and the 10-Repetition Max (10-RM) test. The changes in the Matsuda index (A), the Disposition Index (B), the Hepatic Insulin Resistance Index (C), the Muscle Insulin Sensitivity Index (D) and the 10-RM leg press (E) are presented for the MIR group (left) and the no-MIR group (right) in each plot. The filled boxed (grey) represent the group supplemented with the protein drink; the non-filled boxed (white) represent the group provided with the control drink. Statistics was done within the MIR and no-MIR group and not between the groups. The groups are shown in the same plot for comparison. The box plots show quartile 1-quartile 3 of the data with the line representing the median. * p < 0.05; ** p < 0.01.

