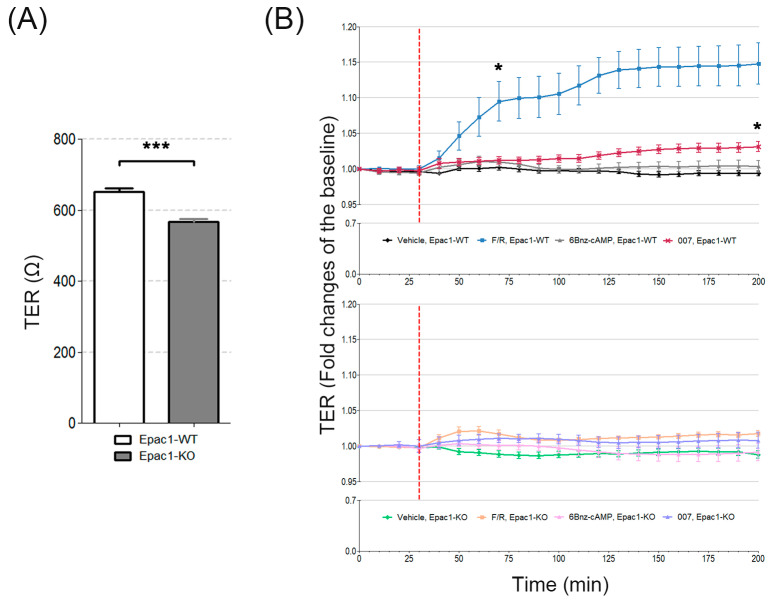
Figure 1.
TER from MyEnd monolayers under basal and after the cAMP stimulated conditions. (A) Bar diagram representing the average basal transendothelial resistance monitored by ECIS in both WT and Epac1-KO cell lines. Data were collected 200 min after the measurement was initiated. (B) Barrier function, over time, from the control and treated (as indicated) WT and Epac1-KO cell monolayers assessed by TER. The segmented red line denotes the time of mediator application. Left asterisk indicates statistically significant difference between F/R stimulated WT cells and the corresponding Vehicle controls. Right asterisk denotes differences between 007 treated WT cells and the respective control monolayers. N = 4–5; n ≥ 8; * p ≤ 0.05, *** p ≤ 0.001.

