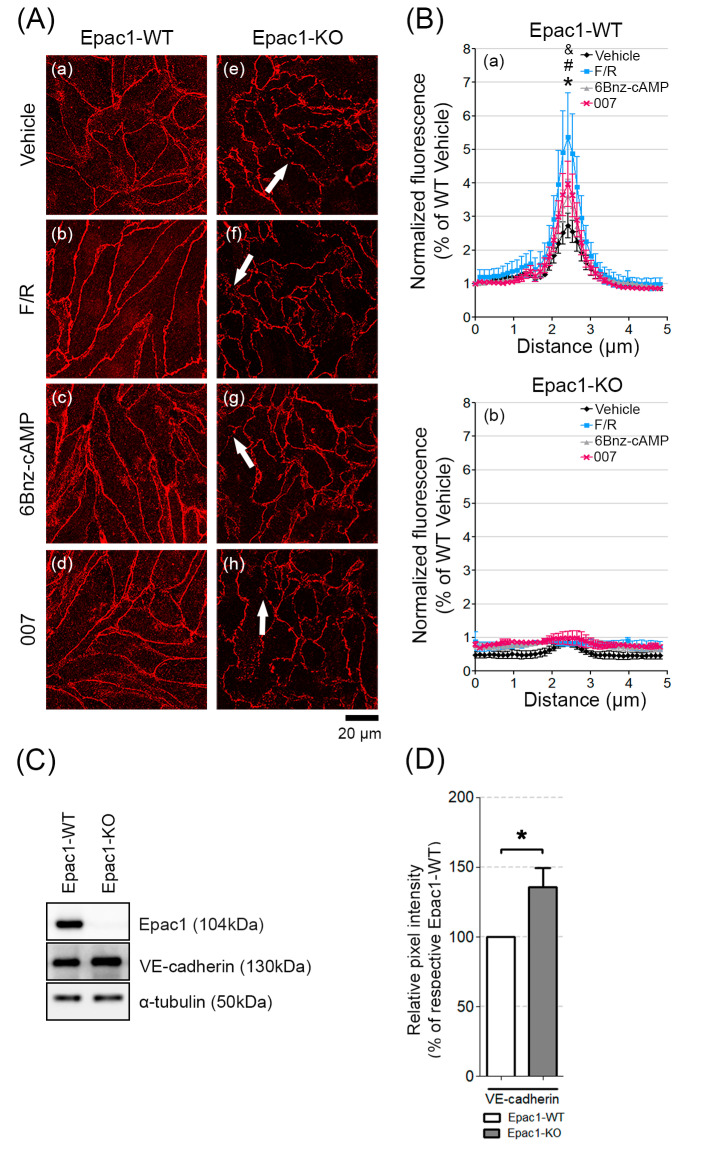
Figure 2.
Distribution and basal protein levels of VE-cadherin in confluent MyEnd cell sheets. (A) Confluent MyEnd cell monolayers originating from WT (a–d) and Epac1-KO (e–h) mice were treated either with vehicle (DMSO) or with F/R (1 h), 007 (2 h), or 6-Bnz-cAMP (6 h). Arrows indicate VE-cadherin fragmentation among the neighbouring cells. (B) Bell-shaped curve representing the distribution of VE-cadherin signal intensity across cell borders. Normalized data collected from WT and Epac1-KO cell lines are presented. N = 4, n = 25; “*” denotes statistical significance for vehicle vs. F/R in WT cell monolayers; “#” for F/R vs. 6Bnz-cAMP; “&” for F/R vs. 007; p ≤ 0.05. (C) Western blot analysis of whole cell lysates for Epac1 and VE-cadherin. Equal loading validation was monitored with α-tubulin; N ≥ 10. (D) Respective densitometric measurements of the band intensity; N ≥ 10. Full-length blots can be found in the Supplementary Figure S3. Data are presented as mean ± SEM.

