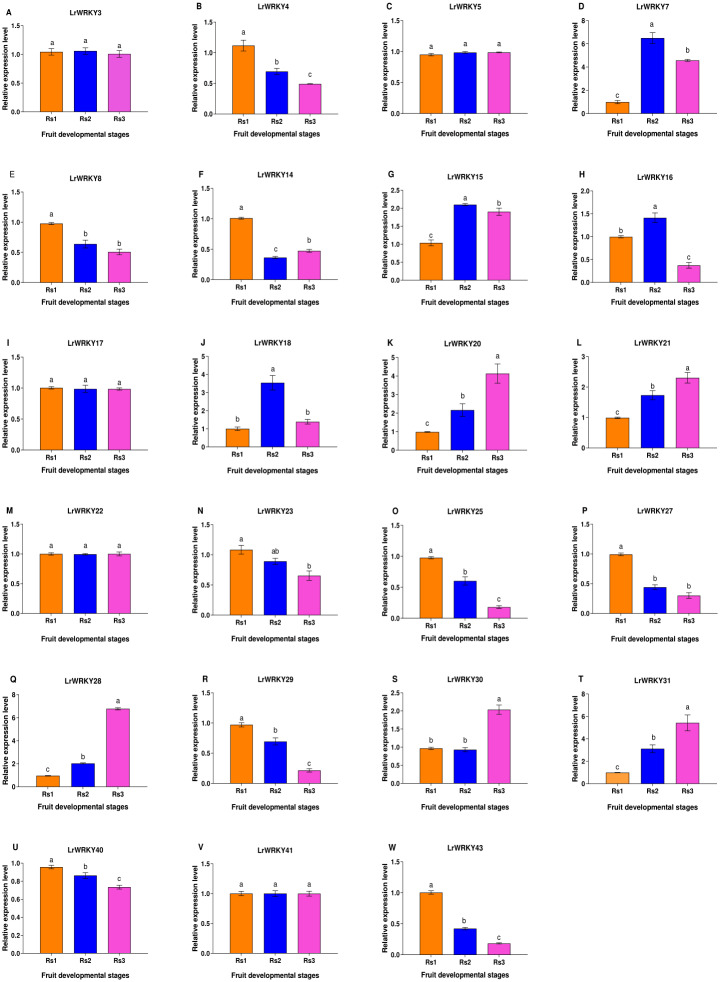
Figure 5. RT-qPCR validation of twenty-three selected LrWRKYs expression levels during fruit developmental stages.
The Rs1 represent green ripeness stage, Rs2 represent veraison ripeness stage, and Rs3 represent complete ripeness stage. The name of the gene is written on top of each bar diagram; (A) LrWRKY3, (B) LrWRKY4, (C) LrWRKY5, (D) LrWRKY7, (E) LrWRKY8, (F) LrWRKY14, (G) LrWRKY15, (H) LrWRKY16, (I) LrWRKY17, (J) LrWRKY18, (K) LrWRKY20, (L) LrWRKY21, (M) LrWRKY22, (N) LrWRKY23, (O) LrWRKY25, (P) LrWRKY27, (Q) LrWRKY28, (R) LrWRKY29, (S) LrWRKY30, (T) LrWRKY31, (U) LrWRKY40, (V) LrWRKY41, (W) LrWRKY43. The different letters indicate significant differences among developmental stages (p < 0.05).

