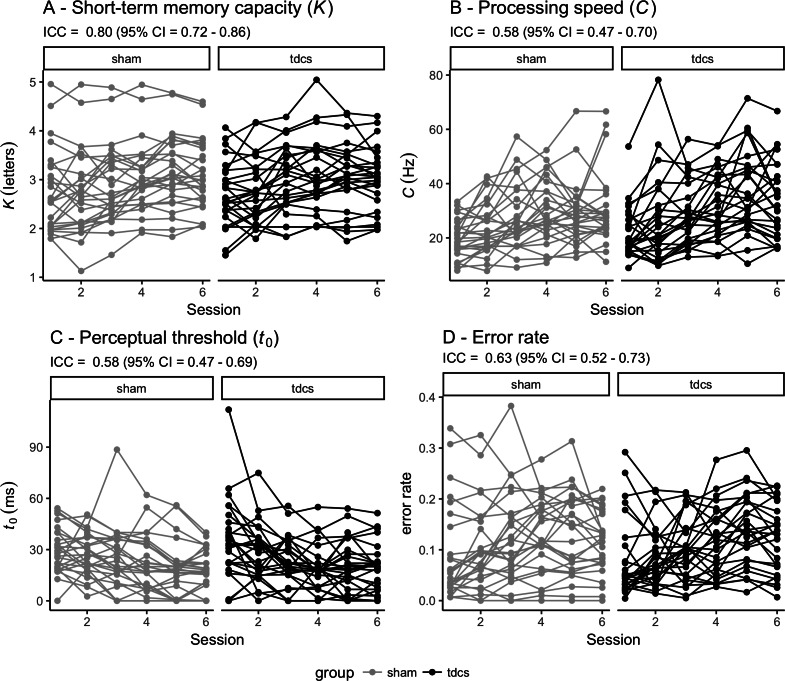
Figure 3. Individual performance for each of the TVA parameters across the six timepoints for each group (sham vs tDCS).
Reliability of each TVA parameter is indicated by the intra-class coefficient (ICC) with 95% confidence interval (CI). TVA: Theory of visual attention. tDCS: transcranial direct current stimulation. (A) Short-term memory capacity (K). (B) Perceptual processing speed (C). (C) Perceptual threshold (t0). (D) Error rate.

