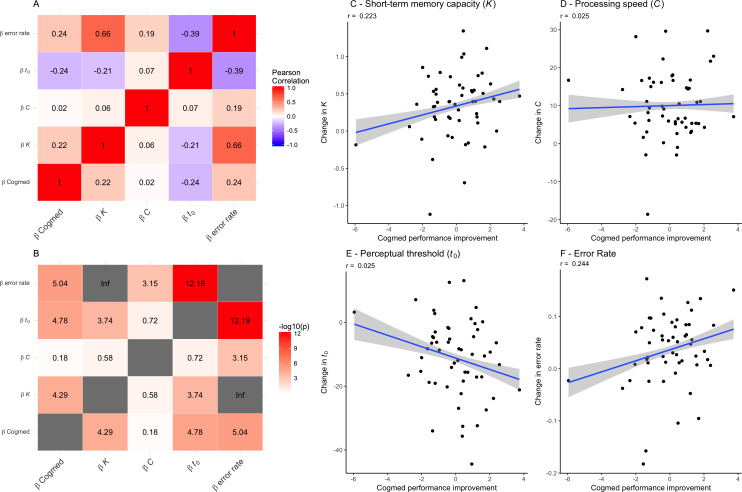
Figure 4. Associations between each of the TVA parameter improvement scores (beta estimates) and the Cogmed factor scores for each individuals (on the right).
(A) Correlations between performance improvement over the course of the CCT (Cogmed factor scores) and the change in TVA parameters across the six sessions (beta estimates). (B) The −log10 (p-value) matrix of the correlations between performance improvement over the course of the CCT (Cogmed factor scores) and the change in TVA parameters across the six sessions (beta estimates). (C) Associations between change in short-term memory capacity (K) (beta estimates) and the Cogmed factor score. (D) Associations between change in processing speed (C) (beta estimates) and the Cogmed factor scores. (E) Associations between change in perceptual threshold (t0) (beta estimates) and the Cogmed factor scores. (F) Associations between change in error rate (beta estimates) and the Cogmed factor scores.

