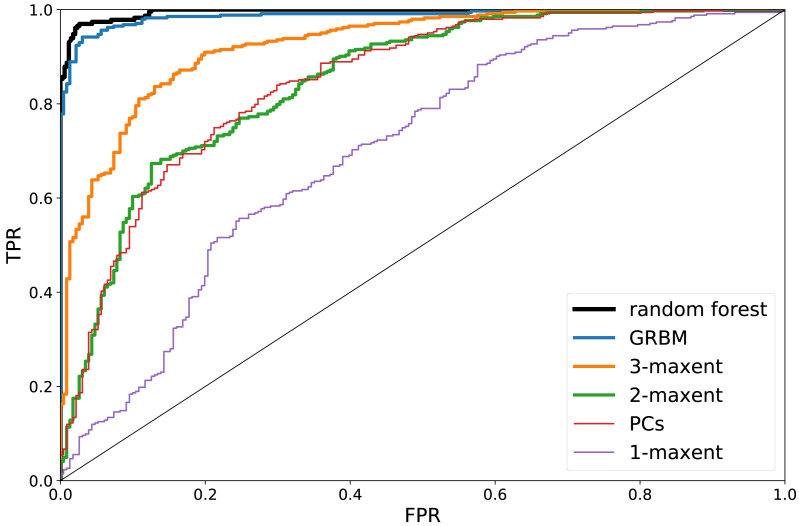
Figure 3.
True Positive Rate (TPR) versus False Positive Rate (FPR) corresponding to the Receiver Operating Characteristic (ROC) curves associated to the gender classification. Different ROC curves correspond to different algorithms. PC’s refers to a t-Student test of the difference in the principal components of a vector with respect to their average value in the A, B sets.

