Abstract
Purpose
To identify MRI-based radiomics signature (Rad-score) as a biomarker of risk stratification for disease-free survival (DFS) in patients with HER2-positive invasive breast cancer treated with trastuzumab-based neoadjuvant chemotherapy (NAC) and establish a radiomics-clinicoradiologic-based nomogram that combines Rad-score, MRI findings, and clinicopathological variables for DFS estimation.
Patients and Methods
A total of 127 patients were divided into a training set and testing set according to the ratio of 7:3. Radiomic features were extracted from multiphase CE-MRI (CEm). Rad-score was calculated using the LASSO (least absolute shrinkage and selection operator) regression analysis. The cutoff point of Rad-score to divide the patients into high- and low-risk groups was determined by receiver operating characteristic curve analysis. A Kaplan–Meier survival curves and the Log rank test were used to investigate the association of the Rad-score with DFS. Univariate and multivariate Cox proportional hazards model were used to determine the association of Rad-score, MRI features, and clinicopathological variables with DFS. A radiomics-clinicoradiologic-based nomogram combining the Rad-score, MRI features, and clinicopathological findings was plotted to validate the radiomic signatures for DFS estimation.
Results
The Rad-score stratified patients into high- and low-risk groups for DFS in the training set (P<0.0001) and was validated in the testing set (P=0.002). The radiomics-clinicoradiologic-based nomogram estimated DFS (training set: C-index=0.974, 95% confidence interval (CI)=0.954–0.994; testing set: C-index=0.917, 95% CI=0.842–0.991) better than the clinicoradiologic-based nomogram (training set: C-index=0.855, 95% CI=0.739–0.971; testing set: C-index=0.831, 95% CI=0.643–0.999).
Conclusion
The Rad-score is an independent biomarker for the estimation of DFS in invasive HER2-positive breast cancer with NAC and the radiomics-clinicoradiologic-based nomogram improved individualized DFS estimation.
Keywords: radiomics, breast cancer, prognosis, magnetic resonance imaging
Introduction
HER2-positive breast cancer (HER2-positive and hormone receptor negative) usually has higher histological grade, more recurrence, and poor prognosis.1,2 However, the pathological complete response (pCR) to trastuzumab-based NAC of HER2-positive breast cancer has achieved an outstanding effect. Although the pCR rate was able to assess the sensitivity of the tumor to NAC in a short period of time, it is not a substitute for long-term survival. To achieve personalized prognostication, an efficient prognostic biomarker is urgently needed for risk stratification in patients with HER2-positive breast cancer.
Breast magnetic resonance imaging (MRI) was confirmed as the most reliable imaging tool for providing insights related to tumor detection, subtype classification, assessment of treatment response and survival analysis.3–6 While clinical MRI images depend on naked eyes, radiomics can translate medical images into high-dimensional data which reflect not only macroscopic but also the cellular and molecular properties of tissues.7,8 The purpose of radiomics analysis is to generate image-driven biomarkers which can provide a deeper understanding of the microenvironment and spatial heterogeneity in tumors noninvasively.9,10
Some studies involving survival analysis of tumors had reported that radiomic features can be used as a biomarker for risk stratification.11–14 However, studies evaluating Rad-score for DFS prediction in HRE2 positive breast cancer treated with NAC are scarce. In addition, previous studies demonstrated the feasibility and potential benefits of radiomics in survival analysis only using the first phase of CE-MRI, which only reflects the spatial heterogeneity of the tumor. Nevertheless, radiomic features derived from multiphases of contrast enhanced MRI images can imply more information changing over time points.15
In the present study, we utilized all phases of CE-MRI images calculating new sequential texture features changing over time points. The aim of our study was to identify MRI-based Rad-score as a biomarker of risk stratification for DFS and compare the radiomics-clinicoradiologic-based model and the clinicoradiologic-based model for their abilities in predicting DFS in patients with locally advanced HER2-positive breast cancer treated with NAC.
Patients and Methods
Patient Population
This retrospective study was approved by the medical ethics committee of Fudan university cancer center, which waived informed consent. In total, 127 female patients who underwent conserving breast surgery or radical mastectomy between January 2012 and December 2018 were consecutively enrolled in the study.
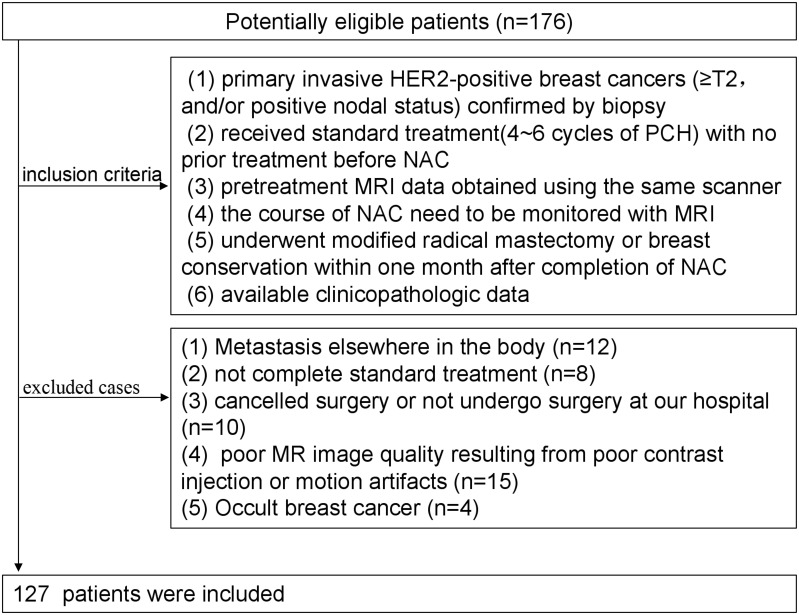
Inclusion criteria were as follows: 1) patients had primary invasive HER2-positive breast cancers (≥T2, and/or positive nodal status) confirmed by biopsy; 2) patients received complete standard treatment (4~6 cycles of PCH) with no prior treatment before NAC; 3) pretreatment MRI data obtained using the same scanner (1.5-T, Aurora Dedicated Breast MRI System; USA); 4) the course of NAC need to be monitored with MRI; 5) underwent modified radical mastectomy or breast conservation within 1 month after completion of NAC; 6) available clinicopathologic data (age, menopausal status, tumor size, Ki-67 index, MRI-reported T stage, N stage, surgery type, FGT(fibroglandular tissue), BPE(background parenchymal enhancement), numbers of lesion, enhancement pattern). Exclusion criteria were as follows: 1) Metastasis elsewhere in the body; 2) not complete standard treatment; 3) cancelled surgery or did not undergo surgery at our hospital; 4) poor MR image quality resulting from poor contrast injection or motion artifacts; (5) Occult breast cancer. Finally, 127 patients were enrolled in the study (Figure 1). We have complied with the World Medical Association Declaration of Helsinki regarding the ethical conduct of research involving human subjects. Written informed consents were waived due to the study design. The medical ethics committee of Fudan university cancer hospital approved this retrospective study and confirmed that the data was anonymized and maintained with confidentiality.
Figure 1.
Flow chart of patient recruitment.
Treatment regimen: All patients received 4~6 cycles of PCH regimen (paclitaxel+carboplatin+trastuzumab; paclitaxel: 80 mg/m2, carboplatin: AUC=2, herceptin was initially measured at 4 mg/kg and maintained at 2 mg/kg; Once a week, 3-times is a cycle of treatment) and then underwent radical mastectomy or breast conservation.
Magnetic Resonance Imaging and Imaging Analysis
For all patients, axial breast CE-MR were performed before NAT on a 1.5-T MR scan (Aurora Dedicated Breast MRI System; USA) using a breast unique transmit/receive coil in the prone position. The CE-MRI protocol included: a) T1-weighted fat-saturated precontrast sequence, b) multiple (3 phases) T1-weighted fat-saturated postcontrast sequences that were acquired after intravenous administration of a 0.1 mmol/kg dose of Gd-DTPA (Magnevist; Bayer-Schering Pharma, Berlin, Germany). Scan parameters were TR/TE=29.0/4.8 ms; FOV=36 cm×36 cm; matrix=360×360; 108 slices; slice thickness=1.5 mm. The number of single-phase scanning layers was 108.
MRI and Clinicopathological Evaluations
According to the American College of Radiology Breast Imaging Reporting and Data System (BI-RADS) MR lexicon, the MR images of all cases were retrospectively evaluated by two radiologists (QL and QX, with 8 and 15 years of experience in breast MRI, respectively) in consensus.
The histopathological results of core needle biopsies and surgical specimens were reviewed by immunochemistry (IHC), including quantitative assays for estrogen receptor (ER), progesterone receptor (PR), human epidermal growth factor receptor 2 (HER2), and Ki-67 expression status. HER2-positive were defined as ER negative, PR negative, and HER2 positive.16 The ER and PR status were assessed as positive only when at least 1% of tumor cells showed nuclear staining, respectively10. Tumors with HER2 scores of 3+ based on IHC studies were considered positive. In the cases of 2+ scores, HER2 gene amplification was determined by fluorescent in situ hybridization (FISH).
Pathological response was determined by pathologist. pCR was defined as surgical specimens having no invasive tumor cells in the breast and axillary lymph nodes (ypT0/is+ypN0).
The survival endpoint of this study was disease-free survival (DFS). DFS was the time from surgery to events, including tumor recurrence in ipsilateral breast, the diagnosis of a second primary cancer, or death from any reason. In the analysis, patients having no recurrence at the last follow-up or lost to follow-up were recorded as censored.
Tumor Masking and Inter-Observer Reproducibility Evaluation
When drawing the outline of the tumor, we obey the following principles. First, regardless of whether the lesion presented mass or non-mass enhancement, tumor regions of interest (ROI) were drawn manually on each slice along the contour of the tumor on the first postcontrast CE-MRI scan (the peak enhanced phase of the multiphase CE-MRI where the border of the lesion was the most obvious) to get the 3D segmentation of the whole tumor. Second, if the tumor is a unilateral multifocal lesion, the largest one will be selected as the object. And then the 3D ROI contour based on the first postcontrast phase were propagated to the pre-contrast and the other two postcontrast phases of CE images. The contour line of the whole tumor was performed on the 3D-Slicer software (version 4.10.2, https://www.slicer.org).
Inter-observer reproducibility of ROI detection and radiomic feature extraction were measured using 30 randomly chosen samples. Two experienced radiologists (QL and QX) performed the ROI delineation independently, and then radiomic features extracted from the above two ROIs were compared to get the inter-class correlation coefficient. An ICC score greater than 0.8 was interpreted to reach satisfactory agreement. ICC for radiomic features was defined as high (ICC≥0.8), medium (0.8>ICC≥0.5), or low (ICC<0.5).
Feature Extraction and Selection
Radiomic features were calculated with PyRadiomics package in the Python software (v. 3.7, Python Software Foundation, https://www.python.org/). In total, three groups of imaging features (Supplementary material 1) for each patient were extracted from normalized pretreatment CE-MRI scans: Group 1 (CEshape) consisted of 14 shape-based features derived from the first postcontrast CE-MRI images; Group 2 (CEtexture) comprised 93 texture features based on each phase CE-MRI independently, yielding 372 features; Group 3 (CEsequential) was comprised of 930 sequential features, which were calculated from 93 texture features to characterize the textural changes over time points. In group 3, 10 new sequential features from each texture feature were calculated (Algorithms for the 10 new sequential features are shown in Supplementary material 2). Six (mean, variance, kurtosis, skewness, energy, and entropy) out of the above 10 sequential features were extracted from each individual subject, and the other four (including Kendall-tau-b, conservation, stability, and dispersion) of the 10 ones were calculated from the interactive information between one subject and the remainder of the subjects. All these features have been applied in previous radiomic studies.15
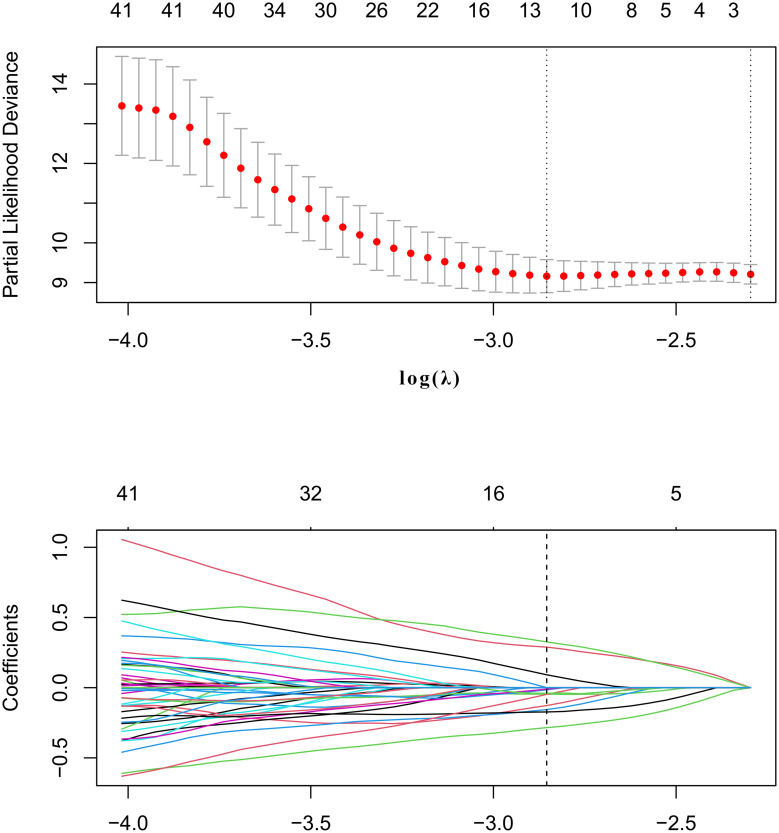
Correlation analysis and LASSO Cox regression analysis were performed to select the features. In correlation analysis, cutoff 0.75 was adopted to exclude the redundancy features with high correlation with each others. LASSO Cox regression was conducted to choose the optimized predictive feature subcohort. The LASSO is shown in Figure 2.
Figure 2.
The least absolute shrinkage and selection operator (LASSO) method was used for feature selection.
Radiomics Signature Building and Validation of Rad-Score
We split the patients into two cohorts according to a 7:3 ratio using stratified random sampling method, one was the training set (n=89), the other was the testing set (n=38). The training set were used to construct the predictive model, and the testing set to validate the model. Patients’ characteristics were compared between the training set and the testing set. Continuous variables were compared using an analysis of variance (ANOVA), and categorical variables using chi-squared test or Fisher’s exact test. In the training set, the most useful predictive radiomics features were selected by using the LASSO. Next, the Rad-score was calculated for each patient by summing the remaining features multiplying their corresponding coefficients.
The potential association of the Rad-score with DFS was assessed in the training set and validated in the testing set. The optimal thresholds of the Rad-score were identified using receiver-operating characteristic (ROC) curve analysis. Patients were classified into high-risk or low-risk groups according to the threshold of Rad-score. Youden’s J Index with the maximum value (sensitivities+specificities) was used to calculate the optimal thresholds. Survival between the high- and low-risk groups were analyzed using the Kaplan–Meier curves and differences in the survival between the two sets were compared with Log rank tests.
Development and Validation of the Radiomics Nomogram
In the training set, the effects of clinicopathological variables (age, menopausal status, T stage, N stage, and Ki-67 status), morphologic factors obtained via MRI (enhancement pattern, multifocal or multicenter, mass shape, mass margin, internal enhancement pattern, type of surgery and PCR), and Rad-score on DFS were analyzed using the univariate and multivariates Cox proportional hazards model. Significant variables in the univariate Cox proportional hazard model (P<0.1) were included in the multivariates analysis. To overcome the multicollinearity, stepwise selection based on the Akaike information criterion (AIC) were performed.
The clinicoradiologic-based model incorporated independent MRI features and clinicopathological variables based on univariate and multivariate Cox analysis with stepwise selection.
To demonstrate the value of the radiomics features, we combined the Radscore, MRI features, and clinicopathological variables into Cox regression analysis to choose the final feature subset. After that, the radiomics-clinicoradiologic-based nomogram was built. At last, the clinicoradiologic-based and the radiomics-clinicoradiologic-based nomogram were assessed in the training set, and then validated in the testing set. The predictive ability and discrimination of the model was evaluated using a C-index (index of probability of concordance). The value of the C-index ranges from 0.5–1.0, with 1.0 indicating a perfectly accurate discrimination between the predicted probability and actual outcome, and 0.5 indicating no discriminative ability. The nomograms were subjected to bootstrapping validation (1000 bootstrap resamples) to obtain a relatively corrected C-index. When dividing patients, the same procedures were performed additional three times to improve statistical robustness. The mean C-index of the clinicoradiologic-based and the radiomics-clinicoradiologic-based nomogram in the additional divisions were calculated.
Statistical Analysis
All descriptive statistics were summarized with mean±standard deviation (SD). Categorical variables between the training set and testing set were compared with the Χ2 test or Fisher’s test, and quantitative variables with the t test or Mann–Whitney U-test. All statistical analysis and statistical drawing were performed by R (version 3.6.1 www.r-project.org). p less than 0.05 was considered statistically significant. The “glmnet” package was used to perform Cox regression model analysis. The “rms” and “hdnom” packages were used to analyze Kaplan–Meier curve, nomogram construction, and calibration plot. Some R functions were modified to apply to the data.
Results
Clinical Characteristics
A total of 127 lesions from 127 patients (age range=26–85 years; mean age=51.2 years) were ultimately analyzed. After a mean follow-up period of 39.31 months (range=3–78 months), there were 18 recurrences (three locoregional recurrence, five lung and lymph node metastases, four bone and lymph node metastases, three brain metastases, and three liver metastases). The mean time to recurrence was 16.78 months (range=3–35 months). There was no significant difference in clinical features and MRI morphology between the training set and testing set (shown in Table 1).
Table 1.
Clinical Characteristics Between Training Set and Testing Set
| Characteristics | Training Set (n=89) | Testing Set (n=38) | P-value |
|---|---|---|---|
| Age, mean (SD), years | 51.57±10.88 | 51.47±9.40 | 0.959 |
| Tumor size | 4.01±1.80 | 3.95±1.70 | 0.856 |
| Rad-score | −0.02±0.65 | 0.06±0.65 | 0.499 |
| Menopausal status | 0.473 | ||
| Premenopausal | 27 (27.78%) | 14 (35.61%) | |
| Postmenopausal | 62 (72.22%) | 24 (64.39%) | |
| Enhancement pattern | 0.411 | ||
| Mass | 65 (73.03%) | 25 (65.79%) | |
| Non-mass | 24 (26.97%) | 13 (34.21%) | |
| Multifocal or multicenter | 0.940 | ||
| Present | 24 (26.97%) | 10 (26.32%) | |
| Absent | 65 (73.03%) | 28 (73.68%) | |
| Mass shape | 0.841 | ||
| Round/oval | 8 (8.99%) | 3 (7.89%) | |
| Irregular | 81 (91.01%) | 35 (92.11%) | |
| Tum margin | 0.598 | ||
| Circumscribed | 42 (47.19%) | 16 (72.73%) | |
| Not circumscribed | 47 (52.81%) | 22 (27.27%) | |
| Internal enhancement | 0.227 | ||
| Homogeneous | 11 (12.36%) | 2 (5.26%) | |
| Heterogeneous | 78 (87.64%) | 36 (94.74%) | |
| Pre-NAC T stage | 0.740 | ||
| T2 | 63 (70.79%) | 28 (73.68%) | |
| T3 | 26 (29.21%) | 10 (26.32%) | |
| Pre-NAC N stage | 0.400 | ||
| N0 | 30 (33.71%) | 9 (23.68%) | |
| N1 | 44 (49.44%) | 23 (60.52%) | |
| N2 | 5 (5.62%) | 2 (5.26%) | |
| N3 | 10 (11.23%) | 4 (10.54%) | |
| Ki67 | 0.220 | ||
| High | 72 (80.89%) | 27 (71.05%) | |
| Low | 17 (19.11%) | 11 (28.95%) | |
| Type of surgery | 0.234 | ||
| Conservation | 17 (19.10%) | 4 (10.53%) | |
| Radical surgery | 72 (80.90%) | 34 (89.47%) | |
| PCR | 0.22 | ||
| Yes | 32 (35.95%) | 22 (57.89%) | |
| No | 57 (64.05%) | 16 (42.11%) |
Abbreviations: NAC, neoadjuvant chemotherapy; PCR, pathological complete response; SD, standard deviation.
Selected Features and Rad-Score Building
ICC for radiomic features was from 0.9522–0.9762 between the two radiologists QL and QX. Two radiologists generally agreed on the delineations.
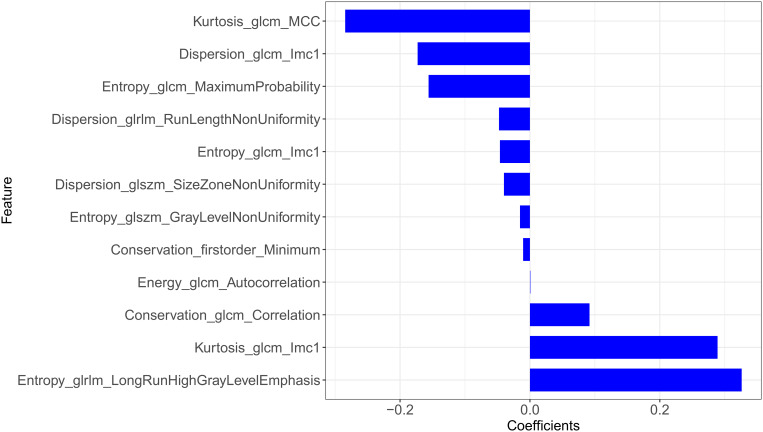
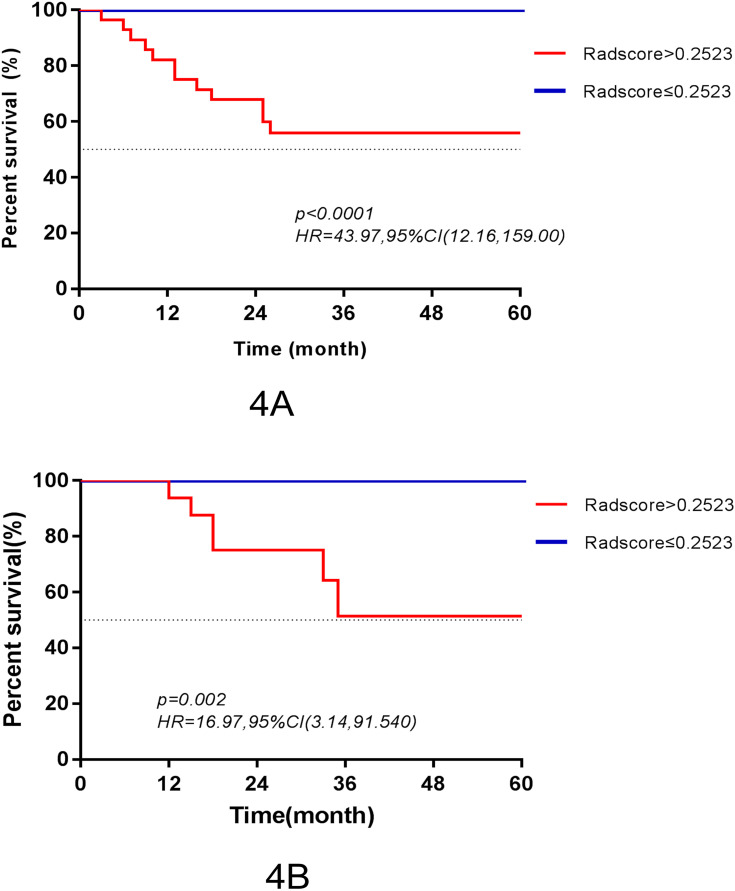
The final features and their coefficients are shown in Figure 3. Rad-score was calculated by summing the remained features and multiplying their corresponding coefficients. The median Rad-score was 0.0000 (range=−1.5546~1.9443). The optimum threshold generated by the ROC curve was −0.2523 (95% CI=0.474~0.864), and the AUC was 0.880 (95% CI=0.794~0.965). According to the optimum threshold, patients were classified into high-risk groups (Rad-score≥-0.2523) and low-risk groups (Rad-score<-0.2523). Rad-score was shown to be associated with the DFS in the training set (P<0.001) by Kaplan–Meier curves and this finding was confirmed in the testing set (P=0.002) (Figure 4). Univariate analysis suggested that Rad-score had a strong predictive value for DFS (DFS: hazard ratio [HR]=43.97, 95% CI=12.16~159.00, P<0.0001) and was validated in the testing set (DFS: hazard ratio [HR]=16.97, 95% CI=3.14~91.54, P=0.002) successfully, and then it was confirmed by multivariates analysis in the training set (DFS: HR=10.276, 95% CI=2.511~42.048, P=0.001) and in the testing set (DFS: HR=10.953, 95% CI=1.168~51.64, P=0.036).
Figure 3.
The potential features and their coefficients after LASSO.
Figure 4.
Kaplan–Meier survival curves according to the Rad-score for patients in the training set (A) and testing set (B).
Clinicopathologic and MRI features were taken into univariate and multivariate analysis, respectively. The univariate analysis revealed that Rad-score, N stage, tumor margin, tumor size, and the enhancement type of tumor were significant biomarkers (Table 2). In the multivariate Cox proportional hazards model, Rad-score, N stage, and the enhancement type of tumor remained independent prognostic factors (Table 3).
Table 2.
Univariate Analysis of Disease-Free Survival in the Training Set
| Characteristics | Log Rank Test | ||
|---|---|---|---|
| X2 | P-value | ||
| Age | >47 | 37.821 | 0.386 |
| ≤47 | |||
| Tumor size | >2.7 | 5.706 | 0.017 |
| ≤2.7 | |||
| Enhancement type | Mass | 2.848 | 0.091 |
| Non-mass | |||
| Multifocal or multicenter | Present | 1.030 | 0.310 |
| Absent | |||
| Mass shape | Round/oval | 0.998 | 0.318 |
| Irregular | |||
| Tumor margin | Circumscribed | 2.768 | 0.096 |
| Not circumscribed | |||
| Internal enhancement | Homogeneous | 1.742 | 0.187 |
| Heterogeneous | |||
| Site of tumor | Right | 1.118 | 0.29 |
| Left | |||
| Pre-NAC Tstage | 2 | 1.024 | 0.312 |
| 3 | |||
| Pre-NAC Nstage | 0 | 57.583 | <0.001 |
| 1 | |||
| 2 | |||
| 3 | |||
| Menopausal status | Premenopausal | 0.028 | 0.868 |
| Postmenopausal | |||
| Ki67 | High | 1.928 | 0.165 |
| Low | |||
| PCR | Yes | 0.700 | 0.403 |
| No | |||
Abbreviations: NAC, neoadjuvant chemotherapy; PCR, pathological complete response.
Table 3.
Multivariate Analysis of Disease-Free Survival in the Training Set
| Characteristics | HR | 95.0% CI | P-value | |
|---|---|---|---|---|
| Radscore | 10.276 | 2.511~42.048 | 0.001 | |
| Nstage | 0 | Ref | ||
| 1 | 0.65 | 0.058~7.256 | 0.727 | |
| 2 | 25.327 | 2.449~261.877 | 0.007 | |
| 3 | 16.304 | 2.229~119.269 | 0.006 | |
| Enhancement type | 0.126 | 0.021~0.739 | 0.022 | |
| Tumor margin | 0.514 | 0.098~2.691 | 0.431 | |
| Size | 0.000 | 0.000~3.090E+209 | 0.961 | |
Abbreviations: HR, hazard ratio; CI, confidence interval.
Performance and Validation of the Radiomics Nomogram
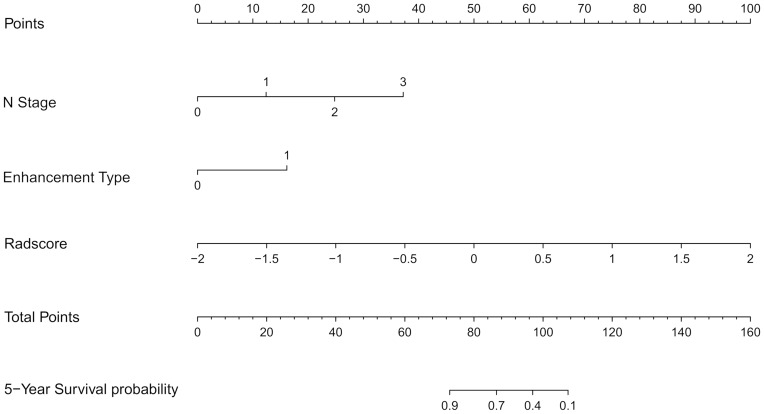
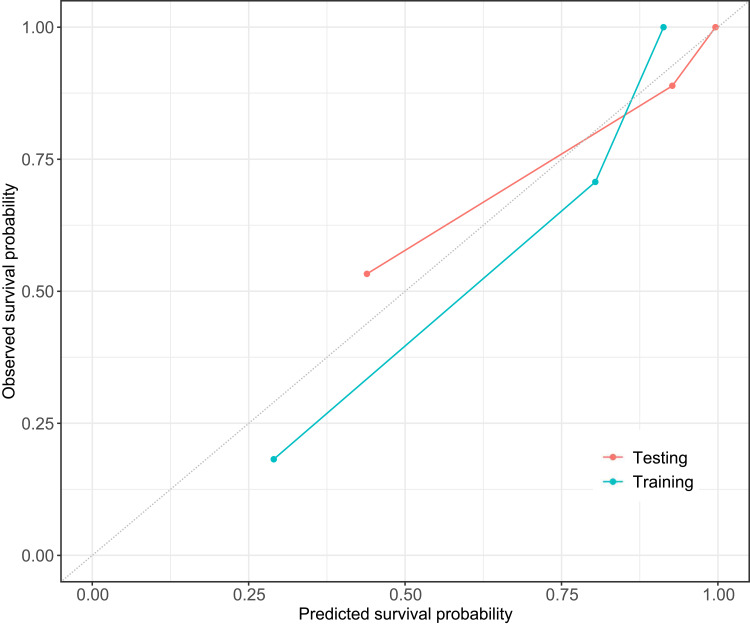
The C-index of the two kinds of model for the prediction of poorer recurrence outcome in training set is shown in Table 4. A radiomics-clinicoradiologic-based nomogram that incorporated the significant factors and Radscore was established (Figure 5). The calibration curve of the radiomics-clinicoradiologic-based nomogram for estimating DFS outcome showed accurate discrimination between prediction and observation both in the training set and testing set (Figure 6).
Table 4.
Performance of the Two Nomogram for Prediction of Outcomes
| Nomogram | Training | Testing | ||
|---|---|---|---|---|
| C-Index | 95% CI | C-Index | 95% CI | |
| Radiomics-clinicoradiologic based | 0.974 | 0.954~0.994 | 0.917 | 0.842~0.991 |
| Clinicoradiologic based | 0.855 | 0.739~971 | 0.831 | 0.643~0.999 |
Note: C-index, index of probability of concordance.
Figure 5.
The radiomics-clinicoradiologic-based nomogram was developed in the training set. The Rad-score was determined by drawing a vertical line to the points’ axis to determine how many points towards the probability of DFS for the patient. The process was repeated for Nstage and enhancement type. The points of the three risk factors were summed, and then the final points located on the Total Point axis.
Figure 6.
Calibration curves of radiomics-clinicoradiologic-based nomogram in the training set (Training) and testing set (Testing). The dashed line indicates a perfect match between the actual probability (y-axis) and the nomogram-predicted probability (x-axis).
Discussion
In this study, we demonstrated the prognostic value of radiomic features derived from multiphases CE-MRI on patients with HER2-positive breast cancer treated with NAC. Compared with the clinicoradiologic-based nomogram, the radiomics-clinicoradiologic-based nomogram had superior prognostic performance in DFS estimation. A visualized nomogram identified the significant contribution of Radscore to the prediction of DFS.
Previous studies11,12,17,18 have confirmed the value of radiomic signatures for DFS prediction in patients with tumors of various organs. In our study, the LASSO Cox model identified 12 potential features obtained from CEsequential, which were calculated by textural changes based on the four phases of DCE images over time points. The 12 selected radiomic features comprised of four features calculated from Entropy, three from Dispersion, two from Kurtosis, two from Conservation, and one from Energy. Among them, the importance of Kurtosis and Entropy in reflecting textural heterogeneity within the tumor had been emphasized in other studies.5,19–21 In addition, seven of 12 potential features were calculated from GLCM (cluster tendency of gray level co-occurrence matrix) which may take into more account the interaction between neighboring pixels and time points than a single pixel value. GLCM had also been confirmed in assessing the tumor heterogeneity.22 Our result revealed that Rad-score had a high value in predicting DFS which was confirmed by Kaplan–Meier survival curves and the Log rank test in the training set (P<0.0001) and in the testing set (P=0.002) respectively. One possible interpretation of our result is that sequential texture features derived from multiphaseS CE-MRI may capture information of both spatial heterogeneity and tumor perfusion. Furthermore, the sequential texture features changing over time points had been identified to be useful in the subtype classification of breast cancer.15
Our study found that the radiomics-clinicoradiologic-based combined nomogram achieved higher prognostic performance than the clinicoradiologic-based nomogram with a higher C-index and better calibration. Therefore, the radiomics-clinicoradiologic-based nomogram could serve as an effective noninvasive biomarker for predicting DFS in patients with HER2-positive breast cancer treated with NAC. Of the clinicopathologic risk factors, Nstage and the enhancement type of tumor contributed to predicting DFS. In clinical practice, the Nstage that is prognostically significant for overall survival and DFS23 is indicated by the regional lymph node burden, size, and location. There is no evidence that non-mass enhancement (NME) breast cancer has a worse prognosis than mass enhancement (ME) type. However, previous literature24 confirmed that HER2-positive breast cancer is more likely to be accompanied by malignant NME lesions. In our study, the rates of non-mass enhancement lesions achieved 28.35% (38/127), and the result indicated that the mortality rate of patients with NME is 3.83-times higher than that of patients with ME type in the training set (P=0.09). Another study25 suggested that HER2 positivity was significantly more common in NME type than that in the ME type. Our study identified that the type of enhancement may be beneficial for risk stratification in HER2-positive breast cancer treated with NAC. Although the mechanism is unclear, N stage and enhancement type on pretreatment MRI might provide meaningful information for predicting prognosis of HER2-positive invasive breast cancer in our model.
Besides, radiomics-clinicoradiologic-based model appears to be very robust. Most studies used mass lesions only, which might not reflect the true characteristics of HER2-positive invasive breast cancer. Several reports26,27 suggested that non-mass enhancement and multifocal or multicentric tumors were more frequently seen in HER2-positive subtype. In our study, the rates of non-mass enhancement and multifocal lesions were 28.35% (38/127) and 25.20% (32/127), respectively. So it is scientific to include non-mass enhancement and multifocal cases in the study. While, in some studies,6,28 non-mass enhancement and unilateral multifocal cases were excluded, our model performed well without regard to tumor morphology and number.
Our study had several limitations to be acknowledged. First, previous studies29,30 have shown that radiological characteristics may be affected by differences in MRI magnetic intensity. In our research, all patients underwent MRI examination with the same scanner and treated with consistent regimens. Second, all patients of this retrospective study were recruited from a single center. Third, although inter-reader reliability was almost perfect and the readers made decisions in consensus finally, selection bias in the classification of enhancement type was inevitable. Last, the study lacked an independent validation cohort. In the future work, adequate patient follow-up will be entailed to externally validate our results.
Conclusion
In conclusion, our studies showed that MRI-based Rad-score can be used as the potential biomarker for risk stratification for DFS in patients with HER2-positive invasive breast cancer treated by NAC. The radiomics-clinicoradiologic-based nomogram may potentially be useful for personalized treatment strategies.
Acknowledgments
Thanks to all personnel involved in the acquisition of data. Also, we are grateful to American Journal Experts for their support in language editing of the study.
Disclosure
Shaofeng Duan is an employee of GE Healthcare China. The authors of this manuscript declare no other potential conflicts of interest in this work.
References
- 1.Perez EA, Suman VJ, Davidson NE, et al. HER2 Testing by Local, Central, and Reference Laboratories in Specimens From the North Central Cancer Treatment Group N9831 Intergroup Adjuvant Trial. J Clin Oncol. 2006;24(19):3032–3038. doi: 10.1200/JCO.2005.03.4744 [DOI] [PubMed] [Google Scholar]
- 2.Lee HJ, Park IA, Park SY, et al. Two histopathologically different diseases: hormone receptor-positive and hormone receptor-negative tumors in HER2-positive breast cancer. Breast Cancer Res Treat. 2014;145(3):615–623. doi: 10.1007/s10549-014-2983-x [DOI] [PubMed] [Google Scholar]
- 3.Fan M, Wu G, Cheng H, et al. Radiomic analysis of DCE-MRI for prediction of response to neoadjuvant chemotherapy in breast cancer patients. Eur J Radiol. 2017;94:140–147. doi: 10.1016/j.ejrad.2017.06.019 [DOI] [PubMed] [Google Scholar]
- 4.Grimm LJ, Zhang J, Mazurowski MA. Computational approach to radiogenomics of breast cancer: luminal A and luminal B molecular subtypes are associated with imaging features on routine breast MRI extracted using computer vision algorithms. J Magn Reson Imaging. 2015;42(4):902–907. doi: 10.1002/jmri.24879 [DOI] [PubMed] [Google Scholar]
- 5.Braman NM, Etesami M, Prasanna P, et al. Intratumoral and peritumoral radiomics for the pretreatment prediction of pathological complete response to neoadjuvant chemotherapy based on breast DCE-MRI. Breast Cancer Res. 2017;19(1):57. doi: 10.1186/s13058-017-0846-1 [DOI] [PMC free article] [PubMed] [Google Scholar]
- 6.Park H, Lim Y, Ko ES, et al. Radiomics Signature on Magnetic Resonance Imaging: association with Disease-Free Survival in Patients with Invasive Breast Cancer. Clin Cancer Res. 2018;24(19):4705–4714. doi: 10.1158/1078-0432.CCR-17-3783 [DOI] [PubMed] [Google Scholar]
- 7.Liu Z, Wang S, Dong D, et al. The Applications of Radiomics in Precision Diagnosis and Treatment of Oncology: opportunities and Challenges. Theranostics. 2019;9(5):1303–1322. doi: 10.7150/thno.30309 [DOI] [PMC free article] [PubMed] [Google Scholar]
- 8.Lambin P, Leijenaar R, Deist TM, et al. Radiomics: the bridge between medical imaging and personalized medicine. Nat Rev Clin Oncol. 2017;14(12):749–762. doi: 10.1038/nrclinonc.2017.141 [DOI] [PubMed] [Google Scholar]
- 9.Aerts HJ, Velazquez ER, Leijenaar RT, et al. Decoding tumour phenotype by noninvasive imaging using a quantitative radiomics approach. Nat Commun. 2014;5(1):4006. doi: 10.1038/ncomms5006 [DOI] [PMC free article] [PubMed] [Google Scholar]
- 10.Gillies RJ, Kinahan PE, Hricak H. Radiomics: images Are More than Pictures, They Are Data. Radiology. 2016;278(2):563–577. doi: 10.1148/radiol.2015151169 [DOI] [PMC free article] [PubMed] [Google Scholar]
- 11.Ravanelli M, Agazzi GM, Tononcelli E, et al. Texture features of colorectal liver metastases on pretreatment contrast-enhanced CT may predict response and prognosis in patients treated with bevacizumab-containing chemotherapy: a pilot study including comparison with standard chemotherapy. Radiol Med. 2019;124(9):877–886. doi: 10.1007/s11547-019-01046-4 [DOI] [PubMed] [Google Scholar]
- 12.Mo X, Wu X, Dong D, et al. Prognostic value of the radiomics-based model in progression-free survival of hypopharyngeal cancer treated with chemoradiation. Eur Radiol. 2020;30(2):833–843. doi: 10.1007/s00330-019-06452-w [DOI] [PubMed] [Google Scholar]
- 13.Oh J, Lee JM, Park J, et al. Hepatocellular Carcinoma: texture Analysis of Preoperative Computed Tomography Images Can Provide Markers of Tumor Grade and Disease-Free Survival. Korean J Radiol. 2019;20(4):569. doi: 10.3348/kjr.2018.0501 [DOI] [PMC free article] [PubMed] [Google Scholar]
- 14.Haider MA, Vosough A, Khalvati F, et al. CT texture analysis: a potential tool for prediction of survival in patients with metastatic clear cell carcinoma treated with sunitinib. Cancer Imaging. 2017;17(1):4. doi: 10.1186/s40644-017-0106-8 [DOI] [PMC free article] [PubMed] [Google Scholar]
- 15.Xie T, Wang Z, Zhao Q, et al. Machine Learning-Based Analysis of MR Multiparametric Radiomics for the Subtype Classification of Breast Cancer. Front Oncol. 2019;9:505. doi: 10.3389/fonc.2019.00505 [DOI] [PMC free article] [PubMed] [Google Scholar]
- 16.Blaschke E, Abe H. MRI phenotype of breast cancer: kinetic assessment for molecular subtypes. J Magn Reson Imaging. 2015;42(4):920–924. doi: 10.1002/jmri.24884 [DOI] [PubMed] [Google Scholar]
- 17.Meng Y, Zhang Y, Dong D, et al. Novel radiomic signature as a prognostic biomarker for locally advanced rectal cancer. J Magn Reson Imaging. 2018;48(3):605–614. doi: 10.1002/jmri.25968 [DOI] [PubMed] [Google Scholar]
- 18.Kim S, Kim MJ, Kim EK, et al. MRI Radiomic Features: association with Disease-Free Survival in Patients with Triple-Negative Breast Cancer. Sci Rep. 2020;10(1):3750. doi: 10.1038/s41598-020-60822-9 [DOI] [PMC free article] [PubMed] [Google Scholar]
- 19.Parikh J, Selmi M, Charles-Edwards G, et al. Changes in primary breast cancer heterogeneity may augment midtreatment MR imaging assessment of response to neoadjuvant chemotherapy. Radiology. 2014;272:100–112. [DOI] [PubMed] [Google Scholar]
- 20.De Cecco CN, Ganeshan B, Ciolina M, et al. Texture analysis as imaging biomarker of tumoral response to neoadjuvant chemoradiotherapy in rectal cancer patients studied with 3-T magnetic resonance. Invest Radiol. 2015;50(4):239–245. doi: 10.1097/RLI.0000000000000116 [DOI] [PubMed] [Google Scholar]
- 21.Huang Y, Liu Z, He L, et al. Radiomics Signature: A Potential Biomarker for the Prediction of Disease-Free Survival in Early-Stage (I or II) Non-Small Cell Lung Cancer. Radiology. 2016;281(3):947–957. doi: 10.1148/radiol.2016152234 [DOI] [PubMed] [Google Scholar]
- 22.Davnall F, Yip CS, Ljungqvist G, et al. Assessment of tumor heterogeneity: an emerging imaging tool for clinical practice? Insights Imaging. 2012;3(6):573–589. doi: 10.1007/s13244-012-0196-6 [DOI] [PMC free article] [PubMed] [Google Scholar]
- 23.Ho AS, Kim S, Tighiouart M, et al. Association of Quantitative Metastatic Lymph Node Burden With Survival in Hypopharyngeal and Laryngeal Cancer. JAMA Oncol. 2018;4(7):985–989. doi: 10.1001/jamaoncol.2017.3852 [DOI] [PMC free article] [PubMed] [Google Scholar]
- 24.Gweon HM, Jeong J, Son EJ, et al. The clinical significance of accompanying NME on preoperative MR imaging in breast cancer patients. PLoS One. 2017;12(5):e178445. doi: 10.1371/journal.pone.0178445 [DOI] [PMC free article] [PubMed] [Google Scholar]
- 25.Koh J, Park AY, Ko KH, et al. Can enhancement types on preoperative MRI reflect prognostic factors and surgical outcomes in invasive breast cancer? Eur Radiol. 2019;29(12):7000–7008. doi: 10.1007/s00330-019-06236-2 [DOI] [PubMed] [Google Scholar]
- 26.Pekar G, Hofmeyer S, Tabar L, et al. Multifocal breast cancer documented in large-format histology sections: long-term follow-up results by molecular phenotypes. Cancer Am Cancer Soc. 2013;119:1132–1139. [DOI] [PubMed] [Google Scholar]
- 27.Morrow M. Personalizing extent of breast cancer surgery according to molecular subtypes. Breast. 2013;22(Suppl 2):S106–S109. doi: 10.1016/j.breast.2013.07.020 [DOI] [PubMed] [Google Scholar]
- 28.Cain EH, Saha A, Harowicz MR, et al. Multivariate machine learning models for prediction of pathologic response to neoadjuvant therapy in breast cancer using MRI features: a study using an independent validation set. Breast Cancer Res Treat. 2019;173(2):455–463. doi: 10.1007/s10549-018-4990-9 [DOI] [PMC free article] [PubMed] [Google Scholar]
- 29.Ford J, Dogan N, Young L, et al. Quantitative Radiomics: impact of Pulse Sequence Parameter Selection on MRI-Based Textural Features of the Brain. Contrast Media Mol Imaging. 2018;2018:1729071. doi: 10.1155/2018/1729071 [DOI] [PMC free article] [PubMed] [Google Scholar]
- 30.Molina D, Perez-Beteta J, Martinez-Gonzalez A, et al. Lack of robustness of textural measures obtained from 3D brain tumor MRIs impose a need for standardization. PLoS One. 2017;12(6):e178843. doi: 10.1371/journal.pone.0178843 [DOI] [PMC free article] [PubMed] [Google Scholar]


