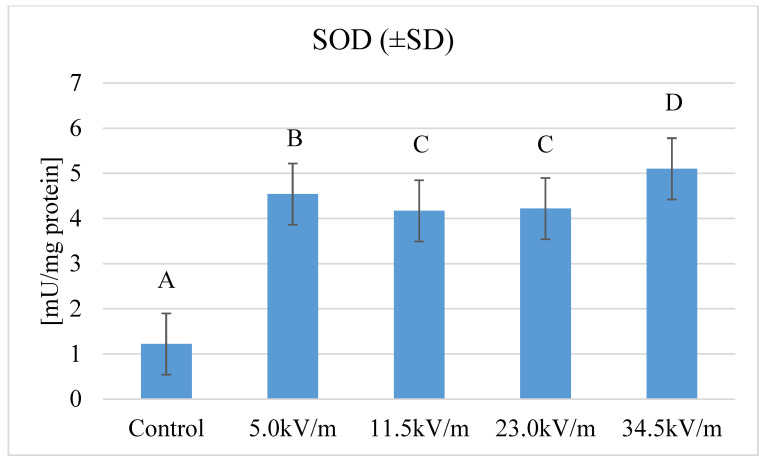
Figure 1.
Superoxide dismutase (SOD) activity in honeybee hemolymph after exposure to the E-field (50 Hz and different intensities). The group name is the f E-field intensity. The control group was marked with the letter C. The control groups were not treated to the artificial electromagnetic field, they were under the influence of an electromagnetic field lower than 2.00 kV/m. Statistical differences between the mean values for groups are marked with different letters. Different letters mean the difference is at the p-value ≤ 0.05 significance level.

