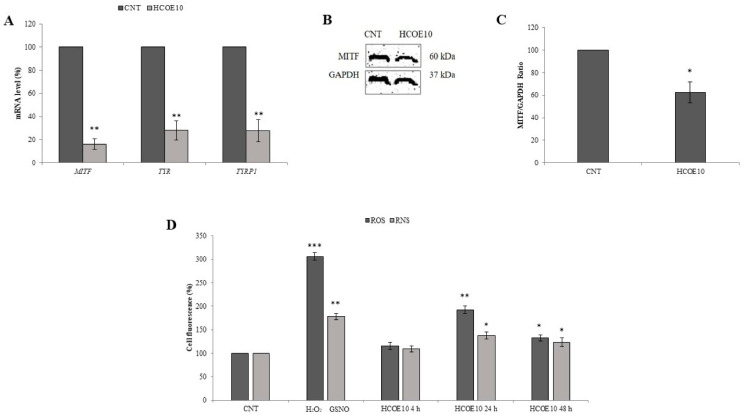
Figure 3.
Analysis of mouse monoclonal microphthalmia-associated transcription factor (MITF) signaling and cell redox state. (A) MITF, tyrosinase (TYR), and tyrosinase-related protein 1 (TYRP1) mRNA levels, measured by RT-PCR, in A375 cells treated for 48 h with 10 mg/mL HCOE are reported. Gene expression calculated as mRNA amount after normalization for β-actin (ACTB) mRNA (2-∆∆Ct) is reported as percentage with respect to the PBS control (considered as unit, 100%). Data represent the mean ± SD of four independent measurements (** p < 0.01 vs. control). (B) Representative Western blotting membrane of Mitf and Gapdh protein levels is shown. (C) Quantitation of MITF protein in A375 cells treated for 48 h with HCOE 10 mg/mL is reported. The results obtained by the ratio between Mitf and Gapdh (used as internal loading control) are indicated as percentage values with respect to PBS control (considered as unit, 100%). Data indicate the mean ± SD of three independent experiments (* p < 0.05 vs. control). (D) Intracellular reactive oxygen (ROS) and nitrogen (RNS) species levels were quantified in A375 cells, treated with 10 mg/mL of HCOE for 4, 24, and 48 h, by DCFH-DA and DAF-FM DA fluorescent assays, respectively. Radical species concentration is reported as percentage compared to PBS control (CNT). Hydrogen peroxide (H2O2) and S-Nitrosoglutathione (GSNO) treatments were performed as positive controls for ROS and RNS analysis, respectively. Results are expressed as mean ± SD of three independent measurements (* p < 0.05; ** p < 0.01; *** p < 0.001 vs. control).

