

Abstract
Summary
Objective:
To define inflammation-related host-microbe interactions in experimental spondyloarthritis using novel inter-omic approaches.
Methods:
The relative frequency of gut microbes was determined by 16S rRNA gene sequencing, and gene expression by RNA-seq of host tissue. HLA-B27/human β2-microglobulin transgenic (HLA-B27 TG) and wild type (WT) rats from Dark Agouti, Lewis, and Fischer backgrounds were used. Inter-omic analyses using Cytoscape were employed to identify relevant relationships. PICRUSt was used to predict microbial functions based on known metagenomic profiles.
Results:
Inter-omic analysis revealed several gut microbes microbes strongly associated with dysregulated cytokines driving inflammatory response pathways (e.g. IL-23, IL-17, IL-1, IFN-γ, TNF). Many microbes were uniquely associated with inflammation in Lewis or Fischer rats, and one was relevant on both backgrounds. Several microbes strongly correlated with immune dysregulation were not differentially abundant in HLA-B27 TG compared to WT controls. Multi-omic network analysis revealed non-overlapping clusters of microbes in Lewis and Fischer rats that were strongly linked to overlapping dysregulated immune/inflammatory genes. Prevotella, Clostridiales, and Blautia were important in Lewis rats, while Akkermansia muciniphila and members of the Lachnospiraceae family dominated in Fischer animals. Inflammation-associated metabolic pathway perturbation (e.g. butanoate, propanoate, LPS, and steroid biosynthesis) was also predicted from both backgrounds.
Conclusions:
Inter-omic and network anaylsis of gut microbes and the host immune response in experimental SpA provides an unprecedented view of organisms strongly linked to dysregulated IL-23, IL-17, IL-1, IFN-γ, and TNF pathways. Functional similarities between these organisms may explain why different genetic backgrounds exhibit common patterns of immune dysregulation, possibly through perturbation of similar metabolic pathways. These results highlight the power of linking analyses of gut microbiota with the host immune response to gain insights into role of dysbiotic microbes in SpA beyond taxonomic profiling.
Keywords: Spondyloarthritis (SpA), HLA-B27, inter-omic analysis, multi-omic network analysis, candidate causal microbes, microbiome, metabolome, inflammation, host genetics
Introduction
Host-microbe interactions play an important role in immune and metabolic homeostasis, but also contribute to several disease states. Gut microbiota are altered in spondyloarthritis (SpA) and its associated gut inflammation (1), and are necessary for the development of experimental SpA in HLA-B27/human β2-microglobulin (hβ2m) transgenic (HLA-B27 TG) rats (2). Transgenic rats expressing HLA-B27 or the non-disease associated HLA-B7 allele, along with hβ2m, exhibit altered gut microbial communities, suggesting that MHC class I proteins can shape the microbiome (3), and supporting the hypothesis that HLA-B27 might contribute to SpA pathogenesis through changes in gut microbiota (4).
We recently demonstrated a complex relationship between HLA-B27 and gut microbiota in rats (5). Expression of HLA-B27/hβ2m on three different genetic backgrounds within varying environments leads to dramatically different effects on gut microbiota. Most notably, in disease-susceptible Lewis and Fischer strains, there are striking strain-specific changes in gut microbiota associated with gastrointestinal inflammation (dysbiosis), while dysregulated immune pathways are largely the same. Furthermore, HLA-B27 TG Dark Agouti (DA) rats that are resistant to the development of disease exhibit few changes in gut microbiota. These results revealed that HLA-B27-induced dysbiosis is largely ecological in nature, rather than causing consistent changes in one or a small number of bacteria.
Here, we sought to determine which gut microbes are most strongly associated with immune dysregulation in HLA-B27 TG rats. We employed a novel ‘inter-omic’ analysis correlating the relative frequency of individual gut microbes with variable mRNA transcripts across Lewis, Fischer and DA backgrounds. This analysis revealed striking background dependent gut microbial signatures associated with activation of IL-23/IL-17, IFNγ, and TNF pathways. Moreover, a muti-omic network analysis revealed microbes that are strong candidates for key drivers of the disease on each background. Notably, many of these microbes were not identified by previous genotype comparisons (e.g. HLA-B27 vs. WT) alone and thus were not considered part of the dysbiotic signature. These results underscore the power of inter-omic network analysis to find potentially disease-related microbes.
Materials and Methods
Inter-omic Analysis.
We analyzed the relative frequency of microbial taxa at the species level (Level 7) determined by 16S rRNA gene sequencing, together with the relative expression of host genes measured by RNA-seq. These data were generated previously to analyze the effects of HLA-B27 on gut microbiota (5). The rat strains, breeding, feeding, and housing conditions have been described (5). Briefly, Dark Agouti (DA), Fischer (F344), and Lewis rats carry the same transgene locus and were fed the same chow (Purina 5008). DA and Lewis animals were housed at NIH facilities while Fischer rats were housed at OHSU. Both male and female HLA-B27 and WT littermate rats were used for the analysis. Animals were weaned 21 days after birth, with DA and Lewis animals cohoused on the basis of sex until they reached per cage weight resctrictions. Fischer animals were cohoused on the basis of sex and genotype. To perform inter-omic analysis it was necessary to analyze matched samples. Therefore, animals for which both gut microbiome and host transcriptome data were available were included in the study (cecum mucosa, n= 58; cecum lumen, n= 56; colon lumen, n= 64). Host transcripts from RNA-seq were calculated in Reads Per Kilobase Million (RPKM), and microbes expressed as relative frequency (%). Microbes with a maximum relative abundance of 0.1% in one or more samples, and transcripts with a maximum RPKM of at least 1 and coefficient of variation (C.V.) >0.8 were further analyzed. This focuses the analysis on relatively abundant (at least 1 in 1,000) microbes and variable host transcripts. For each tissue site, correlations between relative frequency of microbes and host transcript levels were analyzed using Partek Genomic suite (PGS 7.18). Pearson’s correlation coefficients (r) were considered significant if the p value was <0.05, and the q value <0.1. For robust biological interpretation, only microbes that correlated with greater than 5% of transcripts and the transcripts that correlated with greater than 5% of the microbes were included in heatmaps. Hierarchical clustering of the host-microbe correlation values (r) was performed using Euclidean dissimilarity and average linkage method in Partek and then displayed in heat maps. Pathways associated with these genes were determined using Toppgene (https://toppgene.cchmc.org).
Inter-omic Network Analysis
To determine candidate causal microbes in Lewis and Fischer backgrounds, gene-gene, gene-microbe and microbe-microbe correlations were performed using PGS 7.18. The same criteria described above were used to select microbes and transcripts. Significant correlations either >0.6 or <−0.6 (FDR <0.2) were selected to make interaction networks in Cytoscape (3.7.1) (cytoscape.org). From this large network, clusters representing highly interconnected regions were determined using a cytoscape pluggin MCODE (apps.cytoscape.org/apps/mcode). Pathway enrichment in these clusters was determined using Metascape (metascape.org).
Metagenomic Analysis
To infer metagenome functional information from 16S rRNA gene sequences, we employed the bioinformatics software package PICRUSt (Phylogenetic Investigation of Communities by Reconstruction of Unobserved States; http://picrust.github.com/picrust/). It estimates the gene families that contribute to a metagenome from bacteria and archaea by marker (16S rRNA) gene survey, while correcting for variable marker gene copy number. Operational taxonomic unit (OTU) data obtained from 16S rRNA gene sequencing (5) was transformed into KEGG (Kyoto Encyclopedia of Genes and Genomes) orthology abundances, using the PICRUSt pipeline. The resulting metabolites were annotated and mapped to different hierarchical levels of KEGG pathways (level 1–3) and represent varying proportions of each generated metagenome from a sample. To determine the metabolic pathways perturbed during gut inflammation, correlation analysis between KEGG level 3 pathways and disease severity (histology score) was performed. To focus on the most robust correlations, only significant (p<0.05, FDR q<0.2) correlation coefficient values (r) greater than 0.2 or less than −0.2 were used.
Results
Inter-omic analysis of microbial dysbiosis and immune dysregulation in HLA-B27-induced gut inflammation
In a previous study we analyzed relative frequencies of gut microbiota and differentially expressed host genes in HLA-B27 TG and WT rats across DA, Lewis and Fischer backgrounds, and with different environmental influences (5). This revealed striking differences in HLA-B27-induced gut microbial dysbiosis due to genetic background and/or environment, despite dysregulation of common immune pathways. Here, using this large dataset (5), we sought to determine which gut microbes are associated with immune dysregulation by performing an ‘inter-omic’ analysis, correlating the relative frequency of gut microbes with variably expressed host genes across different backgrounds and environment.
Microbial abundance of diverse taxa is correlated with shared inflammatory pathways across backgrounds.
Correlation between the cecal lumenal microbes and cecal gene expression is shown in Figure 1 for rats all on three backgrounds that were studied. Correlations were performed on the cecum and colon only, as these animals do not develop ileal inflamation. The heat map of correlation values reveals multiple cecal lumen microbes (columns) whose relative frequency correlates either positively (red) or negatively (blue) with variably expressed host genes (transcripts) in individual rows. Microbes are color-coded to denote whether they were identified previously (5) as part of the HLA-B27-associated dysbiotic signature of Fischer (purple), Lewis (green), Fischer and Lewis (orange), or neither (black) background. Pathways associated with these host genes were determined using ToppGene, with prominent clusters delineated by brackets. Cluster I represents inflammatory response pathways with the identifiers listed to the right (e.g. IL-17, TNF, IL-23 mediated signaling pathways, etc.), that have a strong positive correlation with microbes listed on top (right) (e.g. Parabacteroides distasonis, Rhizobiaceae, Lachnospira, Akkermansia muciniphila, Clostridium saccharogumia, rc4-4, Bacteroides uniformis), and a few negative correlations to the far left (Clostridiales, Phascolarctobacterium). Only Clostridium saccharogumia exhibits differences in relative frequency on both Lewis and Fischer backgrounds, while many of the remaining microbes in Figure 1 appear to demonstrate background-specific correlations with the common immune dysregulation pathways. However, it should be noted that 24 of the 44 microbes shown in Figure 1 (black) were not identified in our previous analysis (5), meaning that differences in their relative frequency in HLA-B27 TG compared with WT rats on either Fischer or Lewis backgrounds were not statistically significant.
Figure 1. Inter-omic analysis between lumenal microbes and host gene expression in cecum.

A, Heat map depicting correlations (r) between the relative frequency of cecum lumen microbiota (Microbes) and host cecum transcripts (RPKM) (Transcripts) from DA, Lewis and Fischer rats (n = 58). Pearson’s correlation coefficient (r) was calculated and significant values (p <0.05; q <0.1) were subjected to hierarchical clustering. Microbes correlating with at least 5% of the total transcripts and vice-versa are shown. Microbes identified as dysbiotic in Lewis rats are highlighted in green, Fischer in purple, and both Lewis and Fischer in orange. Microbes in black were not dysbiotic in either Lewis or Fischer rats. Transcript clusters I-IV identified pathways through ToppGene that are depicted on the right. B, Background-specific correlations. RPKM values for individual inflammatory genes (Ifng, Tnf, Il23a, Il17a and Il1a) are plotted against Relative Frequency for selected representative microbes not previously identified as dysbiotic on either background (highlighted in black in Figure 1A). Lines represent best fit and shadows show 95% confidence intervals.
Inter-omic analyses were also performed on cecum mucosal and colon lumen micobes with cecum and colon host transcripts, respectively from DA, Lewis and Fischer rats (Supplementary Figures 1 and 2). Overall there was substantial overlap between microbes identified in the cecum lumen (Figure 1A) with those identified in cecum mucosa (42%, Supplementary Figure 1) and colon lumen (50%, Supplementary Figure 2). However, there are also important differences. For example, only the cecum mucosal microbes exhibit a strong positive correlation with the PPARγ signalling pathway, which is a key nuclear receptor in gut epithelial cells that links microbiota to metabolism and inflammation (6).
To further ascertain if microbes discovered by inter-omic analysis but not identified previously as dysbiotic (5) (shown in black) are background specific, individual correlations with multiple inflammatory cytokine genes were performed. Figure 1B shows several striking examples of Fischer- or Lewis-specific correlations. For example, Lachnobacterium was positively associated with upregulation of inflammatory genes (e.g. Ifng, Tnf, Il23, Il17, Il1a) only in Fischer rats, while Desulfovibrionaceae showed positive correlation to these genes only in Lewis rats. Interestingly, Blautia showed a statistically significant positive correlation with genes for many inflammatory cytokines in Lewis rats, while this was not seen in Fischer rats where there was even a trend towards negative correlation. These microbes were not associated with cytokine transcripts in DA rats that lack gastrointestinal inflammation.
Host-microbe network sub-clusters determine candidate causal microbes
The inter-omic correlations described above uncovered additional microbes associated with inflammatory pathways that were not identified by our previous analysis based on the HLA-B27 association (i.e. HLA-B27 vs. WT) alone (5). To begin to unravel the complex relationships and identify microbes that may be driving, rather than resulting from inflammation, we performed an inter-omic network and sub-network analysis on gene-gene, microbe-microbe, and gene-microbe interactions using Cytoscape. This revealed clusters which include microbes interacting with various host immune response genes and pathways in both Lewis (a total of 16 Clusters) and Fischer (a total of 10 Clusters) strains (Figures 2A, B and data not shown). Clusters I and IV in Lewis animals (Figure 2A) and Cluster I in Fischer animals (Figure 2B) show microbes that are strongly associated with inflammatory pathway genes. Positive correlations are depicted by red lines, and negative by blue. In Lewis Cluster I, there are strong positive correlations with Prevotella and inflammation on the Lewis background, while Clostridiales correlates negatively. Prevotella and Clostridiales are connected by a blue line, indicating their reciprocal relationship (Figure 2A). These genes were then input into Toppgene to generate immune pathways. Lewis Cluster IV postively associates Blautia (member of family Lacnospiraceae) with inflammatory pathways such as IL-17, extracellular matrix (ECM), cytokine signaling, and innate immune response pathways. On the Fischer background, many more microbes exhibit positive correlations with inflammation (e.g. Akkermansia muciniphila, rc4-4, Lachnospiraceae, Lachnospira) while [Rumminococus] gnavus is negatively correlated with inflammation and negatively correlated with several other microbes (rc4-4, and Akkermansia muciniphila) (Figure 2B). It is worth noting that ~75% of the genes in Lewis Cluster I and ~60% in Cluster IV overlap with genes in Fischer Cluster I (yellow and purple; with non-overlapping genes in gray) (Figures 2C, D). When input into pathway generating software ToppGene, these genes from Fischer Cluster I and Lewis Clusters I and IV resulted in enrichment of common immune/inflammatory pathways (Figure 2E). This is in stark contrast to the absence of common microbes between the Lewis and Fischer clusters.
Figure 2. Multi-omic network analysis of microbes associated with immune/inflammatory genes.
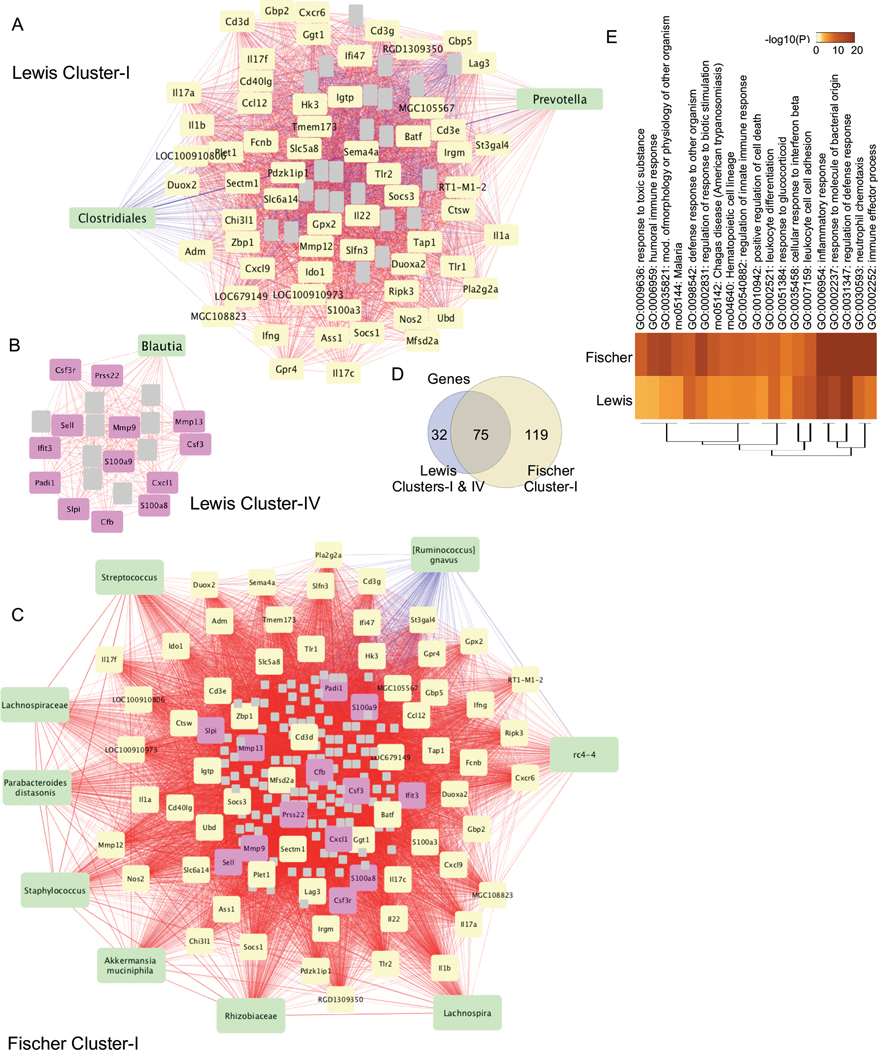
Gene-gene, gene-microbe and microbe-microbe correlations were performed in Cytoscape, and sub-network clusters were determined using MCODE. A, Lewis Cluster I, B, Lewis Cluster IV, C, Fischer Cluster I. Green nodes depict microbes that identify the cluster shown. Yellow nodes (A, C) depict gene clusters that overlap between Lewis and Fischer, while grey nodes (A-C) represent non-overlapping gene clusters and are not labeled. Purple nodes (B, C) show genes that overlap between Lewis Cluster IV and Fischer Cluster I. Postive correlations are shown by red lines and negative correlations are blue. D, Euler diagram shows the genes that overlap between Lewis Cluster I & IV, and Fischer Cluster I. E, Heat map representing the pathways associated with Lewis Cluster I & IV and Fischer Cluster I determined using Metascape. The top 20 significant pathways are shown.
We also observed clusters containing only microbes (or microbes with a few genes, which did not yield any pathways) in both Lewis (e.g. Cluster VI: Xanthomonadaceae, Acinetobacter rhizosphaerae, Stenotrophomonas, Comamonas, Acinetobacter, Rahnella aquatilis, Herbaspirillum, Sphingomonadaceae) and Fischer (e.g. Cluster IV: Sutterella, Bacteroides uniformis, Bacteroides, [Eubacterium] dolichum, [Ruminococcus], Blautia producta, Coprobacillus, Parabacteroides gordonii, Parabacteroides, YS2, Holdemania, Blautia, RF32), indicating strong positive correlations between microbes with no significant host gene (or pathway) interactions (Supplementary Figure 3). There were also clusters of genes that do not associate with microbes, which are linked mostly to metabolic pathways (data not shown; Lewis Clusters II, III, VIII, IX, and Fischer Clusters V, VI).
PICRUSt analysis reveals inflammation associated metabolic pathways
We performed PICRUSt analysis to infer microbial metabolites and metabolic pathways (KEGG levels 1 – 3) associated with gut inflammation. Table 1 highlights important microbial metabolic pathways which correlate positively (bold) or negatively with gut inflammation (histology scores) in DA, Lewis and Fischer WT and HLA-B27 TG animals in the cecum mucosa and lumen as well as colon lumen. A complete list of all disease associated KEGG pathways associated with gut inflammation is shown in Supplementary Table 1. Table 1 includes positively correlating inflammatory pathways (e.g. lipopolysaccharide biosynthesis, steroid biosynthesis, steroid hormone biosynthesis, arachidonic acid metabolism) as well as negatively correlating pathways (e.g. n-glycan biosynthesis, betalain biosynthesis). SCFA metabolic pathways such as butanoate and propanoate biosynthesis also correlate positively with gut inflammation. Other pathways that correlate with inflammation include bacterial cell motility and secretion, cell division, and bacterial invasion of epithelial cells. We also observed anti-inflammatory pathways such as indole alkaloid biosynthesis correlating inversely with inflammation. Other important microbial metabolic functions were disrupted with inflammation, including (i) biosynthesis of vitamins important to the host (e.g. vitamin B-pantothenate and CoA biosynthesis, vitamin B6 metabolism, vitamin C-ascorbate and aldarate metabolism, and antioxidants-carotenoid biosynthesis), and (ii) host digestion (e.g. phenylpropanoid biosynthesis, glycerolipid metabolism, secondary bile acid biosynthesis).
Table 1:
PICRUSt microbial metabolic pathways correlating with gut inflammation in cecum and colon
| Class | Pathways | CM (q-val) | CL (q-val) | CO (q-val) |
|---|---|---|---|---|
| Metabolism | Alanine, aspartate and glutamate metabolism | 2.15E-02 | ||
| Metabolism | alpha-Linolenic acid metabolism | 9.01E-07 | ||
| Metabolism | Amino acid related enzymes | 2.98E-02 | ||
| Metabolism | Aminobenzoate degradation | 8.95E-04 | ||
| Metabolism | Arachidonic acid metabolism | 1.52E-04 | 2.00E-03 | |
| Metabolism | Ascorbate and aldarate metabolism | 1.63E-02 | ||
| Cellular Processes | Bacterial chemotaxis | 4.32E-04 | ||
| Human Diseases | Bacterial invasion of epithelial cells | 6.25E-02 | 9.69E-04 | |
| Genes and Proteins | Bacterial toxins | 7.33E-03 | ||
| Metabolism | beta-Alanine metabolism | 7.26E-03 | ||
| Metabolism | Biotin metabolism | 1.62E-02 | 6.21E-03 | |
| Metabolism | Butanoate metabolism | 2.95E-02 | ||
| Metabolism | Carbohydrate metabolism | 1.54E-02 | ||
| Metabolism | Carotenoid biosynthesis | 8.16E-06 | 2.31E-05 | 1.61E-02 |
| Metabolism | Chlorocyclohexane and chlorobenzene degradation | 4.56E-05 | ||
| Metabolism | Cysteine and methionine metabolism | 1.74E-02 | ||
| Metabolism | Fatty acid biosynthesis | 1.20E-01 | 1.40E-02 | |
| Cellular Processes | Flagellar assembly | 1.42E-05 | ||
| Metabolism | Flavonoid biosynthesis | 2.59E-02 | ||
| Metabolism | Folate biosynthesis | 3.70E-03 | ||
| Metabolism | Fructose and mannose metabolism | 9.00E-03 | ||
| Metabolism | Galactose metabolism | 2.23E-02 | ||
| Metabolism | Glutathione metabolism | 7.62E-03 | ||
| Metabolism | Glycerolipid metabolism | 5.68E-02 | ||
| Metabolism | Glycerophospholipid metabolism | 3.10E-03 | ||
| Metabolism | Glycine, serine and threonine metabolism | 1.53E-02 | ||
| Metabolism | Glycolysis / Gluconeogenesis | 9.84E-03 | ||
| Metabolism | Glycosaminoglycan degradation | 8.59E-06 | 7.74E-06 | |
| Metabolism | Glyoxylate and dicarboxylate metabolism | 9.55E-03 | ||
| Metabolism | Isoflavonoid biosynthesis | 3.01E-02 | ||
| Metabolism | Linoleic acid metabolism | 4.36E-03 | 4.27E-03 | |
| Metabolism | Lipoic acid metabolism | 1.96E-05 | 2.13E-04 | |
| Metabolism | Lipopolysaccharide biosynthesis | 1.00E-02 | 1.41E-03 | |
| Metabolism | Lysine biosynthesis | 2.59E-02 | ||
| Metabolism | Lysine degradation | 2.00E-03 | ||
| Metabolism | N-Glycan biosynthesis | 8.83E-02 | 3.77E-04 | |
| Metabolism | Novobiocin biosynthesis | 2.84E-02 | ||
| Metabolism | Oxidative phosphorylation | 9.00E-03 | ||
| Metabolism | Pantothenate and CoA biosynthesis | 1.14E-02 | ||
| Metabolism | Pentose and glucuronate interconversions | 3.68E-02 | ||
| Metabolism | Pentose phosphate pathway | 1.13E-02 | ||
| Metabolism | Peptidoglycan biosynthesis | 4.31E-02 | ||
| Metabolism | Phenylalanine metabolism | 4.71E-03 | ||
| Metabolism | Phenylalanine, tyrosine and tryptophan biosynthesis | 1.98E-02 | ||
| Metabolism | Phenylpropanoid biosynthesis | 1.05E-01 | 1.38E-02 | |
| Metabolism | Phosphonate and phosphinate metabolism | 5.17E-02 | ||
| Metabolism | Polycyclic aromatic hydrocarbon degradation | 1.88E-03 | ||
| Metabolism | Primary bile acid biosynthesis | 6.08E-05 | 9.66E-06 | |
| Metabolism | Propanoate metabolism | 5.80E-02 | 3.87E-02 | |
| Metabolism | Pyruvate metabolism | 1.68E-02 | ||
| Metabolism | Riboflavin metabolism | 1.33E-03 | ||
| Metabolism | Secondary bile acid biosynthesis | 1.44E-04 | 1.19E-05 | |
| Metabolism | Starch and sucrose metabolism | 1.46E-02 | ||
| Metabolism | Steroid biosynthesis | 2.69E-06 | 8.11E-06 | 7.02E-03 |
| Metabolism | Steroid hormone biosynthesis | 6.04E-07 | 4.76E-07 | 6.40E-02 |
| Metabolism | Sulfur metabolism | 7.62E-05 | ||
| Metabolism | Taurine and hypotaurine metabolism | 1.05E-02 | ||
| Metabolism | Terpenoid backbone biosynthesis | 1.78E-02 | ||
| Metabolism | Thiamine metabolism | 9.55E-03 | ||
| Metabolism | Tryptophan metabolism | 4.31E-03 | ||
| Metabolism | Tyrosine metabolism | 5.13E-03 | ||
| Metabolism | Various types of N-glycan biosynthesis | 2.18E-08 | 1.80E-04 | 1.02E-01 |
| Metabolism | Vitamin B6 metabolism | 4.04E-02 |
Bold font indicates positive correlation and normal font indicates negative correlation.
Discussion
Our previous study demonstrated that disease susceptible HLA-B27 TG Lewis and Fischer rats had largely disctinct patterns of gut microbial dysbiosis, with predominantly overlapping pathways of immune dysregulation (5). These results suggested that different microbes may be associated with a similar host immune response on different genetic background and/or environments as Lewis and Fischer animals were housed in different faclities. Here, we correlated microbial abundance with variably expressed host genes across genetic backgrounds, as well as integrating gene-gene, gene-microbe, and microbe-microbe correlations into networks to comprehensively investigate host-microbe interactions. This novel multi-omic network analysis revealed a small number of microbes that exhibit primary association with the host immune/inflammatory response in a background-specific manner, and thus represent candidate organisms driving gut inflammation. While this study does not define microbial causality, it narrows down a large number of dysbiotic microbes to a few candidates that can be further tested for a direct role in disease pathogenesis.
When we first asked which gut microbes correlate with variably expressed host genes (Figure 1), we were surprised to find that most of the inflammation-associated microbes were not identified in our previous analysis focusing on differences between HLA-B27 TG and WT rats. For example Dehalobacterium, Lachnospiraceae, and Lachnobacterium, which correlate with the primary inflammation cluster in the inter-omic analysis (Cluster I in Figure 1A), were not significantly different between HLA-B27 and WT rats on any genetic background. These findings prompted us to delve further into relationships between microbes and host genes, and also gene-gene and microbe-microbe interactions using a multi-omic network and sub-cluster analysis. Focusing on the largest (most significant) clusters of these host-microbe networks, we found that Prevotella and Blautia (in Lewis animals) and Akkermansia muciniphila, rc4-4, Lachnospira, Lachnospiraceae among others (in Fischer animals) are most strongly linked with dysregulated inflammatory pathways. In contrast, many gut commensal microbes exhibit increases or decreases with disease, but are not associated with any immune/inflammatory network. Of these microbes, many overlap with those identified previously as HLA-B27-associated dysbiotic microbes (e.g. [Barnesiellaceae], RF39, Streptococcus, Coprobacillus, Ruminococus, Aggregatibacter, Anaerotruncus, g_Cupriavidus, f_Erysipelotrichaceae, g_Facklamia, f_Ruminococcaceae). This suggests that differences in the relative frequency of these microbes are not the primary drivers of gut inflammation. Many of these are obligate anaerobes which may decrease as a consequence of increasing oxygen availability due to inflammation, as well as altered colonocyte metabolism (7). Another study showed that while relative frequency of microbes is a marker for microbial dysbiosis, it is not always a marker for microbial activity at the transcript level (8). Future studies analyzing both the activity (metatranscriptome) as well as the relative abundance (metagenome) may provide greater insight into the role of microbes in inflammation.
Consistent with our ecological model of dysbiosis (5), candidate causal microbes identified here using multi-omics are not linked taxonomically. Instead, they can be similar functionally, based on their metabolic effects or their biogeographical niche in the gut. For example, Prevotella (phylum Bacteroidetes), and Akkermansia muciniphila (phylum Verrucomicrobia) are phylogenetically diverse but are thought to exacerbate colitis by disrupting mucosal homeostasis, albeit employing different mechanisms. Prevotella is thought to exacerbate inflammation via enzymes (superoxide reductase and a phosphoadenosine phosphosulphate reductase) that enable it to resist host ROS and outcompete microbes essential for mucosal homeostasis such as Bacteroides spp. (9). On the other hand, Akkermansia muciniphila exacerbates inflammation directly by degrading the mucous layer over epithelial cells, thereby weakening the epithelial barrier (10). A recent study has shown that immunostimulatory potential of LPS produced from Akkermansia muciniphila is greater than that of Prevotella, which may contribute to the increased disease severity in Fischer animals (11).
We used PICRUSt to predict microbial metabolic pathways in each animal and then generated correlations between the relative contribution of the pathways and inflammation. Lewis and Fischer animals exhibit many metabolic pathways known to be associated with gut inflammation (12), including vitamin synthesis (ascorbate and aldarate metabolism, carotenoid biosynthesis) and host digestion (phenylpropanoid biosynthesis, protein digestion and absorption, secondary bile acid synthesis, lipopolysaccharide biosynthesis). We also observed increased short chain fatty acid (SCFA) biosynthesis pathways, namely butanoate and propanoate, associated with gut inflammation consistent with a previous report from a metabolic analysis of these HLA-B27 TG Fischer rats (13). This suggests that butanoate and propanoate pathways are upregulated during inflammation. Whether these SCFAs might be promoting inflammation, or providing protection (albeit insufficiently), is not clear. Future studies into the metabolic role of these inflammation associated phylogenetically diverse microbes from various rat backgrounds will enable a better understanding of how gut microbial metabolism influences the pathogenesis of SpA.
In summary, our novel multi-omic correlation and network anaylsis defined a small number of candidate microbes that may be the primary drivers of gut inflammation in experimental SpA. Importantly, many of these were not identified based simply on a comparison of HLA-B27 vs. WT animals (5). Our findings may help to explain why human disease studies involving non-overlapping cohorts have identified different microbial markers. For example, one recent study revealed Dialister as a microbial marker in SpA (14), while another study of SpA suggested an important role for Ruminococcus gnavus (15). Similarly, in the autoimmune disease systemic lupus erythematosus, different studies have shown that translocation of Lactobacillus reutri (16) or Enterococcus gallinarum (17) to the mesenteric lymph nodes and spleen drives TLR7-dependent autoimmunity. Our multi-omic network approach exploiting different host backgrounds has lead to recognition of phylogenetically different, but metabolically similar microbes associated with HLA-B27-induced inflammation. To conclude, our results distill the myriad of dysbiotic microbes to a few candidates that can be studied in detail for their role in experimental spondyloarthritis.
Supplementary Material
Supplementary Figure 1. Inter-omic analysis between mucosal microbes and host gene expression in cecum
Heat map depicting correlations (r) between the relative frequency of cecum mucosal microbiota (Microbes) and host cecum transcripts (RPKM) (Transcripts) from DA, Lewis and Fischer rats (n = 56). Pearson’s correlation coefficient (r) was calculated and significant values (p <0.05; q <0.1) were subjected to hierarchical clustering. Microbes correlating with at least 5% of the total transcripts and vice-versa are shown. Microbes identified as dysbiotic in Lewis rats are highlighted in green, Fischer in purple, and both Lewis and Fischer in orange. Microbes in black were not dysbiotic in either Lewis or Fischer rats. Transcript clusters I-VIII identified pathways through ToppGene that are depicted on the right.
Supplementary Figure 2. Inter-omic analysis between lumenal microbes and host gene expression in colon
Heat map depicting correlations (r) between the relative frequency of colon lumenal microbiota (Microbes) and host cecum transcripts (RPKM) (Transcripts) from DA, Lewis and Fischer rats (n = 64). Pearson’s correlation coefficient (r) was calculated and significant values (p <0.05; q <0.1) were subjected to hierarchical clustering. Microbes correlating with at least 5% of the total transcripts and vice-versa are shown. Microbes identified as dysbiotic in Lewis rats are highlighted in green, Fischer in purple, and both Lewis and Fischer in orange. Microbes in black were not dysbiotic in either Lewis or Fischer rats. Transcript clusters I-V identified pathways through ToppGene that are depicted on the right.
Supplementary Figure 3. Inter-omic microbial clusters with no association to host immune response
Gene-gene, gene-microbe and microbe-microbe correlations were performed in Cytoscape, and sub-network clusters were determined using MCODE. A, Lewis Cluster VI, B, Fischer Cluster III. Green nodes depict microbes that identify the cluster shown. Grey nodes (A-B) represent genes. Red lines depict postive correlations.
Supplementary Table 1. Table details all the pathways (inferred metagenomic analyses with PICRUSt) perturbed in cecum (mucosa and lumen) and colon correlating with gut inflammation in their respective tissues.
Acknowledgements
For data analysis, we utilized the computational resources of the NIH HPC Biowulf cluster (http://hpc.nih.gov). This work was supported by the NIAMS Intramural Research Program, Z01AR041184. M.A. and J.T.R. are supported by the Rheumatology Research Foundation, Research to Prevent Blindness and the Spondylitis Association of America. They are also supported by NEI RO1 EY029266.
Addendum. This manuscript is dedicated to Mark Asquith who passed away unexpectedly at age 36 on June 6, 2019 from an intracerebral hemorrhage. His knowledge, insights, and enthusiasm contributed greatly to this manuscript.
References
- 1.Gill T, Asquith M, Rosenbaum JT, Colbert RA. The intestinal microbiome in spondyloarthritis. Curr Opin Rheumatol 2015;27:319–25. [DOI] [PMC free article] [PubMed] [Google Scholar]
- 2.Taurog JD, Richardson JA, Croft JT, Simmons WA, Zhou M, Fernandez-Sueiro JL, et al. The germfree state prevents development of gut and joint inflammatory disease in HLA-B27 transgenic rats. J Exp Med 1994;180:2359–64. [DOI] [PMC free article] [PubMed] [Google Scholar]
- 3.Lin P, Bach M, Asquith M, Lee AY, Akileswaran L, Stauffer P, et al. HLA-B27 and human beta2-microglobulin affect the gut microbiota of transgenic rats. PLoS One 2014;9:e105684. [DOI] [PMC free article] [PubMed] [Google Scholar]
- 4.Rosenbaum JT, Davey MP. Time for a gut check: evidence for the hypothesis that HLA-B27 predisposes to ankylosing spondylitis by altering the microbiome. Arthritis Rheum 2011;63:3195–8. [DOI] [PMC free article] [PubMed] [Google Scholar]
- 5.Gill T, Asquith M, Brooks SR, Rosenbaum JT, Colbert RA. Effects of HLA-B27 on Gut Microbiota in Experimental Spondyloarthritis Implicate an Ecological Model of Dysbiosis. Arthritis Rheumatol 2018;70:555–65. [DOI] [PMC free article] [PubMed] [Google Scholar]
- 6.Nepelska M, de Wouters T, Jacouton E, Beguet-Crespel F, Lapaque N, Dore J, et al. Commensal gut bacteria modulate phosphorylation-dependent PPARgamma transcriptional activity in human intestinal epithelial cells. Sci Rep 2017;7:43199. [DOI] [PMC free article] [PubMed] [Google Scholar]
- 7.Litvak Y, Byndloss MX, Baumler AJ. Colonocyte metabolism shapes the gut microbiota. Science 2018;362. [DOI] [PMC free article] [PubMed] [Google Scholar]
- 8.Schirmer M, Franzosa EA, Lloyd-Price J, McIver LJ, Schwager R, Poon TW, et al. Dynamics of metatranscription in the inflammatory bowel disease gut microbiome. Nat Microbiol 2018;3:337–46. [DOI] [PMC free article] [PubMed] [Google Scholar]
- 9.Scher JU, Sczesnak A, Longman RS, Segata N, Ubeda C, Bielski C, et al. Expansion of intestinal Prevotella copri correlates with enhanced susceptibility to arthritis. Elife 2013;2:e01202. [DOI] [PMC free article] [PubMed] [Google Scholar]
- 10.Ganesh BP, Klopfleisch R, Loh G, Blaut M. Commensal Akkermansia muciniphila exacerbates gut inflammation in Salmonella Typhimurium-infected gnotobiotic mice. PLoS One 2013;8:e74963. [DOI] [PMC free article] [PubMed] [Google Scholar]
- 11.Vatanen T, Kostic AD, d’Hennezel E, Siljander H, Franzosa EA, Yassour M, et al. Variation in Microbiome LPS Immunogenicity Contributes to Autoimmunity in Humans. Cell 2016;165:1551. [DOI] [PubMed] [Google Scholar]
- 12.Larsen PE, Dai Y. Metabolome of human gut microbiome is predictive of host dysbiosis. Gigascience 2015;4:42. [DOI] [PMC free article] [PubMed] [Google Scholar]
- 13.Asquith M, Davin S, Stauffer P, Michell C, Janowitz C, Lin P, et al. Intestinal Metabolites Are Profoundly Altered in the Context of HLA-B27 Expression and Functionally Modulate Disease in a Rat Model of Spondyloarthritis. Arthritis Rheumatol 2017;69:1984–95. [DOI] [PMC free article] [PubMed] [Google Scholar]
- 14.Tito RY, Cypers H, Joossens M, Varkas G, Van Praet L, Glorieus E, et al. Brief Report: Dialister as a Microbial Marker of Disease Activity in Spondyloarthritis. Arthritis Rheumatol 2017;69:114–21. [DOI] [PubMed] [Google Scholar]
- 15.Breban M, Tap J, Leboime A, Said-Nahal R, Langella P, Chiocchia G, et al. Faecal microbiota study reveals specific dysbiosis in spondyloarthritis. Ann Rheum Dis 2017;76:1614–22. [DOI] [PubMed] [Google Scholar]
- 16.Zegarra-Ruiz DF, El Beidaq A, Iniguez AJ, Lubrano Di Ricco M, Manfredo Vieira S, Ruff WE, et al. A Diet-Sensitive Commensal Lactobacillus Strain Mediates TLR7-Dependent Systemic Autoimmunity. Cell Host Microbe 2019;25:113–27.e6. [DOI] [PMC free article] [PubMed] [Google Scholar]
- 17.Manfredo Vieira S, Hiltensperger M, Kumar V, Zegarra-Ruiz D, Dehner C, Khan N, et al. Translocation of a gut pathobiont drives autoimmunity in mice and humans. Science 2018;359:1156–61. [DOI] [PMC free article] [PubMed] [Google Scholar]
Associated Data
This section collects any data citations, data availability statements, or supplementary materials included in this article.
Supplementary Materials
Supplementary Figure 1. Inter-omic analysis between mucosal microbes and host gene expression in cecum
Heat map depicting correlations (r) between the relative frequency of cecum mucosal microbiota (Microbes) and host cecum transcripts (RPKM) (Transcripts) from DA, Lewis and Fischer rats (n = 56). Pearson’s correlation coefficient (r) was calculated and significant values (p <0.05; q <0.1) were subjected to hierarchical clustering. Microbes correlating with at least 5% of the total transcripts and vice-versa are shown. Microbes identified as dysbiotic in Lewis rats are highlighted in green, Fischer in purple, and both Lewis and Fischer in orange. Microbes in black were not dysbiotic in either Lewis or Fischer rats. Transcript clusters I-VIII identified pathways through ToppGene that are depicted on the right.
Supplementary Figure 2. Inter-omic analysis between lumenal microbes and host gene expression in colon
Heat map depicting correlations (r) between the relative frequency of colon lumenal microbiota (Microbes) and host cecum transcripts (RPKM) (Transcripts) from DA, Lewis and Fischer rats (n = 64). Pearson’s correlation coefficient (r) was calculated and significant values (p <0.05; q <0.1) were subjected to hierarchical clustering. Microbes correlating with at least 5% of the total transcripts and vice-versa are shown. Microbes identified as dysbiotic in Lewis rats are highlighted in green, Fischer in purple, and both Lewis and Fischer in orange. Microbes in black were not dysbiotic in either Lewis or Fischer rats. Transcript clusters I-V identified pathways through ToppGene that are depicted on the right.
Supplementary Figure 3. Inter-omic microbial clusters with no association to host immune response
Gene-gene, gene-microbe and microbe-microbe correlations were performed in Cytoscape, and sub-network clusters were determined using MCODE. A, Lewis Cluster VI, B, Fischer Cluster III. Green nodes depict microbes that identify the cluster shown. Grey nodes (A-B) represent genes. Red lines depict postive correlations.
Supplementary Table 1. Table details all the pathways (inferred metagenomic analyses with PICRUSt) perturbed in cecum (mucosa and lumen) and colon correlating with gut inflammation in their respective tissues.