Summary
The emergence of the novel SARS coronavirus 2 (SARS-CoV-2) in 2019 has triggered an ongoing global pandemic of severe pneumonia-like disease designated as coronavirus disease 2019 (COVID-19)1. The development of a vaccine is likely to require at least 12-18 months, and the typical timeline for approval of a novel antiviral therapeutic can exceed 10 years. Thus, repurposing of known drugs could significantly accelerate the deployment of novel therapies for COVID-19. Towards this end, we profiled a library of known drugs encompassing approximately 12,000 clinical-stage or FDA-approved small molecules. We report the identification of 100 molecules that inhibit viral replication, including 21 known drugs that exhibit dose response relationships. Of these, thirteen were found to harbor effective concentrations likely commensurate with achievable therapeutic doses in patients, including the PIKfyve kinase inhibitor apilimod2–4, and the cysteine protease inhibitors MDL-28170, Z LVG CHN2, VBY-825, and ONO 5334. Notably, MDL-28170, ONO 5334, and apilimod were found to antagonize viral replication in human iPSC-derived pneumocyte-like cells, and the PIKfyve inhibitor also demonstrated antiviral efficacy in a primary human lung explant model. Since most of the molecules identified in this study have already advanced into the clinic, the known pharmacological and human safety profiles of these compounds will enable accelerated preclinical and clinical evaluation of these drugs for the treatment of COVID-19.
Introduction
In January 2020, the novel SARS coronavirus 2 (SARS-CoV-2) was identified as the causative agent of a severe pneumonia-like coronavirus disease (COVID-19) outbreak in Wuhan, China1. SARS-CoV-2 is an enveloped, positive-sense, single-stranded RNA betacoronavirus, related to the viruses that caused the severe acute respiratory syndrome (SARS) and Middle East respiratory syndrome (MERS) outbreaks in 2002-2004 and 2012-present, respectively. The World Health Organization (WHO) declared the rapidly spreading disease a pandemic on March 11th, 2020, and, as of July 5th, more than 11.2 million confirmed cases and 528,000 deaths have been recorded worldwide in 216 countries5.
It is anticipated that production of a SARS-CoV-2 vaccine will require 12-18 months6, and de novo development of antiviral therapies usually requires 10-17 years7. Thus, repositioning clinically evaluated drugs represents one of the most practicable strategies for the rapid identification and deployment of treatments for emerging infectious diseases such as COVID-19. Toward this end, the repurposing of several approved antiviral therapies has been the focus of clinical investigations, including HIV-1 protease inhibitors lopinavir/ritonavir8, hepatitis C virus protease inhibitor danoprevir9, and the influenza antiviral favipiravir (T-705, Avigan)10. Additionally, Remdesivir, a viral RNA polymerase inhibitor11, has been granted the investigational antiviral drug remdesivir emergency use authorization (EUA) by the FDA for the treatment of COVID-19 based on clinical trial data demonstrating a reduction in time to recovery12,13.
While these targeted repurposing strategies provide potentially rapid trajectories toward an approved treatment, additional therapies for SARS-CoV-2 infection are required to enhance clinical efficacy, extend world-wide drug supplies, and address potential emergence of viral resistance. An unbiased large-scale evaluation of known drugs can identify additional unanticipated therapeutic options that can be positioned for accelerated preclinical and clinical evaluation. Here, we describe a high-throughput reprofiling screen using the ReFRAME (Repurposing, Focused Rescue, and Accelerated Medchem) drug library, a comprehensive open-access library of ~12,000 that have been either FDA-approved or registered outside the US, entered clinical trials, or undergone significant pre-clinical characterization14, to identify existing drugs that harbor antiviral activity against SARS-CoV-2 in a cell-based assay14,15. The ReFRAME library has previously been used to successfully identify potential therapies for tuberculosis16, Cryptosporidium17, and fibrosis18. Each of the compounds in this collection has been previously optimized for efficacy, safety, and bioavailability. This enables the leveraging of considerable investments in research and development to compress the timeline required for drug discovery and development19. Using this approach, we identified 100 known drugs that inhibit SARS-CoV-2 replication in mammalian cells, including 21 compounds for which a dose-response relationship with antiviral activity could be established. Rapid experimental and clinical evaluation of these therapeutics for in vivo antiviral efficacy and amelioration of disease-associated pathologies can provide an important opportunity for the accelerated development of potential therapies for COVID-19.
Results
Optimization of a high-throughput screen for inhibitors of SARS-CoV-2 Replication.
Given the urgent need for therapeutics to treat SARS-CoV-2 infection, we developed a high-throughput assay to enable large-scale screening of known drugs. Vero E6 cells, kidney epithelial cells derived from an African green monkey, have been shown to be highly permissive to SARS-CoV-2 infection20 and viral replication can be assessed through measurement of viral-induced cytopathic effects (CPE)21. A clinical isolate of the SARS-CoV-2 virus (SARS-CoV-2 HKU-001a)22 was utilized for assay development and screening. Assay parameters, including cell seeding density, multiplicity of infection (MOI), and timepoints, were optimized in Vero E6 cells by measuring virus-induced CPE in a 384-well format.
To assess robustness and reproducibility of the optimized assay in a high-throughput screening (HTS) configuration, we initially evaluated the assay utilizing the collection of known bioactive molecules (LOPAC®1280). At the time this effort was initiated, no compound with activity against SARS-CoV-2 in Vero E6 cells had been reported. Based on studies that indicate that inhibition of the PIKfyve kinase inhibits entry of viruses such as Ebola23,24, we evaluated and confirmed the potential antiviral activity of the PIKfyve kinase inhibitor APY0201 against SARS-CoV-2 (Figure ED1a). This enabled a benchmarking of the dynamic range of the assay based on a reliable positive control. SARS-CoV-2-induced CPE activities corresponding to each well was normalized to the median of each plate (Log2FC). The average Z′ factor for the replicate screens was 0.4, and the correlation coefficient (R2) was 0.81 (Figure ED1b–c). Twenty-eight compounds were selected for further confirmation based on activities in replicate screens (Figure ED1b, red circles). These included the HIV protease inhibitor nelfinavir mesylate hydrate and the antagonist of the serotonin receptors 5-HT1B and 5-HT1D, GR 127935 hydrochloride hydrate, which have been previously shown to efficiently block either SARS-CoV-1 or 2 infection25–29.
Repositioning analysis of the ReFRAME Drug Repurposing Library.
Having established that these assay conditions were suitable for progression towards a large-scale screen, we used this experimental design to screen the comprehensive ReFRAME drug repurposing collection (Figure 1a). Specifically, the potential antiviral activity of 11,987 compounds against SARS-CoV-2 was assessed in Vero E6 cells. The assay, conducted at a final compound concentration of 5 μM was designed to capture multicycle replication, based upon low viral input (MOI = 0.01) and an extended endpoint measurement (72 hours post-infection). A reasonable dynamic range between positive and negative controls (Figure 1b, 1d, ED1d and ED1f) and a positive correlation between the replicates were observed (Figure 1c and ED1e), enabling the identification of compounds with potential antiviral activities (see Supplementary discussion).
Figure 1. High-throughput ReFRAME collection repositioning screen for SARS-CoV-2 antivirals.
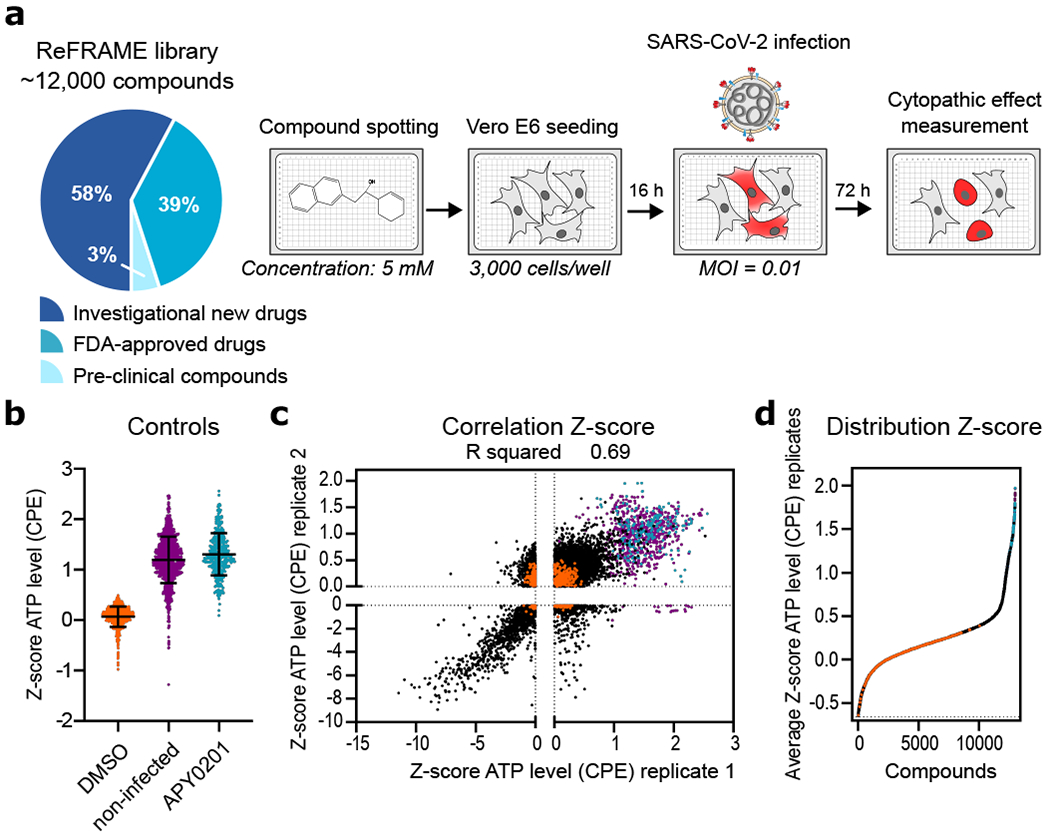
(a) A schematic of the screening strategy employed for the repositioning analysis of the ReFRAME library. Classification of the approximately 12,000 compounds in the ReFRAME collection across different stages of clinical development is depicted in the pie chart. For the HTS screen, compounds were pre-spotted in 384-well plates at a final concentration of 5 μM. 3,000 Vero E6 cells were added to each well and pre-incubated with each compound for 16 h, followed by infection with a clinical isolate of SARS-CoV-2 (HKU-001a) with MOI of 0.01. ATP levels in each well were measured 72 h post-infection using a Cell Titer Glo viability assay as a surrogate measurement of viral cytopathic effect (CPE). (b) Z-scores after normalization to the median of each plate for all positive (APY0201) and negative (DMSO) controls, as well as for non-infected cells, across all the screening plates are shown. Error bars represent mean ± SD for n=376 independent wells (at least). (c) Correlation plot indicates the activity (Z-score) of each compound in the two replicate screens. (d) The activity distribution of each compound based on the average of the Z-score of each replicate is also presented. Each dot indicates the Z-score of each drug in each replicate of the screen (black dots). Values corresponding to DMSO (orange dots), APY0201 (cyan dots) and non-infected cells (purple dots) are also represented. R squared indicate the linear correlation coefficients for the replicates (b, e).
We next evaluated enrichment of known targets and target classes within the screen data. Using a gene set enrichment analysis (GSEA) tool, we examined the distribution of antiviral activities of the compounds within individual target classes to determine if certain therapeutic mechanisms harbored more active compounds than would be expected by chance30,54. We found that 15 target classes and 51 drug targets were found to be enriched in the ranked hit list (Figure 2a and Figure ED2, ED3a, ED4 and Table S1), including allosteric modulators of the benzodiazepine, cytosolic NADPH-dependent oxidoreductase aldose reductase, potassium channels, cholesterol homeostasis, serine proteases, and retinoic acid receptor agonists. Interestingly, we observed that inhibition of viral replication by retinoic acid receptor agonist tazarotene could be reversed through direct chemical antagonism of the transcriptional activator RAR antagonist Ro41-5253 (Figure 2b). Additionally, RNA-seq analysis performed on Vero E6 cell to assess the transcriptional impact of viral challenge in this system revealed a significant decrease (P = 0.0006) in the mRNA levels of genes related to the retinol metabolism after infection with SARS-CoV-2 (Table S2). These data are consistent with previously reported RNA-seq analysis of nasopharyngeal swabs55 (Table S2), and suggest that retinol metabolism and signaling may act as a critical host-pathogen interaction circuit in controlling viral infection.
Figure 2. Gene set enrichment analysis and target gene expression.
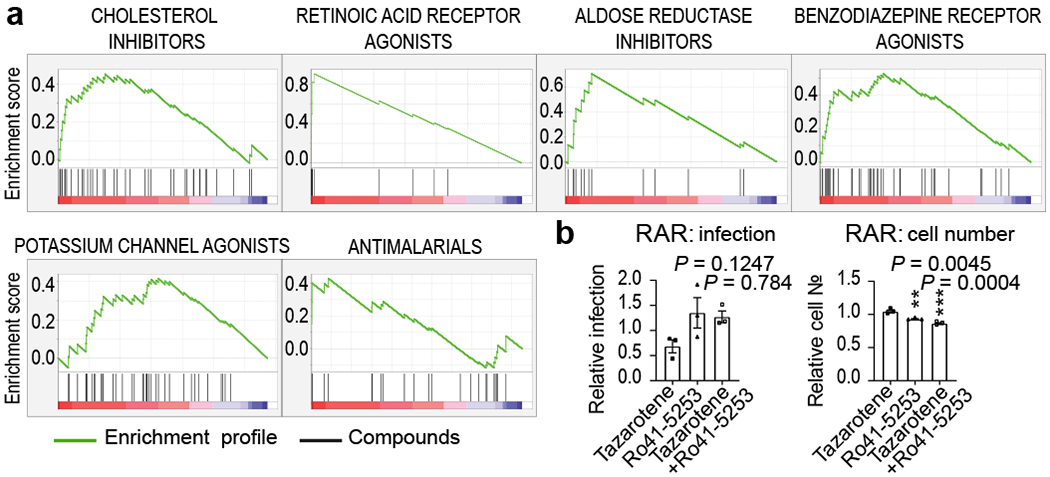
(a) Enriched targets and mechanisms of action of potential antiviral compounds were determined through Gene Set Enrichment Analysis (GSEA). GSEA enrichment plots provide the distribution of the enrichment score (green line) across compounds that were annotated to molecular targets, ranked in order of antiviral activities (left to right). Vertical black lines reflect the positioning of each compound within a specific target class across the ranked dataset, where again, the leftmost position indicates most potent antiviral activity (red), and the rightmost position indicates inactivity in the HTS screen (blue). Enriched target clusters are shown, including retinoic acid receptor agonist, benzodiazepine receptor inhibitor, aldose reductase agonist, potassium channel agonist, cholesterol inhibitor, and antimalarials (P-value < 0.05, FDR q-value < 0.33). Additional enriched target classes are shown in Figure ED2. P-values were calculated as indicated in the materials and methods. (b) Chemical epistasis analysis of Retinoic Acid Receptor Agonist Antiviral Activity. Vero E3 cells were treated with 5 μM of the RAR agonist tazarotene and challenged with SARS-CoV-2, and infection was determined as described in Figure 3. Similarly, Vero E6 cells where pretreated with 5 μM of the RAR antagonist Ro41-5253, either alone or in combination with 5 μM of tazarotene (left panel). Cellular toxicity was measured through enumeration of cell numbers (right panel). Data are normalized to the average of DMSO-treated wells and represent mean ± SEM for n=3 independent experiments. One-way ANOVA followed by Dunnett post-test was performed as statistical analysis. ** P ≤ 0.01, *** P ≤ 0.001.
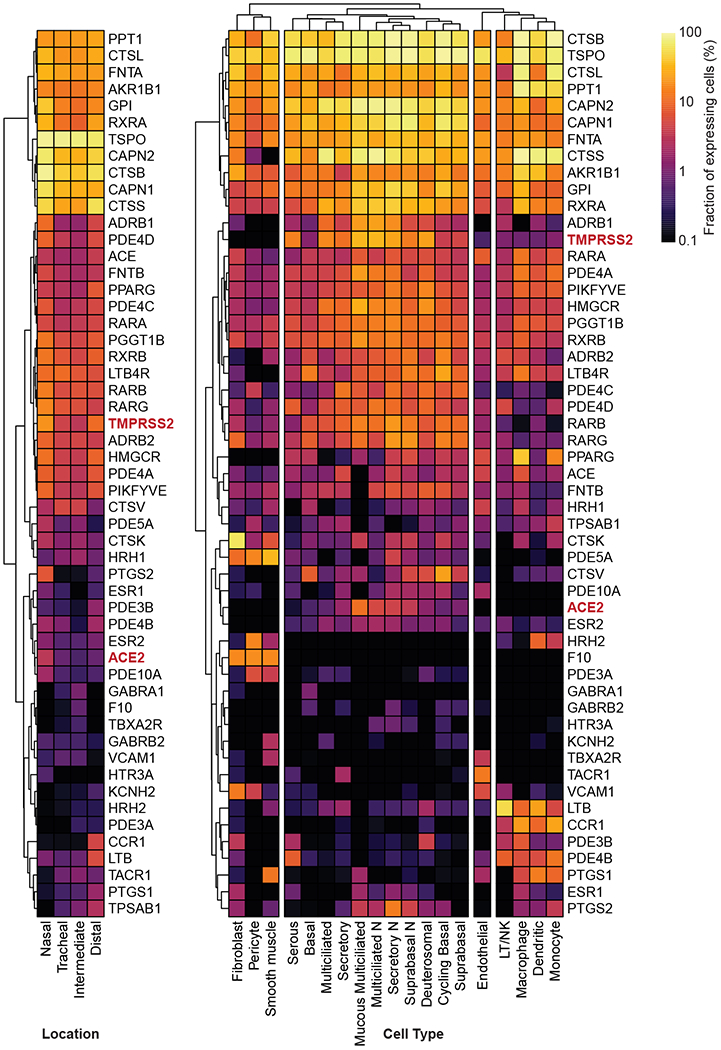
To elucidate the expression pattern of the molecular targets of putative antiviral compounds from this cell-based screen, we utilized a previously reported dataset to analyze the transcriptional profile of these genes across cell types within the respiratory tract56. Critically, a majority of the mapped targets of active compounds also harbored expression in relevant respiratory epithelial cells, suggesting these may be physiologically relevant drug targets (Figure ED5).
Orthogonal validation of selected anti-SARS-CoV-2 compounds.
Approximately 300 compounds were identified for validation studies based on criteria outlined in Materials & Methods (also see supplementary Discussion). We assessed the activity of selected hits at 2.5 and 1 μM, in contrast to the 5 μM concentrations employed in the original screen, using an orthogonal assay readout. Specifically, Vero E6 cells treated with selected compounds were challenged with another SARS-CoV-2 isolate (SARS-CoV-2 USA-WA1/2020), and viral infection directly quantified through immunostaining for the virally encoded NP protein. This configuration likely biased this validation towards confirmation of early inhibitors (also see Supplemental Discussion). Approximately thirty percent of compounds (100 compounds) were found to reduce viral replication by at least 40 % (Table S3).
Several validated compounds were members of enriched GSEA target classes (Figure 2a, ED2), including retinoic acid receptor agonists (LGD-1550, tretinoin, tamibarotene, acitretin, tazarotene, RBAD), the aldose reductase inhibitor AL 3152, benzodiazepine receptor agonists (ZK-93426, zaleplon GR, pagoclone) and antimalarial drugs (AQ-13 and hanfangchin A; Table S3). In addition, six drugs with regulatory approval in the US or Japan were amongst the molecules confirmed to inhibit SARS-CoV-2 replication. These include the antimalarial drug chloroquine, the anti-psoriatic molecule acitretin and the anti-histamine astemizole (Table S3).
Dose response and synergy analysis.
Although highly dependent on a compound’s pharmacokinetic properties, therapeutic dose ranges are typically expected to track to cellular EC50s below 1 μM concentrations. Therefore, we conducted a dose response analysis to determine the relationship between compound concentration and antiviral activity (Figure 3a–b and ED6b–c). In addition to remdesivir, 20 compounds harbored discernable dose-dependent antiviral activities, most of which could be segregated based on broad functional, structural, or target-based classes (Figure 3a–b, ED6b–c). Importantly, we observed a significant divergence between cellular toxicity and antiviral activities (Figure 3a and ED6a), underscoring that the impact of these compounds on replication is well outside a range where cytotoxic or cytostatic activities of the molecules may be impacting measurements of viral growth (Table S4).
Figure 3. Dose-response relationships of selected antiviral compounds and synergy with remdesivir.
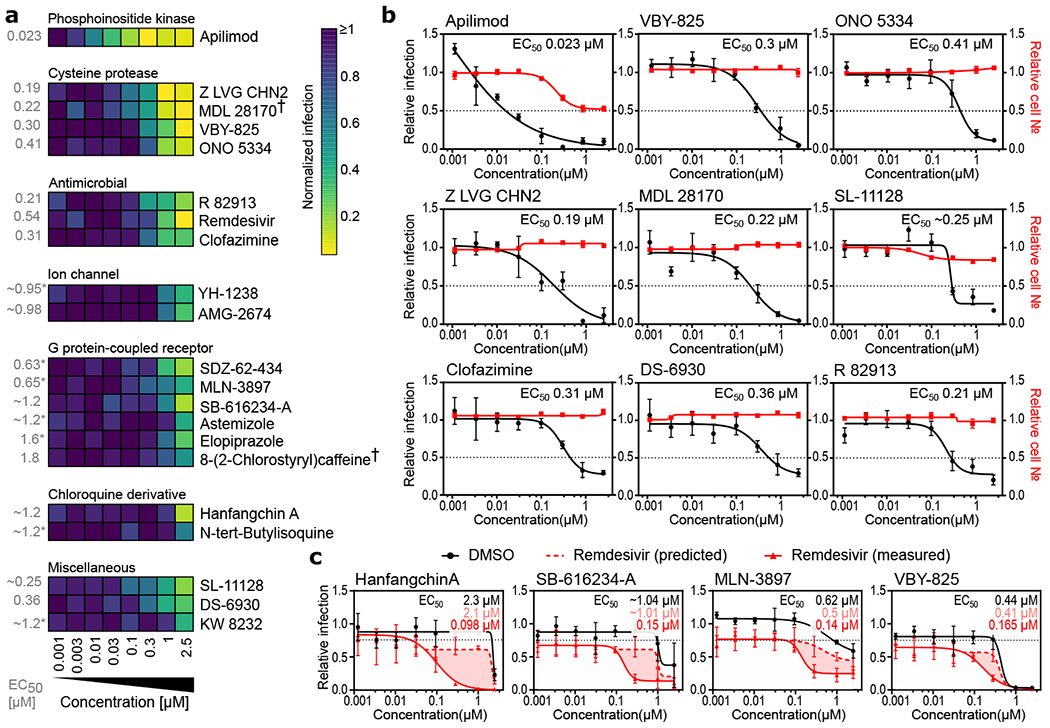
(a-c) Vero E6 cells were pre-treated for 16 h with increasing concentrations of the indicated compound and then infected with SARS-CoV-2 at MOI = 0.01. 24 h post-infection, cells were fixed, and immunofluorescence imaging was performed. For each condition, the percentage of infection was calculated as the ratio between the number of infected cells stained for CoV NP and the total amount of cells stained with DAPI. (a) Heatmap representing normalized infection of the indicated 21 compounds in dose-response, on a scale from 0 to 1, depicting the average of n=5 independent experiments. Compounds are grouped in predicted function clusters. † concentration of 0.85 μM instead of 1 μM at the second highest dose. Extrapolated EC50 values are listed on the left of the heatmap. (b) Dose-response analysis of most potent compounds in (a) are shown, depicting both infectivity (black), cell number (red), and cellular EC50 values (also see ED6). (c) Compounds at indicated doses were combined with 800 nM remdesivir or a negative control (DMSO), and antiviral dose response relationships were determined in Vero E6 cells using experimental conditions described in (b). 800 nM remdesivir alone inhibited viral infection by 20 % (black dotted line). Predicted additive combinatorial activity of remdesvir and indicated compound (see materials and methods) is denoted by red dotted line. Observed activity of remdesivir in combination with the indicated compound is shown with a solid red line, and shaded portions of graph indicate differential of predicted and observed combinatorial activities. EC50s for compound alone (black lettering), predicted (pink lettering), and observed (red lettering) are also presented. Data are normalized to the average of DMSO-treated wells and represent mean ± SEM for n=3 (apilimod, MDL 28170, Z LVG CHN2, VBY-825, and SL-11128) (b,c) and n=5 (ONO 5334 ,clofazimine, DS-6930 and R82913) (b) independent experiments. * indicates compounds for which EC50 values were calculated based on observed values at the highest concentrations.
We next evaluated potential synergies between known drugs confirmed in dose-response and remdesivir. Four compounds were observed to have notable levels of synergy with remdesivir, including hanfangchin A (also known as Tetrandrine), which was one of the two antimalarials validated in this study (Figure 3c). Hanfangchin A is a bis-benzylisoquinoline alkaloid that has been shown to inhibit multiple Ca+2 channels57, and has previously been reported to antagonize entry of Ebola virus in vitro and in vivo through the targeting of endosomal two pore channels (TPCs)58. However, the cellular antiviral activities of chloroquine derivatives have not been recapitulated in clinical trials59,60, possibly due to the inability to achieve a safe and efficacious concentration required for antiviral activities in patients61. These data suggest that a combinatorial approach should be further investigated to determine if in vivo and clinical synergies exist between the two drugs at acceptable safety margins.
Validation across human cell lines
We next sought to ensure that observed efficacies were not restricted to Vero E6 cells. We thus evaluated compound efficacies on two additional human cells lines that support SARS-CoV-2 replication. Specifically, we employed Huh-7 and 293T cells transduced with ACE2. Dose titration analysis found that nearly all (19/21) of the evaluated compounds inhibited viral replication in one or both of these cell lines at potencies equivalent to or greater than those observed in Vero E6 cells. (Figure 5a–b and ED7a–b). 13 compounds harbored EC50s < 500 nM in at least one cell line (Figure 5a–b and ED7), suggesting that they inhibit viral replication at doses can may be achievable in vivo. These include the PPAR-γ agonist DS-6930, which, similar to the RAR agonists, likely governs a nuclear hormone receptor-dependent transcriptional program that functions to obstruct viral replication. In addition, clinical stage non-nucleoside HIV-1 reverse transcriptase inhibitor R 82913 inhibited replication with an EC50 of 210 nM, and these observed efficacies are consistent with reported cell-based antiviral activities against HIV-162,63. Further investigation will be required to determine R 82913 inhibits SARS-CoV-2 replication through inhibition of polymerase function, or through alternative mechanisms. Furthermore, Clofazimine, an FDA-approved molecule on the WHO Model List of Essential Medicines (EML), possessed an antiviral EC50 of 310 nM. This molecule possesses antimycobacterial and anti-inflammatory activity64, and is used for the treatment of leprosy. Further studies are required to understand the mechanism by which this drug blocks the replication of SARS-CoV-2.
Figure 5. Assessment of antiviral activity in human cell models.
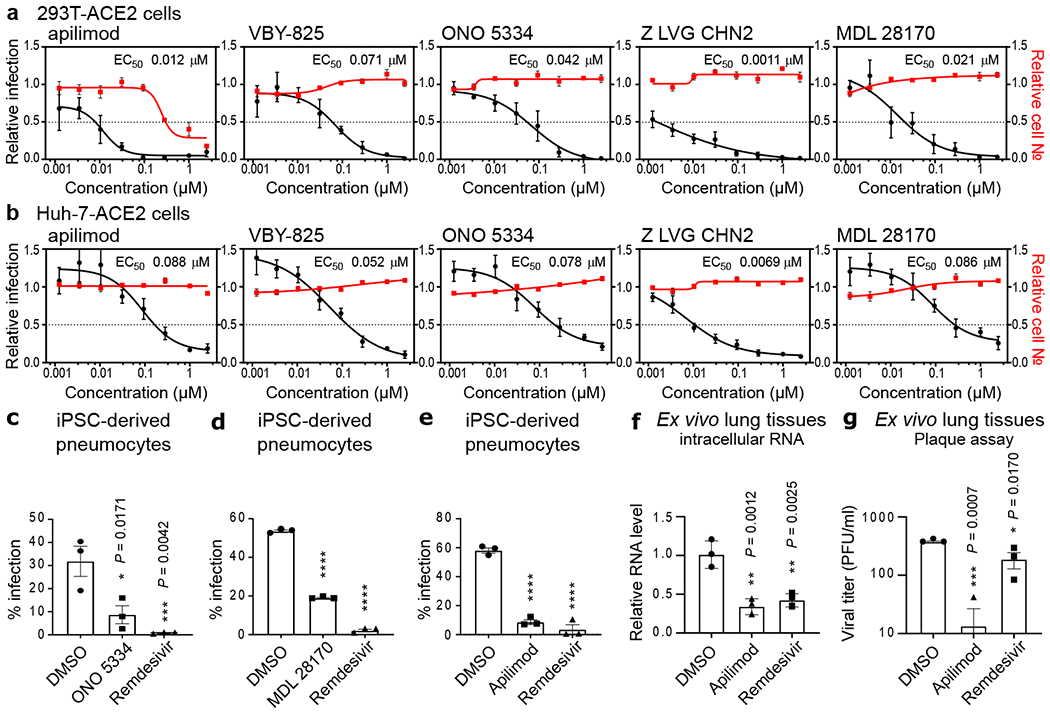
HEK-293T (a) and Huh-7 cells (b) transduced with ACE2 were pre-treated for 16 h with increasing concentrations of the indicated compound and then infected with SARS-CoV-2 (MOI = 0.3). 24 h post-infection, cells were fixed, and immunostained, and imaged by immunofluorescent microscopy. For each condition, the percentage of infection was calculated as the ratio between the number of infected cells stained for CoV NP and the total amount of cells stained with DAPI. Compound concentrations ranged between 1 nM and 2.5 μM. Dose-response curves for infectivity (black) and cell number (red) are shown. Data are normalized to the average of DMSO-treated wells and represent mean ± SEM for n=4 independent experiments. EC50 for each compound was calculated as 4-parameter logistic non-linear regression model and is indicated. (c-e) iPSC-derived pneumocytes were incubated with 5 μM of the indicated compound two hours prior to infection, and then infected with 105 pfu of SARS-CoV-2. Two days post infection, cells were harvested, and viral infection was quantified by flow-cytometry (Cov NP staining). Data represent mean ± SEM for n=3 biological replicates. One-way ANOVA followed by Dunnett post-test was performed as statistical analysis. (f-g) Ex vivo lung tissues were infected with SARS-CoV-2 with an inoculum of 5×10⁵ PFU. After two hours, the inoculum was removed, and the indicated compound was added at a 5 μM concentration. 24 hours post-infection, supernatants were collected for quantification of viral titer by plaque assay (f) and cells harvested for quantification of intracellular viral RNA (g). Error bars represent SEM for n=3 biological replicates. One-way ANOVA followed by Dunnett post-test was performed as statistical analysis. * P ≤ 0.05, ** P ≤ 0.01, *** P ≤ 0.001, **** P ≤ 0.0001.
Impact of Antivirals on the SARS-COV-2 Life Cycle.
We next performed studies to evaluate if five of the most potent compounds identified in this study, apilimod, VBY-825, ONO 5334, Z LVG CHN2 and MDL 28170, act on entry or post-entry steps of the viral life cycle. We first conducted time of addition studies, where compared the effect of the compound either administered concurrently with viral infection, or two and five hours after viral challenge, to allow for viral entry (Figure 4a). To further corroborate these results, we also evaluated the impact of these molecules on infectivity of a VSV-based virus-like particles (VLPs) pseudotyped with SAR-CoV-2 S protein, MERS S protein, or VSV G protein (Figure 4b). Data from these two experiments indicate that these compounds inhibit the entry step of viral replication. Importantly, the protease inhibitors VBY-825, ONO 5334, Z LVG CHN2 and MDL 28170, were found to lack potent inhibitory activity upon 3C‐like protease (3CLpro) and papain‐like protease (PLpro) encoded by SARS-CoV-2 targeting, indicating that antiviral activities are based on inhibition of host proteases (Figure ED8). Z LVG CHN2 targets cysteine proteinases produced by group A streptococci, and has also been shown to suppress herpes simplex virus (HSV) replication by inhibiting the enzymatic activity of HSV-encoded cysteine protease65. Thus, Z LVG CHN2 likely acts through inhibition of an endosomal protease, although its precise cellular target is unknown. MDL 28170 is a cathepsin B inhibitor that also impairs infection by SARS-COV-1 and Ebola virus (EBOV)29,66, ONO 5334 is a cathepsin K inhibitor, and VBY-825 acts as a reversible cathepsin protease inhibitor. Human cysteinyl cathepsins are required for the proteolytic processing of virally encoded proteins during infection67–69, and cathepsin activity is likely required for proper processing of the SARS-CoV-2 S protein within the endosome in order to activate its fusogenic acitivity45. Importantly, ONO 5334 was found to be well tolerated in phase II clinical trials for the treatment of osteoporosis, and development was only discontinued due to an unfavorable competitive landscape70,71.
Figure 4. Apilimod and protease inhibitors block SARS-CoV-2 entry.
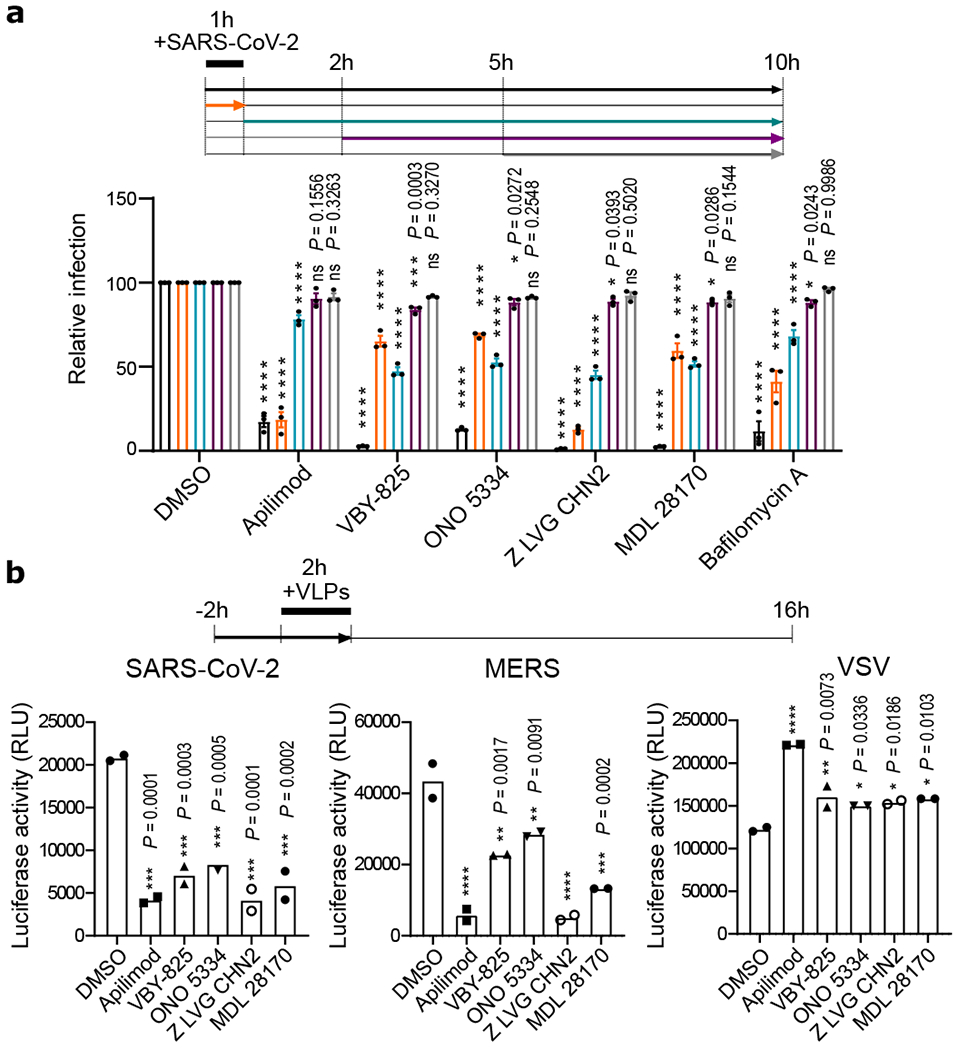
(a) Time-of-addition assay. To synchronize infection, Vero E6 were infected for 1 h with SARS-CoV-2, and the inoculum was then removed. Cells were also incubated with the indicated compound at a concentration of 2.5 μM at timepoints indicated. Infection was quantified 10 hpi after fixation and staining for CoV NP. Data are normalized to the average of DMSO-treated wells for each corresponding time point and are presented as mean ± SEM for n=3 independent experiments. Two-way ANOVA followed by Tukey post-test was performed as statistical analysis. Bafilomycin was used as a positive control. (b) Virus-like particle (VLP) assay. Vero E6 cells were pre-treated for 2 h with the indicated compounds (2.5 μM) and then infected for 2 h with SARS-CoV-2, MERS or VSV pseudotyped particles harboring firefly luciferase (see Materials and Methods). Inoculum was removed after another 2 h, and Firefly Luciferase signal was quantified 24 h post-inoculation. Error bars represent SEM for n=2 independent experiments. One-way ANOVA followed by Dunnett post-test was performed as statistical analysis. * P ≤ 0.05, ** P ≤ 0.01, *** P ≤ 0.001, **** P ≤ 0.0001.
Evaluation in Primary Human Cell Models
ONO 5334, MDL 28170, and apilimod were further evaluated for antiviral activity in human pluripotent stem cell (iPSC) -derived pneumocyte-like cells (see Materials and Methods). Cells were differentiated and then incubated with respective compounds, and challenged with SARS-CoV-2. Treatment with antivirals resulted in a significantly decreased viral replication in these primary cell types. ONO 5334 reduced the number of infected cells by 72 % (Figure 5c), MDL 28170 by 65 % (Figure 5d), while apilimod blocked SARS-CoV-2 challenge by 85 % (Figure 5e; Figure ED9a–c). Finally, we assessed the antiviral activity of apilimod in an ex vivo lung culture system. Briefly, donor lung tissue was infected with SARS-CoV-2 and treated with apilimod or a positive control (remdesivir). Twenty-four hours after viral challenge, RNA from cells were harvested, and viral transcripts were quantified (Figure 5f). Supernatant was also processed at 24 h for quantification of viral titer by plaque assay (Figure 5g).
These data reveal that apilimod potently antagonizes viral replication in tissues that reflect the primary site of SARS-CoV-2 replication. Apilimod is a specific PIKfyve kinase inhibitor and was also found to inhibit viral replication during entry (Figure 4a–b), consistent with observations that PIKfyve predominately resides in early endosomes and plays an essential role in maintenance of endomembrane homeostasis72. Apilimod has been found to be well tolerated in humans, showing a desirable safety profile at doses of ≤ 125 mg BID2,73 and a Cmax of 0.265 +/− 0.183 μM, indicating that therapeutic dosing may be achieved in patients at concentrations likely to promote antiviral activity. Apilimod has been evaluated in phase II clinical trials for the treatment of active Crohn’s disease, rheumatoid arthritis (RA), and common variable immunodeficiency (CVID)2,3, as well as phase I studies for the treatment of follicular lymphoma74. Interestingly, apilimod also efficiently inhibits EBOV, Lassa virus (LASV), and Marburg virus (MARV) in human cell lines, underscoring its potential broad-spectrum antiviral activity23,75. Evaluation of in vivo efficacy in suitable animal models will be highly instructive for the development of this molecule as a COVID-19 therapy.
Discussion
Since the beginning of January 2020, an extraordinary number of investigational programs and clinical trials has been initiated in a concerted effort to identify therapeutics against the rapidly growing COVID-19 pandemic. Critically, remdesivir was recently granted EUA for the treatment of COVID-19 based on data from a clinical trial conducted by NIAID which demonstrated significantly improved time to recovery (47 %) in treated patients76. However, this therapeutic endpoint is far from optimal, and the elucidation of additional candidate therapies would enable the development of combinatorial regimens (“cocktails”), which would reflect the current treatment strategies for HIV-1 and hepatitis C virus (HCV)77–79.
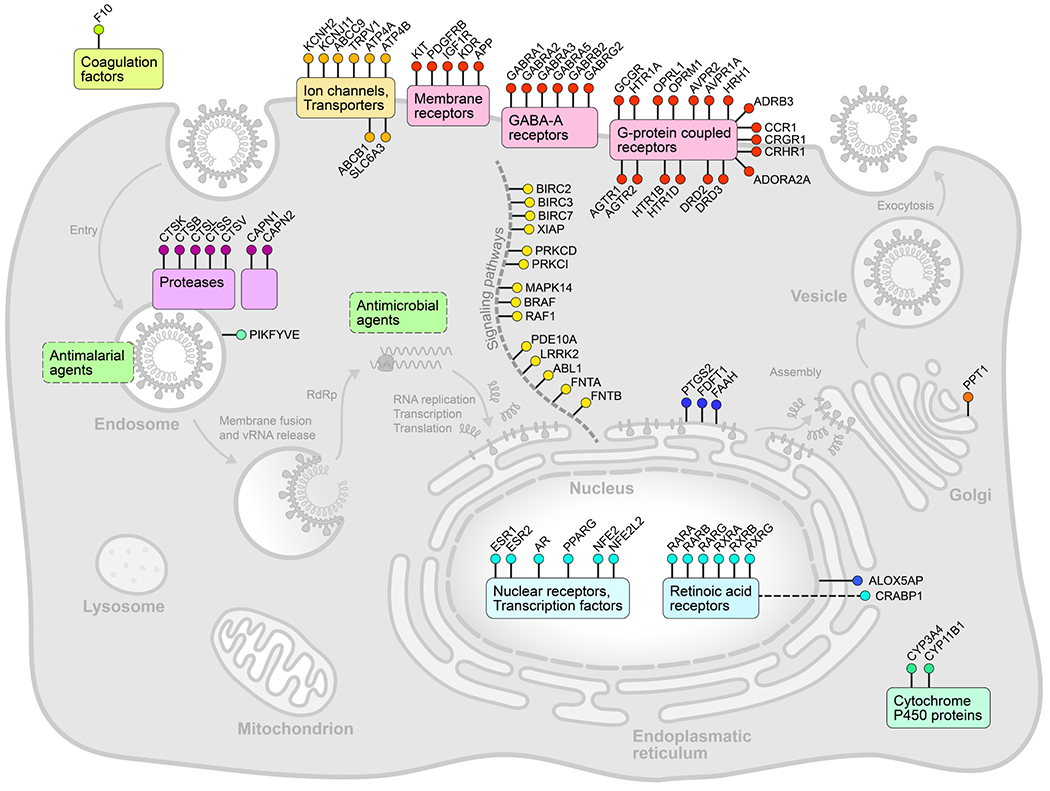
Here, we report the high-throughput analysis of approximately 12,000 known drugs evaluated for activity against SARS-CoV-2 replication, revealing approximately 100 known drugs with antiviral activities (Figure ED10). Based on the known compound mechanisms of action, we extrapolated a cell map of druggable targets, pathways, biological processes and small molecules that modulate the SARS-CoV-2 replication cycle (Figure ED4). Several major target classes were found to be enriched for activity in this analysis, including ion channels, GPCRs, proteases, and kinases (Table S3, Figure 3a). It is important to note that selectivity and off-target activities of the identified compound can vary, and thus observed antiviral activities may derive from either modulation of the annotated drug target, or an off-target activity based on binding to a protein in the same or divergent family. For example, while found that the activities of a RAR agonist could be reversed with the application of a RAR antagonist (Figure 2b), however similar relationships could not be established for several GPCR agonists that were evaluated (Figure ED3b). This is potentially suggestive of off-target activities underlying the antiviral effects of some of these molecules.
We report the identification of 21 molecules, including remdesivir, which were confirmed to possess dose/activity relationships, and 13 of these compounds were found to harbor EC50 values <500 nM in at least one cell line (Figure 3b, 5a–b, ED6c, ED7). The pharmacokinetic properties of each individual compound, including factors such as serum protein binding and bioavailability in the lung, will impact potential in vivo antiviral efficacy. However, in conjunction with safety data from phase I multiple ascending dose studies, as well as reported peak serum concentrations in humans (Cmax), these cellular potencies suggest that many of these known drugs may harbor sufficient antiviral activities during therapeutic administration. To enable prioritization of known drugs for in vivo preclinical and clinical evaluation for the treatment of SARS-CoV-2, a summary of the publicly disclosed and relevant preclinical and clinical properties of the most advanced among these molecules are annotated in Table S4. Thus, the availability of human safety and pharmacological data of clinical-stage molecules is expected to enable rapid preclinical and clinical assessment of these compounds. However, expedited regulatory review under EUA guidelines also provides a rationale for the development of earlier stage candidate molecules that can be deployed for use during the current pandemic outbreak. It is critical that multiple therapeutic options that demonstrate efficacy against SARS-CoV-2 become available to mitigate potential emergence of drug resistance, as well as enable the evaluation of optimal therapeutic cocktails that are broadly curative for COVID-19 disease.
Materials and Methods
Cells and viruses
The SARS-CoV-2 HKU-001a strain was isolated from the nasopharyngeal aspirate specimen of a laboratory-confirmed COVID-19 patient in Hong Kong31. The nasopharyngeal aspirate specimen was inoculated on Vero E6 cells (ATCC® CRL-1586™). The inoculated cells were monitored daily for cytopathic effects by light microscopy and the cell supernatants were collected daily for quantitative RT-PCR (qRT-PCR) to assess the viral load. Significant cytopathic effects were observed at 72 hours post-inoculation (hpi) and positive SARS-CoV-2 replication was confirmed by qRT-PCR using specific primers and probes against SARS-CoV-2. Whole-genome sequencing for the SARS-CoV-2 isolate was done using an Oxford Nanopore MinION device (Oxford Nanopore Technologies, Oxford, UK) supplemented by Sanger sequencing as previously described32. SARS-CoV-2 HKU-001a (GenBank accession number: MT230904) was propagated and titered in VeroE6 cells utilizing plaque assays. The virus was passaged three times before being used for the experiments33. The SARS-CoV-2 USA-WA1/2020 strain, isolated from an oropharyngeal swab from a patient with a respiratory illness who developed clinical disease (COVID-19) in January 2020 in Washington, USA, was obtained from BEI Resources (NR-52281). The virus was inoculated on Vero E6 cells transfected with exogenous human ACE2 and TMPRSS2, collected after one passage and stored at −80 °C in aliquots. Plaque forming unit (PFU) and TCID50 assays were performed to titrate the cultured virus. Vero E6 cells were maintained in Dulbecco’s modified eagle medium (DMEM, Gibco) supplemented with 10 % heat-inactivated fetal bovine serum (FBS, Gibco), 50 U/mL penicillin, 50 μg/mL streptomycin, 1 mM sodium pyruvate (Gibco), 10 mM 4-(2-hydroxyethyl)-1-piperazineethanesulfonic acid (HEPES, Gibco), and 1X MEM non-essential amino acids solution (Gibco). Huh-7 and HEK293T cells stably expressing ACE2 (Huh-7-hACE2/HEK293T-hACE2) were generated by transducing Huh-7 (Apath LLC, Brooklyn) and HEK293T (ATCC®CRL-3216™) cells with ACE2-expressing lentivirus, followed by selection of resistant cells with puromycin (InvivoGen) at 2 μg/ml for 14 days. The resistant cells were maintained in Dulbecco’s modified eagle medium (DMEM, Gibco) supplemented with 10 % heat-inactivated fetal bovine serum (FBS, Gibco), 50 U/mL penicillin, 50 μg/mL streptomycin, and 1 μg/ml puromycin. The expression of ACE2 in these ACE2 stable cell lines was determined by western blot analysis. BHK-21/WI-2 cells (Kerafast, MA) were maintained in Dulbecco’s modified eagle medium (DMEM, Gibco) supplemented with 10 % heat-inactivated fetal bovine serum (FBS, Gibco), 50 U/mL penicillin, 50 μg/mL streptomycin. Cell lines were directly ordered from their distributors and not authenticated. All cells were tested negative for mycoplasma contamination, except for Huh-7-ACE2 cells. All experiments involving live SARS-CoV-2 followed the approved standard operating procedures of the Biosafety Level 3 facility at the University of Hong Kong34 and Sanford Burnham Prebys Medical Discovery Institute.
Chemical libraries
The LOPAC®1280 library is a collection of 1,280 pharmacologically active compounds, covering all the major target classes, including kinases, GPCRs, neurotransmission and gene regulation (Sigma). The ReFRAME (Repurposing, Focused Rescue, and Accelerated Medchem) library, built at the California Institute for Biomedical Research (Calibr)35, contains approximately 12,000 high-value molecules assembled by combining three databases (Clarivate Integrity, GVK Excelra GoStar and Citeline Pharmaprojects) for fast-track drug discovery. This library contains U.S. Food and Drug Administration (FDA)-approved/registered drugs (~35 %), investigational new drugs (~58 %), and preclinical compounds (~3 %).
Drug screening
Compounds from the LOPAC®1280 and ReFRAME libraries were transferred into F-BOTTOM, μCLEAR®, BLACK 384-well plates (Greiner) using an Echo 550 Liquid Handler (Labcyte). All compounds were diluted in culture media to a final concentration of 5 μM during screening. Briefly, Vero E6 cells were seeded in 384-well plates, on top of pre-spotted compounds, at a density of 3,000 cells per well in 40 μl using a microFlo™ select dispenser (BioTek Instruments). Sixteen hours post-seeding, the cells were infected by adding 10 μl of SARS-CoV-2 HKU-001a per well at an MOI of 0.01. Cytopathic effect (CPE) was indirectly quantified as the presence of ATP in live cells by using the CellTiter-Glo (Promega) luminescent cell viability assay at 72 hours post-infection. Data were normalized to the median of each plate. For the ReFRAME library, the Z-score was calculated based on the log2(Fold Change) [log2FC] with the average and standard deviation of each plate. The screen was performed in duplicate by running the assay in parallel for the LOPAC®1280 library or as two independent experiments for the ReFRAME collection. Twenty-eight compounds from the LOPAC®1280 library were selected according to the cutoff of >5*Stdev Log2FC and included in a dose-response confirmation assay. Compounds from the ReFRAME collection were ranked according to their Z-score. The top 100 hits from each replicate were selected (25 overlapping). Seventy-five additional hits were chosen according to their ranking based on the average Z-score. The last 48 hits were selected according to drug target and pathway enrichment analysis. The 298 prioritized hits were included in a dose-response confirmation assay.
Immunofluorescence assay and quantification of SARS-CoV-2 infection
At several points throughout experimentation, infected Vero E6 and human 293T-ACE2 or Huh-7-ACE2 cells were subjected to orthogonal validation using an immunofluorescence-based imaging assay, labeling the viral nucleoproteins (NP) within infected cells. In each assay detailed below, including dose response assays, time-of-addition assay, and drug synergy quantification assay, infected cells were fixed at the indicated time post-infection with 5 % paraformaldehyde (PFA) for 4 hours and permeabilized with 0.5 % Triton X-100 for 5 min. After blocking with 3 % bovine serum albumin (BSA) for 30 min, the cells were incubated for 1 hour at room temperature with rabbit-anti-SARS-CoV-1 NP serum, which exhibits strong cross-reactivity with SARS-CoV-2 NP. After two washes with phosphate-buffered saline (PBS), the cells were incubated with Alexa Fluor 488-conjugated goat-anti-rabbit IgG (Thermo Fisher Scientific, USA) for 1 hour at room temperature. After two additional washes, PBS supplemented with 0.1 μg/ml antifade-4 6-diamidino-2-phenylindole (DAPI) (BioLegend, USA) was added to the cells for at least 30 min before imaging. Images were acquired using the Celigo Image Cytometer (Nexcelom). The assay results and data analysis enabled us to determine infectivity and viability/cytotoxicity. Based on all infectivity and cytotoxicity values, a 4-parameter logistic non-linear regression model was used to calculate EC50 and CC50 concentration values whenever required.
High-throughput orthogonal validation of the primary hits and potency evaluation
The selected hits were further validated by immunofluorescence in an 8-point dose response experiment to determine EC50 and CC50 concentration values. Briefly, 3,000 Vero E6 cells were added into 384-well plates pre-spotted with compounds, in a volume of 40 μl. The final concentration of compound ranged from 1.1 nM to 2.5 μM. Sixteen hours post-seeding, 10 μl of SARS-CoV-2 USA-WA1/2020 were added to each well, at an MOI of 0.75. Twenty-four hours post-infection, cells were fixed and subjected to a cell-based high-content imaging assay to detect SARS-CoV-2 NP within infected cells, as described in the “Immunofluorescence assay and quantification of SARS-CoV-2 infection” section.
Enrichment analysis
Compounds were annotated in the three databases used to assemble the ReFRAME library (Clarivate Integrity, GVK Excelra GoStar and Citeline Pharmaprojects [Informa MOA]) according to a variety of properties, including targets, pathways, indications, and mechanisms of actions (MOA). Each annotation property was tested for enrichment among the screening hits using the gene set enrichment analysis (GSEA) software36,37. The compounds annotated for each property were treated as a “gene set”. For each set of vendor annotations, the background compound set was defined as the set of compounds annotated for any property by that vendor. Enrichment results at P < 0.05 and FDR q-value < 0.33 were defined as significant. Additional enrichment analyses were performed using the free online meta-analysis tool Metascape38 P-values were generated using a one-sided hypergeometric test and values were corrected for multiple hypothesis testing by the Benjamini-Hochberg method38.
Gene expression analysis
Vero E6 cells were either mock-infected or infected with SARS-CoV-2 USA-WA1/2020 (MOI = 0.3). Twenty-four hours after infection, cells were harvested, and total RNA was extracted using the Qiagen® RNeasy® Plus Mini Kit. Three replicates were performed for each group, resulting in a total of six samples. The quality of the extracted RNA was assessed with the Agilent® 2100 Bioanalyzer. Libraries were prepared from total RNA following ribosome RNA depletion using standard protocol according to Illumina®. Total RNA sequencing was then performed on the Illumina® NextSeq system; 150 bp paired-end runs were performed and 100 million raw reads per sample were generated (GEO accession number: GSE153940). STAR39 was used to align the reads to reference the genome of the African green monkey (Chlorocebus sabaeus, https://useast.ensembl.org/Chlorocebus_sabaeus/Info/Annotation), with the SARS-CoV-2 genome (https://www.ncbi.nlm.nih.gov/nuccore/NC_045512), selected as the reference genome. The R package DESeq240 was used for differential expression (DE) analysis between the virus-infected and the control samples. P-values (pval) were computed by DESeq2 with generalized linear models testing for the difference in log-transformed expression values between control and virus-infected samples (i.e. they are essentially two-sided P-values); adjusted P-values (padj) were computed with the Benjamini-Hochberg method. GSEA analysis41 was performed on the DE results using KEGG and Reactome pathway annotations obtained from the MSigDB database42, using the R package fgsea. Empirical P-values (pval) were computed by fgsea using a permutation test (two-sided), and were adjusted (padj) using the Benjamini-Hochberg method. Specifically, this step was performed to check whether the enriched drug-targeting pathways as given in Figure ED3a showed significant enrichment by the GSEA analysis in the virus-infected samples compared to the control. Gene expression analysis on human data was based on a publicly available RNA-seq dataset of nasopharyngeal swab specimens taken from SARS-CoV-2 infected patients43 and a publicly available single-cell RNA-seq dataset consisting of profiled samples from four macro-anatomical locations of human airway epithelium in healthy living volunteers44 (Figure ED5). We used the pre-calculated raw gene counts and inferred cell types from this dataset. For each gene, the fraction of cells with non-zero expression values was calculated in nasal, tracheal, intermediate, and distal samples from multiple donors. Values for each sampling location were averaged across donors. To analyze gene expression levels in different cell types, the fractions of cells with non-zero expression values were determined in all cells of a given cell type across samples. Cell types with a total of less than 250 cells detected were excluded from the analysis. Clustered heat maps were generated in R using the pheatmap and viridis packages.
Time-of-addition assay
Twenty thousand Vero E6 cells were seeded in 96-well plates. The following day, cells were infected with SARS-CoV-2 USA-WA1/2020 (MOI = 1.5). After 1 hour, the viral inoculum was removed and cells were washed with ice-cold PBS, before addition of fresh medium. DMSO vehicle or 2.5 μM of the indicated compound was added at different time points, according to the timeline illustrated in Figure 4a. Cells were fixed at 10 hours post-infection and subjected to an immunofluorescence assay targeting SARS-CoV-2 NP, in order to quantify the percentage of infected cells, as described above in the “Immunofluorescence assay and quantification of SARS-CoV-2 infection” section.
Pseudotyping of VSV and Pseudotype-based inhibition assay
Vesicular Stomatitis Virus (VSV) pseudotyped with spike (S) proteins of MERS and SARS-CoV-2 were generated according to a published protocol45. Briefly, BHK-21/WI-2 cells (Kerafast, MA) transfected to express the S proteins were inoculated with VSV-G pseudotyped ΔG-luciferase VSV (Kerafast, MA). After a 2-hour incubation at 37 °C, the inoculum was removed and DMEM supplemented with 5 % FBS, 50 U/mL penicillin, and 50 μg/mL streptomycin were added back to cells. Pseudotyped particles were collected 24 h post-inoculation, then centrifuged at 1,320×g to remove cell debris and stored at −80 °C until use. To determine the effect of the selected compounds on viral entry, Vero E6 cells were treated with each compound at a concentration of 2.5 μM for 1 h prior to inoculation with respective pseudotyped VSV. After 2 hours inoculation in the presence of the compounds, the inoculum was removed, and fresh medium was added to cells for further culture. The activity of firefly luciferase as a readout of infected cells was measured using the bright-Glo™ luciferase assay (Promega) for quantitative determination at 16 hours post-transduction.
Inhibition of SARS-CoV-2 papain-like protease (PLpro) and main protease (Mpro) and by compounds
SARS-CoV-2 (GenBank accession number: MN908947) PLpro (polyprotein residues 1564-1874) and Mpro (polyprotein residues 3259 to 3569) were expressed and purified from E.coli according to established methods46. Briefly, PLpro was expressed with a N-terminal (His)6-tag and purified by (Ni2+)-affinity chromatography. The (His)6-tag was removed by TEV-protease digestion and then passed over a size-exclusion chromatography column for a final purification step. Mpro was also expressed with a n-terminal (His)6-tag that is removed during expression by an Mpro catalyzed autocleavage reaction. Mpro was purified by a combination of anion-exchange, hydrophobic interaction, and size-exclusion chromatographic steps. SARS-CoV-2 PLpro enzyme inhibition assays were performed in triplicate in Costar 96-well black microplates using the peptide substrate Arg-Leu-Arg-Gly-Gly-AMC (RLRGG-AMC) at a final concentration of 50 μM which is well below the Km value for this substrate which is >1 mM. Assays were performed in buffer composed of 50 mM HEPES, pH 7.5, 0.1 mg/mL BSA, 5 mM DTT and 50 μM RLRGG-AMC substrate in a final assay volume of 100 μL. Selected compounds were included in the assays at varying concentrations ranging from 1 to 50 μM. Compounds GRL-0617 and 3k, known SARS-CoV PLpro inhibitors47,48, were used at a concentration of 50 μM as control inhibitors of SARS-CoV-2. Each of these compounds inhibits SARS-CoV-2 at 95 to 100 % at this concentration. The final concentration of DMSO after the addition of compounds at all concentrations is 1 %. Enzyme reactions were initiated with enzyme (final concentration of ~150 nM) and product formation was monitored over time at an emission wavelength of 460 nm with an excitation wavelength of 360 nm using a CLARIOstar Plus Microplate Reader. Enzyme activity in the absence (zero percent inhibition control) and presence of compounds were used to calculate the percent inhibition at each compound concentration. SARS-CoV-2 Mpro enzyme inhibition assays were performed in triplicate in Costar 3694 EIA/RIA 96-well half-area, flat bottom plates using the UIVT-3 peptide substrate (HiLyte Fluor488™-ESATLQSGLRKAK-QXL520™-NH2) that was custom synthesized by Anaspec. The final concentration of substrate used was 2 μM which is well below the Km of this substrate which is >250 μM. Mpro assays were performed in assay buffer (50 mM HEPES pH 7.50, 0.1 mg/mL bovine serum albumin (BSA), 0.01 % Triton X-100, 2 mM DTT, 1 % DMSO) by preincubating enzyme at a final concentration of 200 nM with inhibitor (1 to 50 μM) for 20 minutes. After this time, the reaction was initiated by adding 20 μL of the UIVT3 substrate. The increase in fluorescence intensity was measured over time at an emission wavelength of 530 nm with an excitation wavelength of 485 nm using a CLARIOstar Plus Microplate Reader. Compound 10, a potent inhibitor of SARS Mpro49, was used as a control inhibitor of SARS-CoV-2 at a concentration of 50 μM. This compound inhibits SARS-CoV-2 at 95 to 100 % under these reaction conditions. Enzyme activity in the absence (zero percent inhibition control) and presence of compounds were used to calculate the percent inhibition at each compound concentration.
Drug Synergy quantification
Four thousand Vero E6 cells were seeded in 384-well plates pre-spotted with indicated compounds, concentration ranging from 0.001 to 2.5 μM in a dose-response manner. Either DMSO vehicle or remdesivir (320 nM, 800 nM or 1,200 nM) was added to the medium. Sixteen hours later, cells were infected with SARS-CoV-2 USA-WA1/2020 (MOI = 0.75). Twenty-four hours post-infection, cells were fixed and an immune-fluorescence assay targeting SARS-CoV-2 NP was performed as described in the “Immunofluorescence assay and quantification of SARS-CoV-2 infection” section. Synergy of drug combinations was assessed using the Bliss independence model50, that predicts that if two drugs DA and DB with experimentally determined fractional effects fA and fB have an additive effect, their expected fractional combinatorial effect is: fAB = fA + fB - (fA x fB).
Validation of antiviral activity in human cell lines
Six thousand ACE2-transduced 293T cells and six thousand ACE2-transduced Huh-7 cells were seeded in 384-well plates, pre-spotted with either a single dose (5 μM) (Figure 5a) or varying doses (final concentration ranging from 0.001 to 2.5 μM) (Figures ED7) of each compound. After 16 hours, cells were infected with SARS-CoV-2 USA-WA1/2020 (MOI = 0.3 and 0.2 respectively). Twenty-four hours post-infection, cells were fixed with 5 % PFA and an immune-fluorescence assay detecting SARS-CoV-2 NP was performed, as described in the section “Immunofluorescence assay and quantification of SARS-CoV-2 infection”.
Validation of antiviral activity in human iPSC-derived pneumocyte-like cells
Human embryonic stem cell lines hPSC1 (H9,WiCell) and hPSC2 (Lis38-derived, kindly provided by Dr. Jacob Hanna, ISM ESCRO Project #14-005) were cultured with mTeSR (STEMCELL Technologies, 85850) on Vitronectin XF (STEMCELL Technologies, 07180) coated tissue culture plates and split in a ratio of 1:6 to 1:12 every four to six days with Versene (Life Technologies, 15040066). When cells were 70-80 % confluent, cells were collected with Gentle dissociation reagent (STEMCELL Technologies, 07174) and 2 million cells per 10 cm2 were plated on Vitronectin coated tissue culture plates in mTeSR. Definitive endoderm differentiation was induced following the protocol described by Jacob et al. (2017)51. Cells were split after 4 days and maturated for 6 more days or further induced to differentiate based on an adapted alveolar differentiation protocol52 in Iscove’s modified Dulbecco’s medium (IMDM, Life Technologies, 31980030) supplemented with 10 % FBS (Sigma, F4135), 2 mM L-glutamine (Life Technologies 25030081), 0.5 μM all-trans-retinoic acid (Sigma, R2626), 10 ng/ml FGF-10 (R&D Systems, 345-FG-025), 10 ng/ml EGF (R&D Systems, 236-EG-01M), 100 ng/ml Wnt3a (R&D Systems, 5036-WN-010), 10 ng/ml KGF (R&D Systems, 251-KG-050) and 5 ng/ml BMP-4 (R&D Systems, 314-BP-010). Viral infections were performed on day 11 of differentiation. DMSO or the indicated compound was added to the medium two hours before infection. ONO-5334 and MDL28170 were tested with hPSC1; VBY-825 and Apilimod were tested with hPSC2 cells at Stage 1 or 2, respectively. Cells were then infected by inoculation with 1×10⁵ PFU of SARS-CoV-2 USA-WA1/2020. Two days post infection cells were harvested for flow cytometry (CoV-NP staining) quantifications. The gating strategy is described in the supplementary Figure S1. An MTT assay was also performed on non-infected samples, in order to assess the cytotoxicity of the compounds.
Validation of antiviral activity in human ex vivo lung tissues
Human lung tissues for ex vivo studies were obtained from patients undergoing surgical operations at Queen Mary Hospital, Hong Kong as previously described53. The donors gave written consent as approved by the Institutional Review Board of the University of Hong Kong/Hospital Authority Hong Kong West Cluster (UW13-364). The freshly obtained lung tissues were processed into small rectangular pieces and were rinsed with advanced DMEM/F12 medium (Gibco, Thermo Fisher Scientific, Waltham, MA, USA) supplemented with 2 mM of HEPES (Gibco), 1×GlutaMAX (Gibco), 100 U/ml penicillin, and 100 μg/ml streptomycin. The specimens were infected with SARS-CoV-2 HKU-001a with an inoculum of 1×10⁶ PFU/ml at 500 μl per well. After two hours, the inoculum was removed, and the specimens were washed 3 times with PBS. The infected human lung tissues were then cultured in 1 ml of advanced DMEM/F12 medium with 2 mM HEPES (Gibco), 1×GlutaMAX (Gibco), 100 U/ml penicillin, 100 μg/ml streptomycin, 20 μg/ml vancomycin, 20 μg/ml ciprofloxacin, 50 μg/ml amikacin, and 50 μg/ml nystatin. Supernatants were collected at 24 hours post-inoculation (hpi) for plaque assays. The lung tissues were harvested at 24 hpi in RLT buffer (Qiagen, Hilden, Germany) with DTT (Qiagen) for quantitative reverse transcription polymerase chain reaction (qRT-PCR) analysis of viral load and normalized by human GAPDH.
Extended Data
Figure ED1. High-throughput repositioning screens for SARS-CoV-2 antivirals.
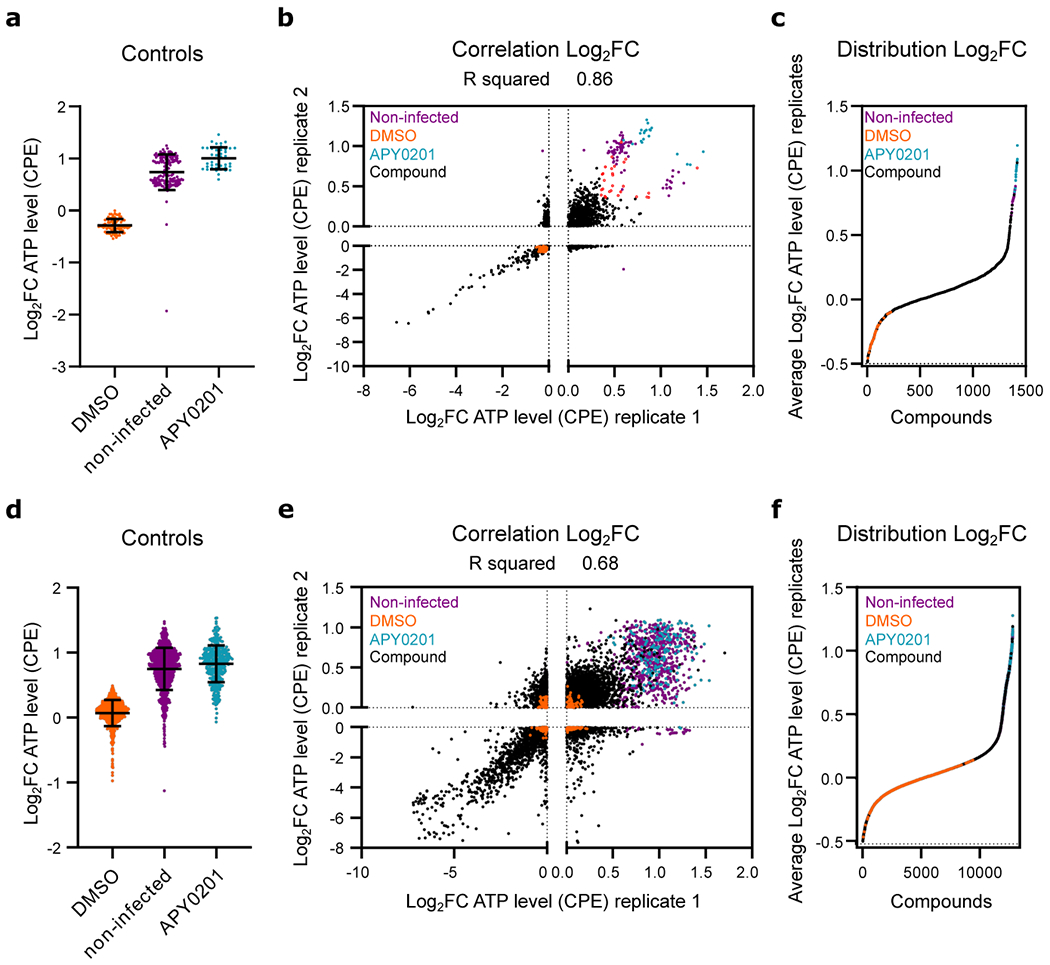
(a-c) Data from preliminary LOPAC®1280 library primary screen. (d-f) Data from ReFRAME collection screen. (a, d) Log2 fold change (Log2FC) of ATP levels after normalization to the median of each plate for SARS-CoV-2 infected all positive (APY0201) and negative (DMSO) controls, as well as for non-infected cells, across all screening plates. Error bars represent mean ± SD for at least n=40 and n=376 (d) independent wells. (b, e) Correlation plot indicating the Log2FC of each compound of two replicate screens. (c, f) Distribution of activities for each compound according to the average of the log2FC of each replicate. Each datapoint indicates the Log2FC average of each drug in screen (black dots). Values corresponding to DMSO (orange dots), APY0201 (cyan dots) and non-infected cells (purple dots) are also represented. Red circles indicate the activities of selected compounds chosen for follow-up for the LOPAC®1280 screens. R squared value indicates the linear correlation coefficient for the replicates of LOPAC®1280 (b) and ReFRAME (e) screens.
Figure ED2. Supplemental GSEA analysis.
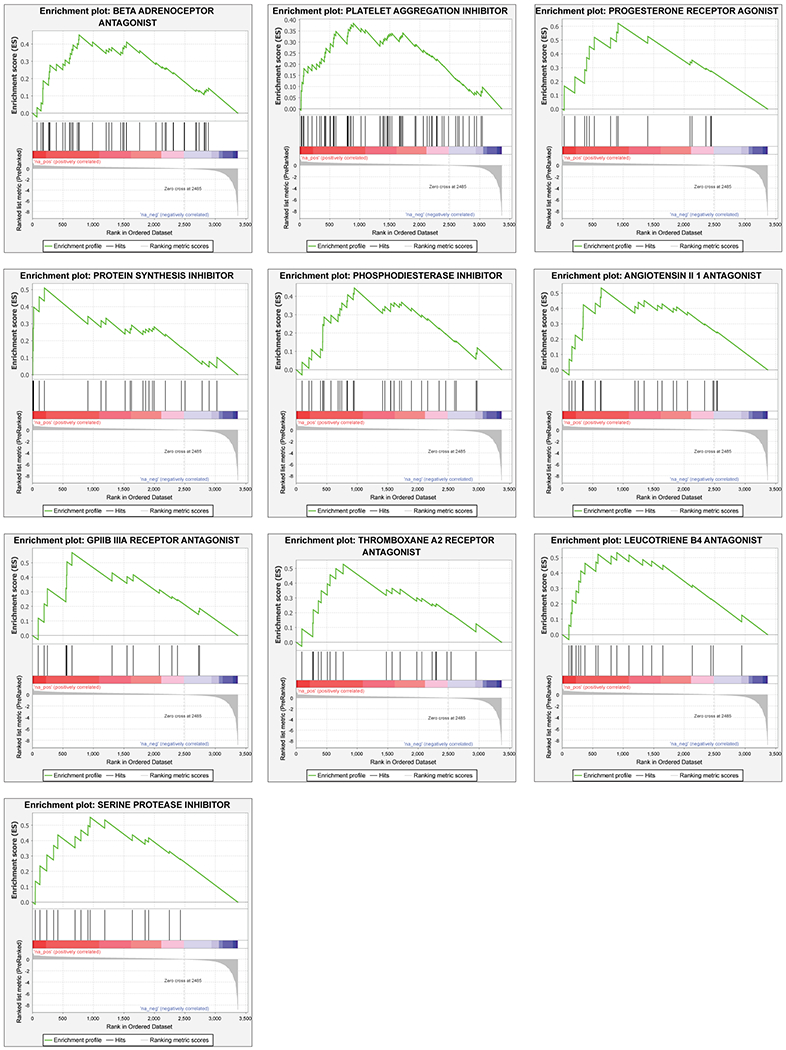
Gene set enrichment analysis (GSEA) of primary screening data according to the average Z′ factor. GSEA enrichment plots of additional ten target classes that were enriched in the primary HTS assay are shown, including beta adrenoreceptor antagonists, platelet aggregation inhibitors, progesterone receptor agonists, protein synthesis inhibitors, phosphodiesterase inhibitors, angiotensin II 1 antagonists, GPIIB IIIA receptor antagonists, thromboxane A2 receptor antagonists, leucotriene B4 antagonists, serine protease inhibitors (P-value < 0.05, FDR q-value < 0.25). Z-scores distributions of compound activities within the screen are depicted below each plot (Ranked list metric). P-values were calculated as indicated in the materials and methods.
Figure ED3. Enriched biological pathways and processes of putative antiviral compound targets.
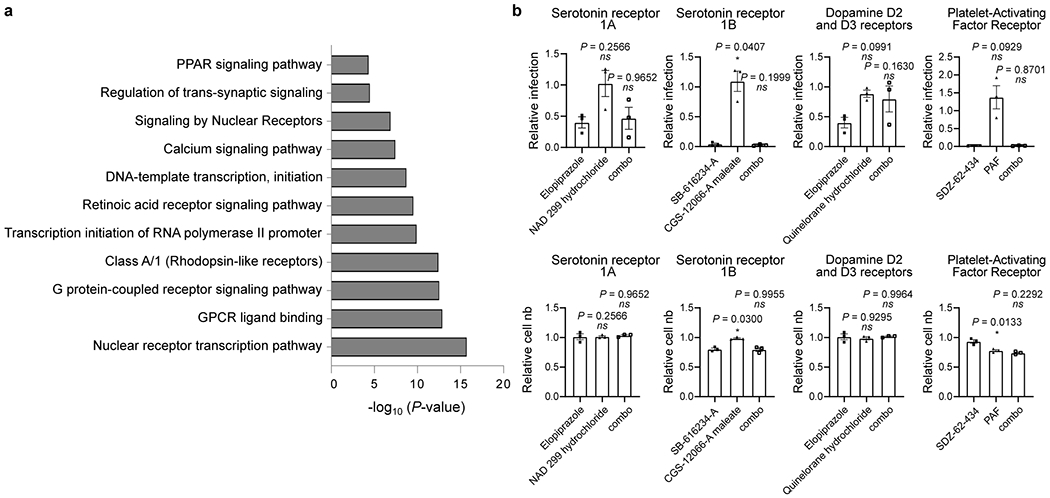
(a) Bar graph of enriched biological pathways and putative proteins targeted by the antiviral compounds identified by HTS analysis. Molecular targets contained within enriched GSEA classes, as well as those of the 326 compounds selected for validation, were assessed for enrichment of pathways and biological function. The x-axis corresponds to -log10(P-value) while the y-axis indicates the enriched terms. The analysis was performed using the online tool Metascape and P-values were calculated as indicated in the materials and methods. (b) Chemical epistasis analysis of GPCR agonists and antagonists on viral replication. Vero E3 cells were treated with antagonists of the serotonin receptor 1A (elopiprazole, 5 μM), serotonin receptor 1B (CGS-12066-A maleate, 2.5 μM), Dopamine D2 and D3 receptors (NAD 299 hydrochloride, 5 μM) and Platelet-Activating Factor (PAF) receptor (SDZ-62-434, 5 μM) and challenged with SARS-CoV-2. Infection was determined in the top panels as described in Figure 3. Similarly, Vero E6 cells where pretreated with an antagonist of the serotonin receptor 1A (quinelorane hydrochloride, 5 μM), serotonin receptor 1B (SB-616234-A, 2.5 μM), Dopamine D2 and D3 receptors (elopiprazole, 5 μM) and Platelet-Activating Factor (PAF) receptor (PAF, 5 μM), either alone or in combination (combo) with the corresponding antagonist (left panel). Cellular toxicity was measured through enumeration of cell numbers (bottom panels). Data are normalized to the average of DMSO-treated wells and represent mean ± SEM for n=3 independent experiments.
Figure ED4. A cellular map of SARS-CoV-2 antiviral targets.
Reported targets or target classes of confirmed SARS-CoV-2 antiviral compounds (Table S1) were mapped to a cell based on known or inferred subcellular localization, function, and potential intersection with the viral life cycle.
Figure ED5. Expression profiles of compound-targeted genes in human airway samples.
Expression profiles of ACE2, TMPRSS2, and indicated targets of putative antiviral compounds identified in the HTS screen was analyzed using previously reported single-cell RNA profiling data from human airway samples of healthy donors. Clustered heat maps show the fraction of gene-expressing cells separated by sampling locations (left panel) or cell type (right panel).
Figure ED6. Cell number and IF relative to dose-response orthogonal validation in Vero E6 cells.
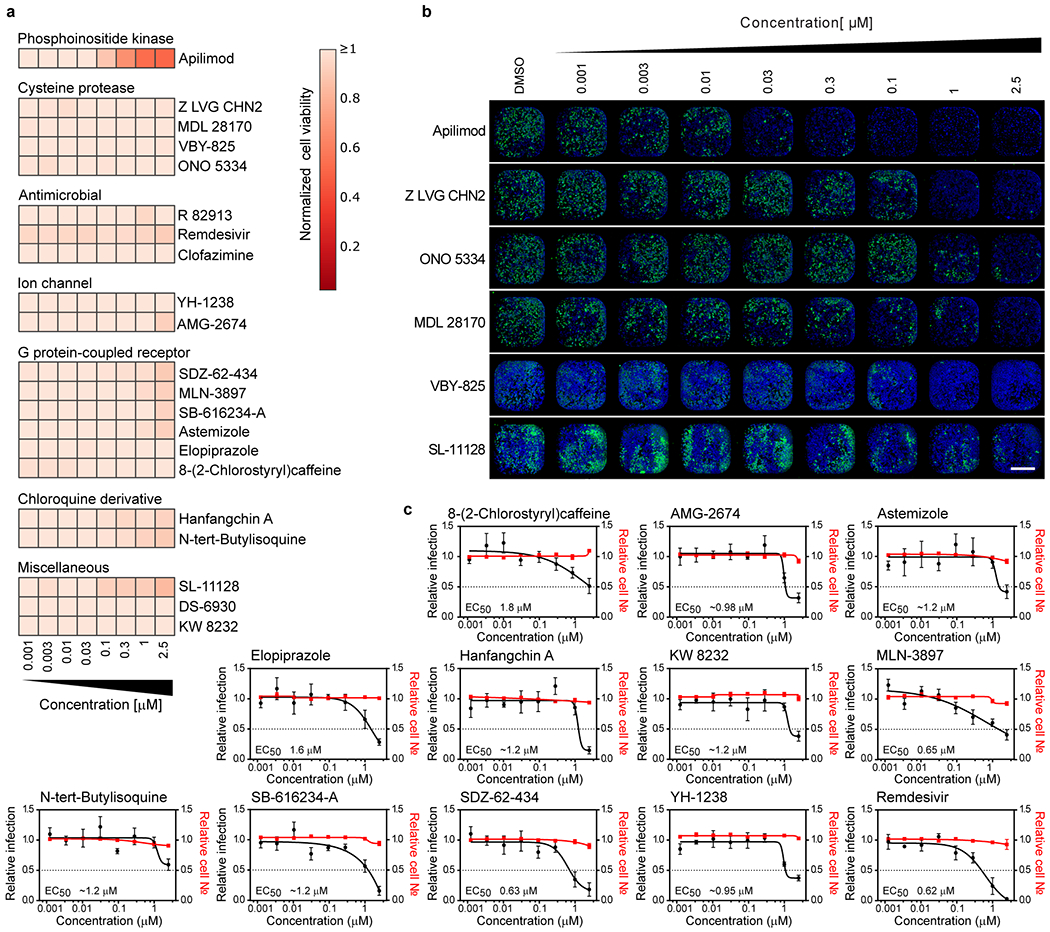
(a) Vero E6 cells were pre-treated for 16 h with increasing concentrations of the indicated compound and then infected with SARS-CoV-2 with MOI = 0.01. 24 h post-infection, cells were fixed, and immunostained, and imaged. For each condition, the total amount of cells stained with DAPI was calculated. Data are normalized to the average of DMSO-treated wells. The heatmap represents the normalized cell number of the indicated 21 compounds in dose-response, on a scale from 0 to 1, on the average of five independent experiments. Compounds are associated in clusters, based on their classification category. Concentrations are rounded. Corresponding antiviral activities of these compounds are shown in Fig. 3A. † Indicated compounds were evaluated at a concentration of 0.85 μM instead of 1 μM. (b) Representative immunofluorescence images corresponding to one of the three dose-responses illustrated in Figure 3. For each condition, the corresponding entire well is shown (4x objective). Scale bar=1.35 mm. (c) Dose-response curves for additional antiviral compounds. Vero E6 cells were pre-treated for 16 h with increasing concentrations of the indicated compound and then infected with SARS-CoV-2 with MOI = 0.01 in the presence of the compound. 24 h post-infection, cells were fixed, and an immunofluorescence was performed. For each condition, the percentage of infection was calculated as the ratio between the number of infected cells stained for CoV NP and the total amount of cells stained with DAPI. Dose-response curves for both infectivity (black) and cell number (red) are shown. Data are normalized to the average of DMSO-treated wells and represent mean ± SEM for n=5 independent experiments. * indicates compounds for which EC50 values were calculated based on observed values at the highest concentrations.
Figure ED7. Dose-response curves of additional antiviral compounds in 293T and Huh-7-ACE2 expressing cells.
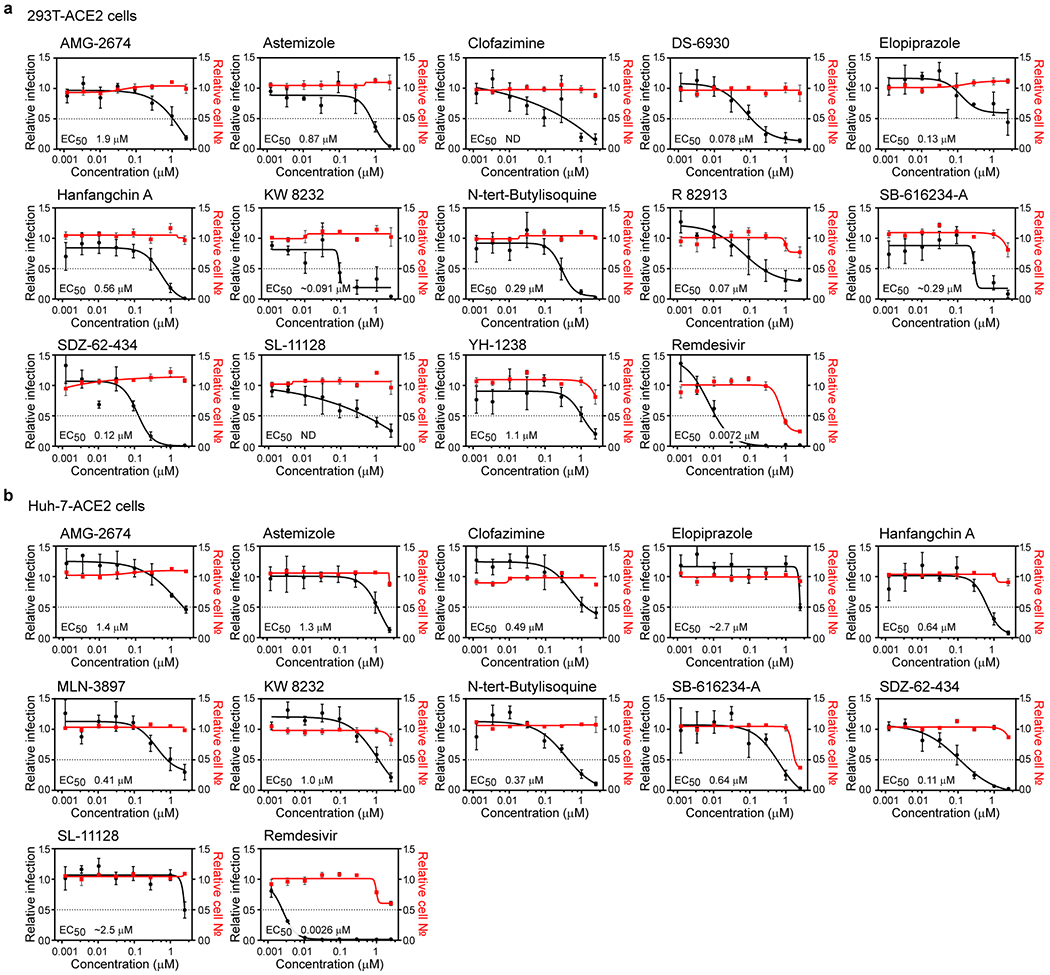
HEK-293T (a) and Huh-7 cells (b), both transduced with ACE2, were pre-treated for 16 h with increasing concentrations of the indicated compound and then infected with SARS-CoV-2 with MOI = 0.3, in the presence of the compound. 24 h post-infection, cells were fixed, and immunostained, followed by imaging. For each condition, the percentage of infection was calculated as the ratio between the number of infected cells stained for CoV NP and the total amount of cells stained with DAPI. Compound concentrations range between 1 nM and 2.5 μM with 3-fold dilutions. Dose-response curves for both infectivity (black) and cell number (red) are shown. Data are normalized to the average of DMSO-treated wells and represent mean ± SEM for n=4 independent experiments. EC50 for each compound was calculated as 4-parameter logistic non-linear regression model and are indicated.
Figure ED8. In vitro protease assay on SARS-CoV-2 papain-like protease (PLpro) and main protease (Mpro).
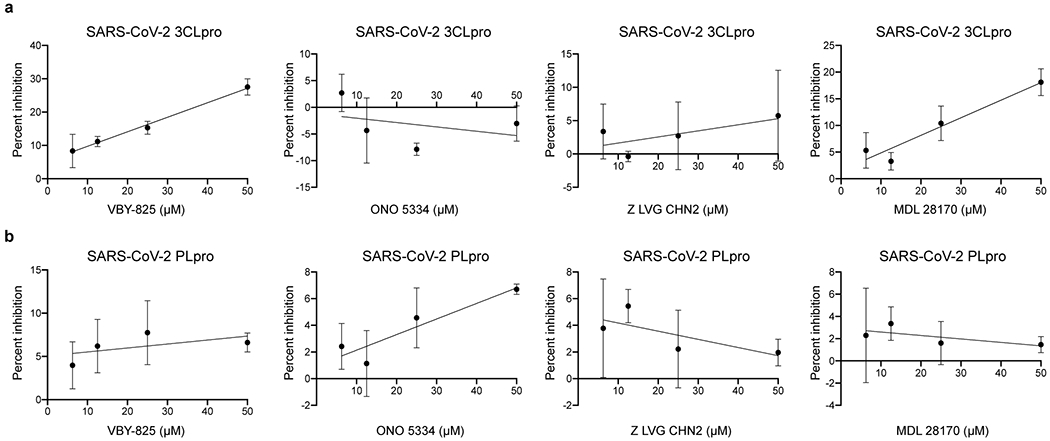
Purified SARS-CoV-2 Mpro (A) and SARS-CoV-2 PLpro (B) enzymes were incubated with varying concentrations of each compound, ranging from 1 to 50 μM. Activity of purified SARS-CoV-2 Mpro and SARS-CoV-2 PLpro enzymes was measured using the UIVT-3 peptide substrate (HiLyte Fluor488TM-ESATLQSGLRKAK-QXL520TM-NH2) and the peptide substrate Arg-Leu-Arg-Gly-Gly-AMC (RLRGG-AMC) respectively. Enzyme activity in the absence (zero percent inhibition control) and presence of compounds were used to calculate the percent inhibition at each compound concentration. Data are presented as mean ±SD for n=3 independent experiments.
Figure ED9. Cell viability in human iPSC-derived pneumocyte-like cells.
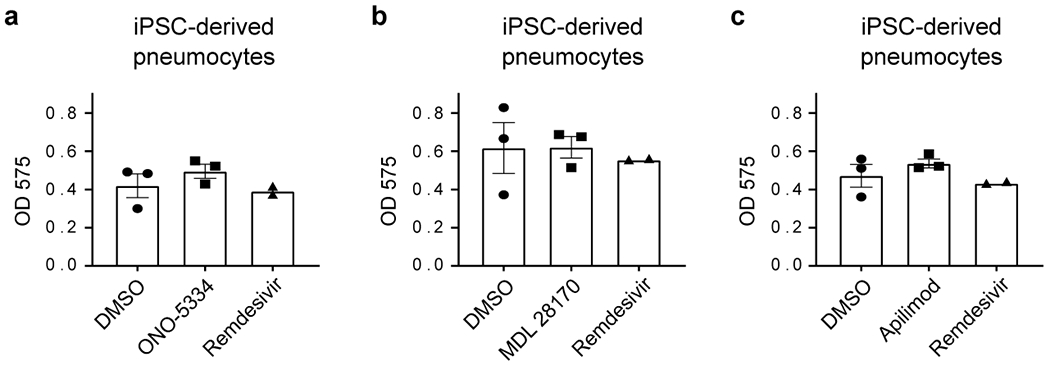
(a-c) MTT assay performed on human iPSC-derived pneumocyte-like cells corresponding to the ones used for infectivity assay in Figure 5c–e. Data represents mean ± SEM for n=3 (DMSO, ONO-5334 (a), MDL 28170 (b) and apilimod (c)) and n=2 (remdesivir) biological replicates.
Figure ED10. Triaging strategy and workflow.
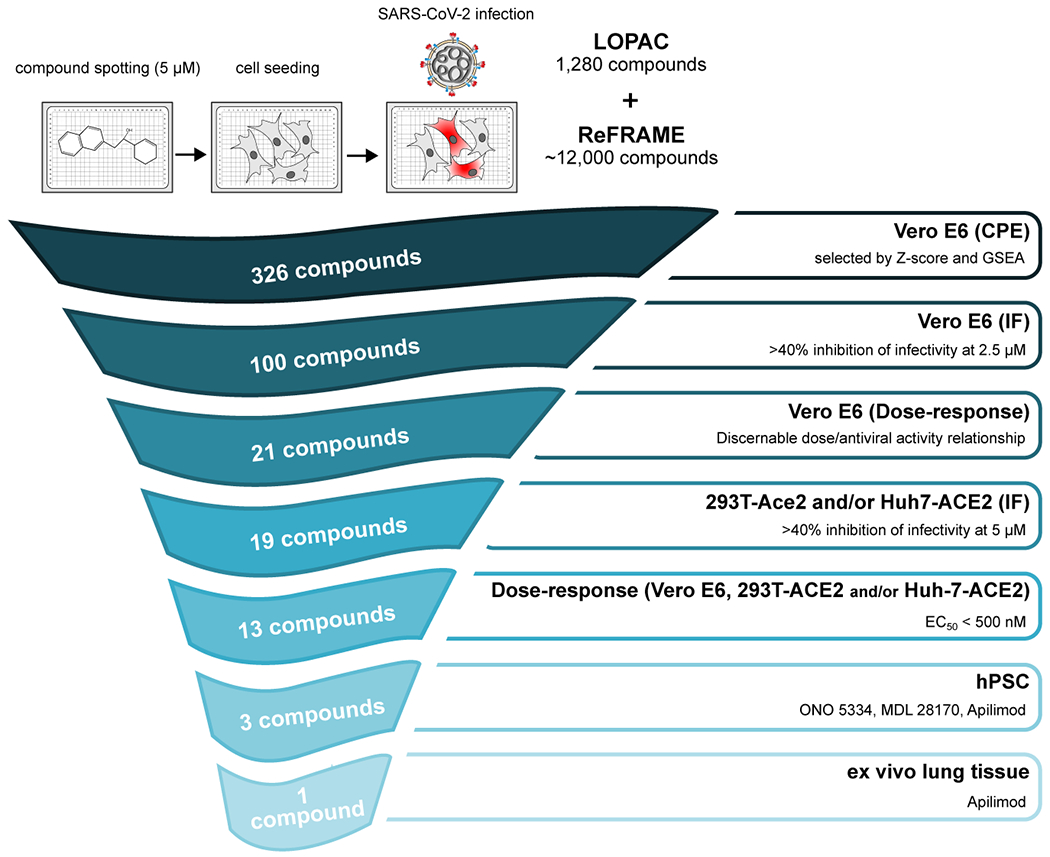
An overview of the down-selection strategy and accompanying selection criteria for the study is shown.
Supplementary Material
Acknowledgments
The following reagent was deposited by the Centers for Disease Control and Prevention and obtained through BEI Resources, NIAID, NIH: SARS-Related Coronavirus 2, Isolate USA-WA1/2020, NR-52281. The authors acknowledge Alan Embry for guidance in securing reagents, Sunnie Yoh for scientific input, Henrietta Nymark-McMahon for manuscript editing, Tara Marathe for copy editing, Sylvie Blondelle and Larry Adelman for facilities and biosafety support, Marisol Chacon for administrative assistance, Wdee Thienphrapa and Heather Curry for literature research support and Rowland Eaden for shipping and delivery assistance. The authors would also like to thank Olivier Harismendy (University of California, San Diego) for advice on data analysis and Brandon Anson and Adam Hamdani in the Mesecar lab for providing samples of SARS-CoV-2 Mpro. This work was supported by the following grants to the Sanford Burnham Prebys Medical Discovery Institute: DoD: W81XWH-20-1-0270; DHIPC: U19 AI118610; Fluomics/NOSI: U19 AI135972, as well as generous philanthropic donations from Dinah Ruch and Susan & James Blair. The work at the University of Hong Kong was partly supported by the donations of Richard Yu and Carol Yu, the Shaw Foundation of Hong Kong, Michael Seak-Kan Tong, and May Tam Mak Mei Yin; and funding from the Health and Medical Research Fund (grant no. COVID190121), the Food and Health Bureau, The Government of the Hong Kong Special Administrative Region; the National Program on Key Research Project of China (grant no. 2020YFA0707500 and 2020YFA0707504); and the Theme-Based Research Scheme (T11/707/15) of the Research Grants Council; Hong Kong Special Administrative Region. Viral protease studies have been funded in part with Federal funds from the National Institute of Allergy and Infectious Diseases, National Institutes of Health, Department of Health and Human Services, under Contract No. HHSN272201700060C to ADM. MEC is supported by an NIH/NIGMS T32 Training Grant for Structural Biology and Biophysics (#GM132024). The work on iPCS-derived pneumocytes was partly supported by the Huffington Foundation. The work at Calibr at Scripps Research was supported by the Bill & Melinda Gates Foundation. This research was also partly funded by CRIP (Center for Research for Influenza Pathogenesis), a NIAID supported Center of Excellence for Influenza Research and Surveillance (CEIRS, contract # HHSN272201400008C), by DARPA grant HR0011-19-2-0020, by an administrative supplement to NIAID grant U19AI142733, and by the generous support of the JPB Foundation, the Open Philanthropy Project (research grant 2020-215611 (5384)) and anonymous donors to AG-S and by supplements to NIAID grant U19AI135972 and DoD grant W81XWH-20-1-0270 to SKC and AG-S. The funding sources had no role in the study design, data collection, analysis, interpretation, or writing of the report. We finally wish thank the late Ananda Mohan Chakrabarty for his generous and inspiring mentorship and advice.
Footnotes
Competing interest statement
JFWC has received travel grants from Pfizer Corporation Hong Kong and Astellas Pharma Hong Kong Corporation Limited and was an invited speaker for Gilead Sciences Hong Kong Limited and Luminex Corporation. The funding sources had no role in study design, data collection, analysis or interpretation or writing of the report. AG-S is inventor in patent applications on antiviral compounds against SARS-CoV-2 unrelated to this study and owned by the Icahn School of Medicine at Mount Sinai. AK-C and SK-C are inventors on a patent application on repurposed antiviral compounds for SARS-CoV-2, and owned by Scripps Research and Sanford Burnham Prebys. U.S. Patent Application Serial No. 63/010630, entitled “METHODS AND COMPOSITIONS FOR ANTIVIRAL TREATMENT,” relates to aspects of this work and was filed on April 15, 2020. The corresponding authors had full access to all the data in the study and had final responsibility for the decision to submit for publication. The other authors declared no conflict of interests.
Data availability
Data is available in the supplemental Tables S1, S2, S3 and S4, and through https://reframedb.org (assay A00440). Complete sequences of SARS-CoV-2 HKU-001a and SARS-CoV-2 USA-WA1/2020 are available through GenBank (accession number MT230904, and MT246667 and MN908947 respectively). RNAseq data in supplementary Table S2 were aligned with the genome of the African green monkey (Chlorocebus sabaeus, https://uswest.ensembl.org/Chlorocebus_sabaeus/Info/Annotation), and with the SARS-CoV-2 genome (https://www.ncbi.nlm.nih.gov/nuccore/NC_045512), selected as the reference genome. The dataset is available on GEO with accession number GSE153940. Figure ED3 derived from the analysis of publicly available single-cell RNA-seq dataset accessible at https://singlecell.broadinstitute.org/single_cell/study/SCP867/hca-lungmap-covid-19-barbry-lung?scpbr=hca-covid-19-integrated-analysis44. Gene expression analysis on human data shown in supplementary Table S2 (GSEA_Mason’s paper) refers to the RNA-seq dataset available at https://www.biorxiv.org/content/10.1101/2020.04.20.048066v54343.
Additional information
Supplementary information includes a Supplementary Discussion, a Supplementary Figure (Figure S1), and Supplementary References.
References
- 1.Yang X et al. Clinical course and outcomes of critically ill patients with SARS-CoV-2 pneumonia in Wuhan, China: a single-centered, retrospective, observational study. Lancet Respir Med, doi: 10.1016/S2213-2600(20)30079-5 (2020). [DOI] [PMC free article] [PubMed] [Google Scholar]
- 2.Sbrissa D, Naisan G, Ikonomov OC & Shisheva A Apilimod, a candidate anticancer therapeutic, arrests not only PtdIns(3,5)P2 but also PtdIns5P synthesis by PIKfyve and induces bafilomycin A1-reversible aberrant endomembrane dilation. PLoS One 13, e0204532–e0204532, doi: 10.1371/journal.pone.0204532 (2018). [DOI] [PMC free article] [PubMed] [Google Scholar]
- 3.Billich A Drug evaluation: apilimod, an oral IL-12/IL-23 inhibitor for the treatment of autoimmune diseases and common variable immunodeficiency. IDrugs : the investigational drugs journal 10, 53–59 (2007). [PubMed] [Google Scholar]
- 4.Cai X et al. PIKfyve, a class III PI kinase, is the target of the small molecular IL-12/IL-23 inhibitor apilimod and a player in Toll-like receptor signaling. Chem Biol 20, 912–921, doi: 10.1016/j.chembiol.2013.05.010 (2013). [DOI] [PMC free article] [PubMed] [Google Scholar]
- 5.World_Health_Organization. https://www.who.int/emergencies/diseases/novel-coronavirus-2019, 2020). [Google Scholar]
- 6.Chen WH, Strych U, Hotez PJ & Bottazzi ME The SARS-CoV-2 Vaccine Pipeline: an Overview. Current tropical medicine reports, 1–4, doi: 10.1007/s40475-020-00201-6 (2020). [DOI] [PMC free article] [PubMed] [Google Scholar]
- 7.Cascella M, Rajnik M, Cuomo A, Dulebohn SC & Di Napoli R in StatPearls (StatPearls Publishing StatPearls Publishing LLC., 2020). [Google Scholar]
- 8. ClinicalTrials.gov. https://clinicaltrials.gov/ct2/results?cond=COVID-19&term=kaletra&cntry=&state=&city=&dist=&Search=Search. [Google Scholar]
- 9.Chen H et al. First Clinical Study Using HCV Protease Inhibitor Danoprevir to Treat Naive and Experienced COVID-19 Patients. medRxiv, 2020.2003.2022.20034041, doi: 10.1101/2020.03.22.20034041 (2020). [DOI] [PMC free article] [PubMed] [Google Scholar]
- 10. ClinicalTrials.gov. https://clinicaltrials.gov/ct2/results?cond=COVID-19&term=favipiravir&cntry=&state=&city=&dist=&Search=Search. [Google Scholar]
- 11.Warren TK et al. Therapeutic efficacy of the small molecule GS-5734 against Ebola virus in rhesus monkeys. Nature 531, 381–385, doi: 10.1038/nature17180 (2016). [DOI] [PMC free article] [PubMed] [Google Scholar]
- 12.US_Food_And_Drug_Administration. https://www.fda.gov/news-events/press-announcements/coronavirus-covid-19-update-fda-issues-emergency-use-authorization-potential-covid-19-treatment. [Google Scholar]
- 13.Wang Y et al. Remdesivir in adults with severe COVID-19: a randomised, double-blind, placebo-controlled, multicentre trial. Lancet 395, 1569–1578, doi: 10.1016/S0140-6736(20)31022-9 (2020). [DOI] [PMC free article] [PubMed] [Google Scholar]
- 14.Janes J et al. The ReFRAME library as a comprehensive drug repurposing library and its application to the treatment of cryptosporidiosis. Proc Natl Acad Sci U S A 115, 10750–10755, doi: 10.1073/pnas.1810137115 (2018). [DOI] [PMC free article] [PubMed] [Google Scholar]
- 15.Kim YJ et al. The ReFRAME library as a comprehensive drug repurposing library to identify mammarenavirus inhibitors. Antiviral Res 169, 104558, doi: 10.1016/j.antiviral.2019.104558 (2019). [DOI] [PMC free article] [PubMed] [Google Scholar]
- 16.Harbut MB et al. Auranofin exerts broad-spectrum bactericidal activities by targeting thiol-redox homeostasis. Proc Natl Acad Sci U S A 112, 4453–4458, doi: 10.1073/pnas.1504022112 (2015). [DOI] [PMC free article] [PubMed] [Google Scholar]
- 17.Love MS et al. A high-throughput phenotypic screen identifies clofazimine as a potential treatment for cryptosporidiosis. PLoS Negl Trop Dis 11, e0005373, doi: 10.1371/journal.pntd.0005373 (2017). [DOI] [PMC free article] [PubMed] [Google Scholar]
- 18.Bollong MJ et al. Small molecule-mediated inhibition of myofibroblast transdifferentiation for the treatment of fibrosis. Proc Natl Acad Sci U S A 114, 4679–4684, doi: 10.1073/pnas.1702750114 (2017). [DOI] [PMC free article] [PubMed] [Google Scholar]
- 19.Li YY & Jones SJ Drug repositioning for personalized medicine. Genome Med 4, 27, doi: 10.1186/gm326 (2012). [DOI] [PMC free article] [PubMed] [Google Scholar]
- 20.Matsuyama S et al. Enhanced isolation of SARS-CoV-2 by TMPRSS2-expressing cells. Proc Natl Acad Sci U S A 117, 7001–7003, doi: 10.1073/pnas.2002589117 (2020). [DOI] [PMC free article] [PubMed] [Google Scholar]
- 21.Park WB et al. Virus Isolation from the First Patient with SARS-CoV-2 in Korea. J Korean Med Sci 35, e84, doi: 10.3346/jkms.2020.35.e84 (2020). [DOI] [PMC free article] [PubMed] [Google Scholar]
- 22.To KK et al. Consistent detection of 2019 novel coronavirus in saliva. Clin Infect Dis, doi: 10.1093/cid/ciaa149 (2020). [DOI] [PMC free article] [PubMed] [Google Scholar]
- 23.Nelson EA et al. The phosphatidylinositol-3-phosphate 5-kinase inhibitor apilimod blocks filoviral entry and infection. PLoS Negl Trop Dis 11, e0005540, doi: 10.1371/journal.pntd.0005540 (2017). [DOI] [PMC free article] [PubMed] [Google Scholar]
- 24.Qiu S et al. Ebola virus requires phosphatidylinositol (3,5) bisphosphate production for efficient viral entry. Virology 513, 17–28, doi: 10.1016/j.virol.2017.09.028 (2018). [DOI] [PubMed] [Google Scholar]
- 25.Yamamoto N et al. HIV protease inhibitor nelfinavir inhibits replication of SARS-associated coronavirus. Biochemical and biophysical research communications 318, 719–725, doi: 10.1016/j.bbrc.2004.04.083 (2004). [DOI] [PMC free article] [PubMed] [Google Scholar]
- 26.Shweta C, Yashpal SM, & Shailly T Identification of SARS-CoV-2 Cell Entry Inhibitors by Drug Repurposing Using in Silico Structure-Based Virtual Screening Approach. (2020). [DOI] [PMC free article] [PubMed] [Google Scholar]
- 27.Zhijian X et al. Nelfinavir Is Active Against SARS-CoV-2 in Vero E6 Cells. (2020). [Google Scholar]
- 28.Wang SQ et al. Virtual screening for finding natural inhibitor against cathepsin-L for SARS therapy. Amino Acids 33, 129–135, doi: 10.1007/s00726-006-0403-1 (2007). [DOI] [PMC free article] [PubMed] [Google Scholar]
- 29.Schneider M et al. Severe acute respiratory syndrome coronavirus replication is severely impaired by MG132 due to proteasome-independent inhibition of M-calpain. Journal of virology 86, 10112–10122, doi: 10.1128/jvi.01001-12 (2012). [DOI] [PMC free article] [PubMed] [Google Scholar]
- 30.Subramanian A et al. Gene set enrichment analysis: A knowledge-based approach for interpreting genome-wide expression profiles. Proceedings of the National Academy of Sciences 102, 15545–15550, doi: 10.1073/pnas.0506580102 (2005). [DOI] [PMC free article] [PubMed] [Google Scholar]
- 31.To KK et al. Consistent detection of 2019 novel coronavirus in saliva. Clin Infect Dis, doi: 10.1093/cid/ciaa149 (2020). [DOI] [PMC free article] [PubMed] [Google Scholar]
- 32.Chan JF et al. A familial cluster of pneumonia associated with the 2019 novel coronavirus indicating person-to-person transmission: a study of a family cluster. Lancet 395, 514–523, doi: 10.1016/s0140-6736(20)30154-9 (2020). [DOI] [PMC free article] [PubMed] [Google Scholar]
- 33.Chu H et al. Comparative tropism, replication kinetics, and cell damage profiling of SARS-CoV-2 and SARS-CoV with implications for clinical manifestations, transmissibility, and laboratory studies of COVID-19: an observational study. The Lancet Microbe 1, e14–e23, doi: 10.1016/S2666-5247(20)30004-5 (2020). [DOI] [PMC free article] [PubMed] [Google Scholar]
- 34.Yuan S et al. SREBP-dependent lipidomic reprogramming as a broad-spectrum antiviral target. Nat Commun 10, 120, doi: 10.1038/s41467-018-08015-x (2019). [DOI] [PMC free article] [PubMed] [Google Scholar]
- 35.Janes J et al. The ReFRAME library as a comprehensive drug repurposing library and its application to the treatment of cryptosporidiosis. Proc Natl Acad Sci U S A 115, 10750–10755, doi: 10.1073/pnas.1810137115 (2018). [DOI] [PMC free article] [PubMed] [Google Scholar]
- 36.Subramanian A et al. Gene set enrichment analysis: A knowledge-based approach for interpreting genome-wide expression profiles. Proceedings of the National Academy of Sciences 102, 15545–15550, doi: 10.1073/pnas.0506580102 (2005). [DOI] [PMC free article] [PubMed] [Google Scholar]
- 37.Mootha VK et al. PGC-1α-responsive genes involved in oxidative phosphorylation are coordinately downregulated in human diabetes. Nature Genetics 34, 267–273, doi: 10.1038/ng1180 (2003). [DOI] [PubMed] [Google Scholar]
- 38.Zhou Y et al. Metascape provides a biologist-oriented resource for the analysis of systems-level datasets. Nat Commun 10, 1523, doi: 10.1038/s41467-019-09234-6 (2019). [DOI] [PMC free article] [PubMed] [Google Scholar]
- 39.Dobin A et al. STAR: ultrafast universal RNA-seq aligner. Bioinformatics 29, 15–21, doi: 10.1093/bioinformatics/bts635 (2013). [DOI] [PMC free article] [PubMed] [Google Scholar]
- 40.Love MI, Huber W & Anders S Moderated estimation of fold change and dispersion for RNA-seq data with DESeq2. Genome Biol 15, 550, doi: 10.1186/s13059-014-0550-8 (2014). [DOI] [PMC free article] [PubMed] [Google Scholar]
- 41.Subramanian A et al. Gene set enrichment analysis: a knowledge-based approach for interpreting genome-wide expression profiles. Proc Natl Acad Sci U S A 102, 15545–15550, doi: 10.1073/pnas.0506580102 (2005). [DOI] [PMC free article] [PubMed] [Google Scholar]
- 42.Liberzon A et al. Molecular signatures database (MSigDB) 3.0. Bioinformatics 27, 1739–1740, doi: 10.1093/bioinformatics/btr260 (2011). [DOI] [PMC free article] [PubMed] [Google Scholar]
- 43.Butler DJ et al. Host, Viral, and Environmental Transcriptome Profiles of the Severe Acute Respiratory Syndrome Coronavirus 2 (SARS-CoV-2). bioRxiv, 20202004.2020.048066, doi: 10.1101/2020.04.20.048066 (2020). [DOI] [Google Scholar]
- 44.Deprez M et al. A single-cell atlas of the human healthy airways. bioRxiv, 2019.2012.2021.884759, doi: 10.1101/2019.12.21.884759 (2019). [DOI] [PubMed] [Google Scholar]
- 45.Whitt MA Generation of VSV pseudotypes using recombinant DeltaG-VSV for studies on virus entry, identification of entry inhibitors, and immune responses to vaccines. J Virol Methods 169, 365–374, doi: 10.1016/j.jviromet.2010.08.006 (2010). [DOI] [PMC free article] [PubMed] [Google Scholar]
- 46.Anson BJ et al. Broad-spectrum inhibition of coronavirus main and papain-like proteases by HCV drugs. doi: 10.21203/rs.3.rs-26344/v1+. [DOI] [Google Scholar]
- 47.Ratia K et al. A noncovalent class of papain-like protease/deubiquitinase inhibitors blocks SARS virus replication. Proc Natl Acad Sci U S A 105, 16119–16124, doi: 10.1073/pnas.0805240105 (2008). [DOI] [PMC free article] [PubMed] [Google Scholar]
- 48.Baez-Santos YM et al. X-ray structural and biological evaluation of a series of potent and highly selective inhibitors of human coronavirus papain-like proteases. J Med Chem 57, 2393–2412, doi: 10.1021/jm401712t (2014). [DOI] [PMC free article] [PubMed] [Google Scholar]
- 49.Ghosh AK et al. Design, synthesis and antiviral efficacy of a series of potent chloropyridyl ester-derived SARS-CoV 3CLpro inhibitors. Bioorg Med Chem Lett 18, 5684–5688, doi: 10.1016/j.bmcl.2008.08.082 (2008). [DOI] [PMC free article] [PubMed] [Google Scholar]
- 50.BLISS CI THE TOXICITY OF POISONS APPLIED JOINTLY1. Annals of Applied Biology 26, 585–615, doi: 10.1111/j.1744-7348.1939.tb06990.x (1939). [DOI] [Google Scholar]
- 51.Jacob A et al. Derivation of self-renewing lung alveolar epithelial type II cells from human pluripotent stem cells. Nature Protocols 14, 3303–3332, doi: 10.1038/s41596-019-0220-0 (2019). [DOI] [PMC free article] [PubMed] [Google Scholar]
- 52.Ghaedi M et al. Human iPS cell–derived alveolar epithelium repopulates lung extracellular matrix. The Journal of Clinical Investigation 123, 4950–4962, doi: 10.1172/JCI68793 (2013). [DOI] [PMC free article] [PubMed] [Google Scholar]
- 53.Chu H et al. Comparative replication and immune activation profiles of SARS-CoV-2 and SARS-CoV in human lungs: an ex vivo study with implications for the pathogenesis of COVID-19. Clin Infect Dis, doi: 10.1093/cid/ciaa410 (2020). [DOI] [PMC free article] [PubMed] [Google Scholar]
Associated Data
This section collects any data citations, data availability statements, or supplementary materials included in this article.


