

Abstract
The intestinal microbiota has been linked to the development and prevalence of steatohepatitis in humans. Interestingly, steatohepatitis is significantly lower in individuals taking a plant‐based, low‐animal‐protein diet, which is thought to be mediated by gut microbiota. However, data on causality between these observations in humans is scarce. In this regard, fecal microbiota transplantation (FMT) using healthy donors is safe and is capable of changing microbial composition in human disease. We therefore performed a double‐blind randomized controlled proof‐of‐principle study in which individuals with hepatic steatosis on ultrasound were randomized to two study arms: lean vegan donor (allogenic n = 10) or own (autologous n = 11) FMT. Both were performed three times at 8‐week intervals. A liver biopsy was performed at baseline and after 24 weeks in every subject to determine histopathology (Nonalcoholic Steatohepatitis Clinical Research Network) classification and changes in hepatic gene expression based on RNA sequencing. Secondary outcome parameters were changes in intestinal microbiota composition and fasting plasma metabolomics. We observed a trend toward improved necro‐inflammatory histology, and found significant changes in expression of hepatic genes involved in inflammation and lipid metabolism following allogenic FMT. Intestinal microbial community structure changed following allogenic FMT, which was associated with changes in plasma metabolites as well as markers of . Conclusion: Allogenic FMT using lean vegan donors in individuals with hepatic steatosis shows an effect on intestinal microbiota composition, which is associated with beneficial changes in plasma metabolites and markers of steatohepatitis.
Abbreviations
- ALP
alkaline phosphatase
- AST
aspartate aminotransferase
- BMI
body mass index
- CRP
C‐reactive protein
- FMT
fecal microbiota transplantation
- GGT
gamma‐glutamyltransferase
- HDL‐C
high‐density lipoprotein cholesterol
- IFN1
type I interferon signaling
- LDL‐C
low‐density lipoprotein cholesterol
- NAFLD
nonalcoholic fatty liver disease
- NAS
NAFLD activity score
- SDS
serine dehydratase
- T2DM
type 2 diabetes
What is already known about this subject?
Gut microbiota are involved in human health and (metabolic) disease;
Changes in fecal microbiota are associated with hepatic steatosis; and
Animal studies have suggested that fecal transplantation can alter steatohepatitis.
What are the new findings?
Fecal microbiota transplantation (FMT) from vegan lean donors improves histological (necro‐inflammation score) and liver gene expression in liver biopsies of subjects with steatohepatitis;
These differential changes are accompanied by alterations in plasma metabolites and fecal microbiota composition; and
New correlations between changes in microbiota strains and plasma metabolites in relation to liver gene expression and histology in human steatohepatitis are observed.
How might it affect clinical practice in the foreseeable future?
This study helps to quantify the magnitude of gut microbiota–driven effects on human steatohepatitis using FMT; and
This study provides sample sizes for future trials and underscores that dietary intake plays a role in gut microbiota function and subsequent development of metabolic complications like steatohepatitis.
As a consequence of the pandemic spread of obesity and type 2 diabetes (T2DM), nonalcoholic fatty liver disease (NAFLD) is now recognized as the most prevalent chronic liver disease worldwide.( 1 ) NAFLD represents a spectrum of liver disease, with clinical and histological abnormalities ranging from simple steatosis (nonalcoholic fatty liver) to nonalcoholic steatohepatitis (NASH), with the latter being diagnosed when the liver biopsy shows hepatocyte ballooning and inflammation, in addition to steatosis. The current estimated global prevalence of NAFLD is 25%‐30% and reaching staggering numbers up to 80% in individuals with metabolic syndrome and T2DM.( 1 ) Although it has been showed that individuals with NAFLD can progress toward NASH,( 2 , 3 ) the presence of steatosis has little prognostic value for disease development.( 4 ) Increasing evidence suggests that disease activity, also known as the necro‐inflammation score (i.e., inflammation and hepatocyte ballooning), independent of steatosis is clinically the most relevant parameter of NAFLD.( 5 , 6 ) This relatively new concept in steatohepatitis describes and measures inflammation and liver cell injury and builds on the evidence that disease activity is highly associated with fibrosis progression.( 5 , 6 ) Similarly, individuals with a high necro‐inflammation score, thus high active inflammation, have a considerably higher risk of developing hepatic (cirrhosis, hepatocellular carcinoma, liver transplantation) and extrahepatic (primarily atherosclerotic cardiovascular) complications.( 1 ) As annual medical costs directly attributable to NAFLD keep increasing per year, this underscores the need of interventions to alleviate or even prevent an adverse disease course.( 1 , 7 )
In search of potential new and effective treatment options, the gut microbiome has gained a lot of interest, primarily based on human observational studies and animal experiments. Indeed, alterations in gut microbial composition have frequently been observed in individuals with NAFLD.( 8 , 9 , 10 ) Accordingly, alterations in plasma metabolites derived from gut microbiota as well as from diet have been linked to NAFLD development.( 9 ) Compared with omnivorous diets, plant‐based low‐animal‐protein diets, as practiced by vegans, are associated with reduced NAFLD incidence.( 11 ) Compared with omnivores, vegans have an altered gut microbiota composition( 12 ) with concomitant alterations in plasma metabolites such as carnitine derivatives.( 13 ) This has previously been linked to a lower incidence of NAFLD in Chinese( 14 ) and Western subjects.( 11 ) Although causality of these gut microbiota alterations on liver disease has been suggested in mice, in humans this remains to be elucidated. To find the cause‐and‐effect relations between the gut microbiome and human disease in general, feces from affected individuals have been transplanted into rodents.( 15 ) Interestingly, in a recent systematic review, it was shown that 95% of published studies described the successful transfer of the pathological phenotype of human NAFLD into rodents, indicative of substantial publication bias, as many studies were underpowered.( 16 ) Combined with the complexity of causal relations, these findings suggest that this high success rate of interspecies transferable pathologies overestimates the role of the gut microbiome in human disease.( 16 ) Lessons from studies performing fecal microbiota transplantation (FMT) in humans have shown that FMT is relatively safe when performed in a clinical setting and capable of changing gut microbial composition with concomitant (modest) effects on human metabolism. For example, transfer of healthy donor feces was found to improve insulin sensitivity, alter short chain fatty acid production, and affect plasma metabolite levels in individuals with metabolic syndrome.( 17 ) Nevertheless, not all FMTs change the metabolic traits or microbiota composition in treated individuals,( 17 ) and the effect appears to be modulated by the donor’s metabolic status as well as the recipient’s microbiota composition.( 18 ) This underscores the complexity of the relation among human diet, metabolism, composition, and function of the gut microbiome in relation to cardiometabolic diseases and NAFLD. It also suggests that (diet‐specific) personal characteristics of both donor and acceptor determine the individual’s response following donor FMT.( 19 ) To date, dissecting the causality of intestinal microbiota in NAFLD using FMT from donors on a plant‐based, low‐animal‐protein diet has not been performed. Therefore, the aim of our pilot randomized controlled trial study was to investigate a potential causal role of intestinal microbiota on NAFLD in humans.
Methods
Design
This study was a single‐center, double‐blind, randomized controlled proof‐of‐principle pilot study comparing the effect of three 8‐weekly lean vegan donor FMT versus autologous FMT on the severity of NAFLD, using liver biopsies in individuals with hepatic steatosis on ultrasound (Supporting Fig. S1). The study was conducted in the Amsterdam University Medical Centers, located at the Academic Medical Center (AMC METC 2013_207), in compliance with the principles of the declaration of Helsinki and CONSORT guidelines. The protocol was reviewed and approved by the institutional review board of the AMC, and was registered in the Dutch Trial Register (registration number NTR4339). All participants provided written, informed consent.
Participants and Donors
Caucasian, overweight, treatment‐naïve, omnivorous individuals with hepatic steatosis on ultrasound were included. The main inclusion criteria were age 21‐69 years, male or postmenopausal female, body mass index (BMI) > 25 kg/m2 with hepatic steatosis on previous ultrasound with suspicion of NAFLD (based on elevated liver enzymes, impaired glucose tolerance, and severity of steatosis on ultrasound). Exclusion criteria were any history of cardiovascular disease, T2DM, renal disease, cholecystectomy, or compromised immunity; use of proton‐pump inhibitors, antibiotics, or anticoagulants in the past 3 months; any current use of medication; a history of moderate to heavy alcohol use (>12 g per day); or other causes of liver disease besides NAFLD (e.g., hemochromatosis, auto‐immune hepatitis, cirrhosis, hepatitis B or C, hemochromatosis, alpha‐1 antitrypsin deficiency, alcoholic liver disease). None of the participants underwent bariatric surgery. Fecal donors were healthy, lean (BMI < 25 kg/m2), treatment‐naïve, male or female Caucasian individuals on a stable (>3 months) plant‐based low‐animal‐protein (vegan) diet. They completed questionnaires on dietary and bowel habits, travel history, and comorbidity, including family history of diabetes mellitus and medication use. Donors were screened for the presence of infectious diseases as recommended.( 18 , 19 )
Study Visits
All participants were advised to retain their usual dietary habits during the study and were asked to fill out an online nutritional diary for the duration of 1 week before the baseline visit and the 24‐week visit to monitor caloric intake including total calories, dietary carbohydrates, fat, proteins, and fibers. Blood pressure, body weight, and changes in health status were documented.
Intervention
All visits took place after an overnight fast, with plasma samples taken and partly stored at −80°C for later analyses. Participants were randomized to treatments with either lean donor or autologous FMT performed according to the previously described procedure( 19 ) at 8‐week intervals (baseline gastroduodenoscopy, although at 8 weeks and 16 weeks a duodenal tube was placed by means of CORTRAK enteral access [Medline Industries, Northfield, IL). We have previously observed that gut microbiota composition in the recipient is affected up to 8‐12 weeks after donor FMT,( 18 , 19 ) so we chose this time window to ensure a stable donor gut microbiota composition over this 24‐week period. The fecal samples received from the donors were collected approximately 6 hours before infusion into the recipients. Donors were not specifically matched with recipients based on histological or clinical characteristics. We preferred the use of duodenal infusion for FMT administration over infusion through colonoscopy because of the potential role of the duodenum in metabolism, combined with our established experience with, and the low complication rate of, this method at our institution.( 18 , 19 , 20 )
Randomization and Blinding
Subjects were randomized using computerized block randomization, using blocks of 4 individuals. At the day of FMT, the independent physician provided the trial physician with the fecal material with the intended treatment from either the assigned donor or individual with NAFLD. The study participants (e.g., vegan donors and individuals with NAFLD) and all trial physicians (including all authors) were blinded for the treatment until completion of the trial.
Liver Biopsy
Percutaneous liver biopsies were performed in the recruiting center on the basis of clinical indications according to local standard procedure. All histologic specimens were scored by a liver pathologist (J.V.) who was blinded to any other results. The NASH Clinical Research Network (NASH‐CRN) classification( 20 ) was assessed with use of hematoxylin and eosin–stained slides for steatosis, inflammation and ballooning, and with a sirius red–stained slide for evaluation of fibrosis. The NAFLD activity score (NAS) is the unweighted sum of steatosis (0‐3), lobular inflammation (0‐3), and hepatocellular ballooning (0‐2). RNA for RNA‐sequencing analysis was isolated using an RNA isolation protocol optimized for (very small) percutaneous liver biopsies directly frozen in liquid nitrogen after biopsy and stored at −80°C (see Supporting Information). RNA‐sequencing raw data (raw reads) were processed using Kallisto (v0.43.1)( 21 ) to obtain gene counts. The R package tximport( 22 ) was used to import gene counts into R (v3.4), in which differential gene‐expression analysis was performed using DESeq2 (v1.16).( 23 ) Differential gene expression aimed to find genes that showed a statistically significant interaction between the change in gene expression in time (between baseline and 24 weeks) and treatment allocation (autologous FMT vs. allogenic vegan donor FMT). P values for the interaction effects were adjusted using the Benjamin‐Hochberg correction. Genes with adjusted P values less than 0.1 were considered significant (i.e., their expression levels changed differently in subjects who received autologous FMT compared with subjects who received allogenic vegan donor FMT).
Biochemistry
Glucose and C‐reactive protein (CRP; Roche, Basel, Switzerland) were determined in fasted plasma samples. In addition, alkaline phosphatase (ALP), gamma‐glutamyltransferase (GGT),caspartate aminotransferase (AST), ALT, total cholesterol, high‐density lipoprotein cholesterol (HDL‐C), low‐density lipoprotein cholesterol (LDL‐C), and triglycerides were determined in ethylene diamine tetraacetic acid (EDTA) containing fasted plasma samples using commercially available assays (Randox, Antrim, United Kingdom; and DiaSys Diagnostic Systems, Holzheim, Germany). All lipid analyses were performed using a Selectra autoanalyzer (Sopachem, Ochten, the Netherlands). LDL‐C was calculated using the Friedewald formula.
Plasma Metabolites
Fasting plasma metabolites were measured at the University of Copenhagen. Plasma samples were centrifuged at 2000g for 15 minutes at 4°C from full blood mixed with EDTA, then stored at −80°C. The order of the samples was randomized within the analytical batch. Sample processing was performed at 4°C using an ice bath. The plasma samples were thawed on ice and subjected to protein precipitation using a 96‐well Sirocco plate (Waters Corp., Milford, MA). A total of 180 μL of solvent B (acetonitrile : methanol [50:50, vol/vol]) was added to plasma samples (40 μL) and spiked with an internal standard mixture of 7 compounds (10 μL), after which analyses were performed as previously described( 24 ) (see also Supporting Methods and Supporting Table S1).
Fecal Microbiota Profiling
Fecal samples of donors and participants were taken at 0 and 24 weeks after initiation of study and analyzed for microbiota composition using 16S ribosomal RNA amplicon sequencing.( 25 ) DNA extraction from fecal samples was performed using the repeated bead beating protocol as previously described.( 26 ) At baseline and 24 weeks, individuals with NAFLD underwent gastro‐duodenoscopy, and duodenal biopsies were immediately collected in sterile tubes, snap‐frozen in liquid nitrogen, and stored at −80°C. DNA was isolated from duodenal biopsies using a slightly modified protocol, and 16S sequencing was performed for small intestinal microbiota profiling as described previously( 27 ) (see also Supporting Methods).
Power and Study Endpoints
Based on previous intervention studies in NAFLD, such as the study of Belfort et al.,( 28 ) in which treatment with pioglitazone in individuals with NASH led to a 54% reduction of steatosis compared with placebo, we performed a power analysis to calculate the number of participants necessary to detect a 25% reduction in our primary outcome parameter, reversal of steatosis, and necro‐inflammation following donor FMT. For a desired alpha of 0.05 and a desired power of 0.8, a sample size of 27 per arm was needed. Hence, 54 individuals were needed in total. A data safety and monitoring board (DSMB) was appointed for safety monitoring. The primary endpoint parameters of this study were histological change in NAFLD parameters including steatosis and hepatic necro‐inflammatory activity (ballooning and lobular inflammation following NASH‐CRN classification), without worsening of fibrosis in lean vegan donor versus autologous FMT treatment. To assess these outcome parameters, histopathological evaluation of a percutaneously obtained liver biopsy sample was performed at baseline and after 24 weeks (8 weeks after the third FMT) in combination with changes in hepatic gene expression (using RNA sequencing in the liver biopsy taken at baseline and after 24 weeks). Secondary outcome parameters consisted of the change in intestinal microbiota composition between baseline and after 24 weeks. Other secondary outcome parameters included change in fasting plasma–targeted metabolites, plasma markers of fatty liver disease (ALT/AST), and inflammation (monocytes) at these time points.
Machine Learning and Follow‐up Statistical Analyses
For baseline differences between groups, unpaired Student t test or the Mann‐Whitney U test were used dependent on the distribution of the data. Accordingly, data are expressed as mean ± the SD or the median with interquartile range. The change in hepatic steatosis and hepatic necro‐inflammatory activity (lobular inflammation and ballooning) following lean vegan donor FMT versus autologous FMT was tested using a Mann‐Whitney U test. Changes in plasma biochemistry–derived outcome parameters between both treatment groups were tested using a Student t test or Mann‐Whitney U test, respectively, for normal and nonparametrically distributed data. For correlation analyses, Spearman’s rank test was used (as all parameters were nonparametric). A P value < 0.05 was considered statistically significant. An Elastic Net machine learning classification algorithm in combination with a stability selection procedure( 29 ) was used to identify biological features that changed differently between the two treatment groups as previously published( 19 ) (see also Supporting Information).
Results
Between 2014 and 2017, 26 treatment‐naïve obese individuals with metabolic syndrome and hepatic steatosis on ultrasound were included. In total, 4 of the included NAFLD individuals were excluded before randomization due to the diagnosis of new‐onset T2DM (n = 3) or lost‐to‐follow‐up (n = 1). After randomization, 1 individual had to be excluded due to the diagnosis of new‐onset T2DM. Due to slow recruitment, after 21 subjects were enrolled and completed the study, the trial was prematurely stopped. Baseline characteristics of the participants are given in Table 1. Daily dietary intake, divided into four macronutrients and caloric content, did not significantly differ between the allogenic and autologous FMT recipients and remained stable over the course of the study (data not shown). Feces from 4 healthy lean vegan donors (2 donated three times and five times, respectively; the other 2 donated only once) were used for allogenic gut microbiota transfer to individuals with NAFLD. The same donor was used for the three consecutive FMTs in each participant. There were no (serious) adverse events or adverse changes in plasma biochemistry, and none of the study subjects used any medication (including no antibiotics) during the study.
Table 1.
Baseline Characteristics of 21 Individuals With Biopsy‐Proven NAFLD
| Autologous FMT (n = 11) | Allogenic FMT (n = 10) | |
|---|---|---|
| Age, years | 48.5 ± 10.2 | 51.2 ± 6.6 |
| Male gender, % | 96 | 86 |
| BMI, kg/m2 | 31.5 ± 4.8 | 31.7 ± 3.5 |
| Glucose, mmol/L | 5.7 ± 0.5 | 5.8 ± 0.7 |
| AST, IU/L | 29.0 [26.5‐33.0] | 39.5 [37.0‐49.5] |
| ALT, IU/L | 48.1 ± 16.5 | 70.8 ± 23.4 |
| ALP, IU/L | 83.0 [54.0‐120.5] | 71.0 [58.8‐76.8] |
| GGT, IU/L | 41.1 ± 21.4 | 45.1 ± 19.3 |
| Cholesterol, mmol/L | 5.8 ± 1.6 | 6.0 ± 0.8 |
| HDL‐C, mmol/L | 1.2 [1.0‐1.4] | 1.2 [1.0‐1.4] |
| LDL‐C, mmol/L | 4.0 ± 1.3 | 4.2 ± 0.7 |
| Triglycerides, mmol/L | 1.2 ± 0.6 | 1.4 ± 0.5 |
| CRP, mg/mL | 2.2 [0.8‐4.3] | 1.5 [0.9‐3.2] |
| Leucocytes, 109/L | 6.8 ± 1.8 | 5.8 ± 1.3 |
| Monocytes, 109/L | 0.56 ± 0.18 | 0.54 ± 0.18 |
| Calories, kcal/day | 1811.2 ± 376.3 | 2,024.7 ± 499.3 |
| Fat, g/day | 68.6 ± 19.0 | 80.1 ± 19.6 |
| Carbohydrates, g/day | 191.8 ± 53.9 | 203.7 ± 64.3 |
| Protein, g/day | 82.9 ± 19.0 | 91.2 ± 27.1 |
| Fiber, g/day | 22.5 ± 6.2 | 18.4 ± 8.2 |
| Steatosis, % | 35.0 ± 20.7 | 34.1 ± 20.4 |
| NAS score | 2.45 ± 0.82 | 3.0 ± 0.94 |
| Necro‐inflam. score | 0.91 ± 0.30 | 1.4 ± 0.52 |
| Fibrosis score | 0.91 ± 0.70 | 1.2 ± 0.92 |
Data are expressed as mean ± SD or median [interquartile range], depending on the distribution of the data.
Primary Outcomes
Liver Histology and Gene‐Expression Alterations After FMT
Analyzing paired liver biopsies for histology (Supporting Table S3), we found no statistically significant change in the overall NAS (Fig. 1A) and steatosis grade (Fig. 1D). We did, however, observe a trend toward improvement in the necro‐inflammation score (consisting of both lobular inflammation and hepatocellular ballooning) (Fig. 1B) after allogenic FMT approached significance. Finally, the fibrosis scores (Fig. 1C) did not change over the period of 24 weeks in both groups.
Fig. 1.
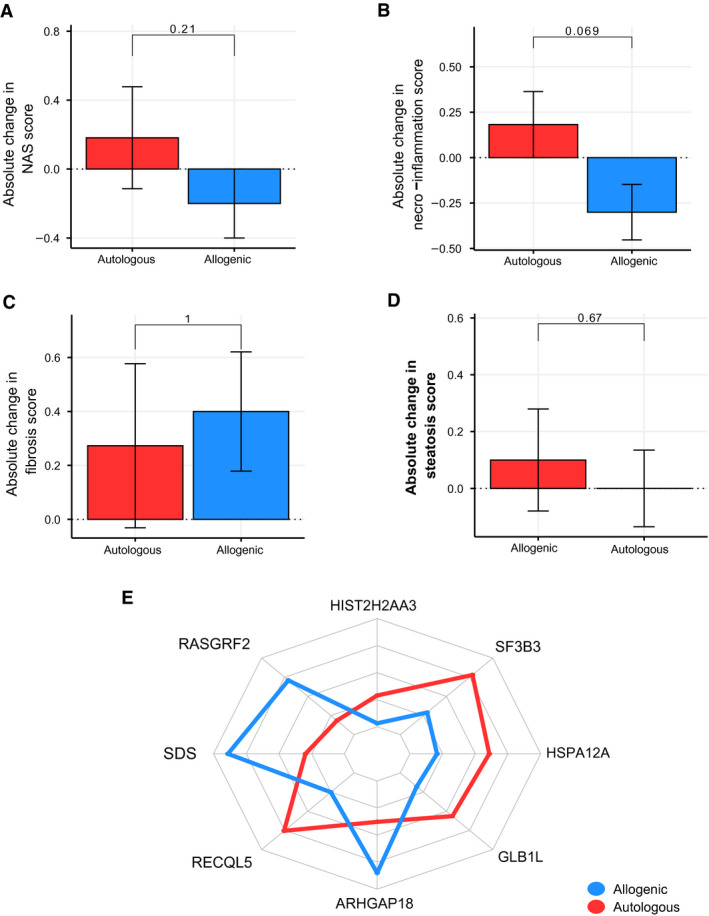
Changes in liver histology and gene expression. Error bars show SEMs. (A) NAS score. (B) Necro‐inflammation score. (C) Fibrosis score. (D) Steatosis score. (E) Liver gene expression. HIST2H2AA3, Histone H2A type 3‐A; RASGRF2, Ras Protein Specific Guanine Nucleotide Releasing Factor 2; SDS, Serine Dehydratase; RECQL5, RecQ Like Helicase 5; ARHGAP18, Rho GTPase Activating Protein 18; GLB1L, Galactosidase Beta 1 Like protein; HSPA12A, Heat Shock Protein Family A (Hsp70) Member 12A; SF3B3, Splicing Factor 3b Subunit 3.
Similarly, there were significant changes in gene expression in liver biopsies in the allogenic FMT group, compared with the autologous FMT (Fig. 1E). For example, ARHGAP18 expression, a protective gene that maintains endothelial cell alignment, increased following allogenic FMT (P = 0.002). Furthermore, serine dehydratase (SDS) expression was significantly increased following allogenic FMT (P = 0.049). SDS catalyzes the conversion of serine into pyruvate, and ammonia and is found to be decreased during liver damage.( 30 ) In contrast, hepatic expression of RECQL5 (P = 0.014), a gene that is implicated in DNA double‐strand break repair( 31 ) and therefore linked to the DNA damage‐response signaling pathway,( 32 ) and SF3B3 (splicing factor 3b subunit 3) (P = 0.004), a gene promoting cell proliferation and known to be an early‐stage driver in the development of liver cancer,( 33 , 34 ) both increased following autologous FMT.
Secondary Outcomes
Biochemistry Results 24 weeks After FMT
Following FMT, the GGT levels in the allogenic FMT group decreased (mean delta 6.4 ± 8.3, P = 0.038), while remaining unchanged in the autologous treated individuals (mean delta 0.7 ± 15.4, P = 0.883) (Table 2). Furthermore, ALT levels tended to decrease more in the allogenic‐treated group (mean delta 14.3 ± 24.6, P = 0.099) compared with the autologous treated group (mean delta 3.1 ± 20.2, P = 0.639).
Table 2.
Metabolic and Histologic Parameters After FMT Treatment
| Autologous FMT, 24 Weeks | P Value | Allogenic FMT, 24 Weeks | P Value | |
|---|---|---|---|---|
| Glucose, mmol/L | 5.6 ± 0.8 | 0.241 | 5.8 ± 0.6 | 0.945 |
| AST, IU/L | 31.5 [18.8‐41.3] | 0.553 | 36.0 [29.0‐42] | 0.116 |
| ALT, IU/L | 46.6 ± 23.3 | 0.639 | 56.5 ± 19.2 | 0.099 |
| ALP, IU/L | 86.0 [66.8‐112] | 0.611 | 70.0 [57.3‐83] | 0.358 |
| GGT, IU/L | 40.7 ± 28.5 | 0.883 | 38.7 ± 21.2 | 0.038 |
| Cholesterol, mmol/L | 5.5 ± 1.5 | 0.055 | 5.8 ± 0.8 | 0.139 |
| HDL‐C, mmol/L | 1.2 [0.9‐1.3] | 0.280 | 1.1 [1.0‐1.2] | 0.308 |
| LDL‐C, mmol/L | 3.7 ± 1.2 | 0.099 | 4.0 ± 0.8 | 0.378 |
| Triglycerides, mmol/L | 1.2 ± 0.6 | 0.796 | 1.4 ± 0.4 | 0.603 |
| CRP, mg/mL | 3.5 [0.6‐6.3] | 0.721 | 1.5 [0.7‐4.4] | 0.678 |
| Leucocytes, 109/L | 6.6 ± 1.7 | 0.643 | 6.0 ± 1.2 | 0.643 |
| Monocytes, 109/L | 0.53 ± 0.18 | 0.425 | 0.59 ± 0.25 | 0.460 |
| Steatosis, % | 30.5 ± 25.5 | 0.316 | 36.5 ± 25.3 | 0.527 |
| NAS score | 2.64 ± 1.36 | 0.553 | 2.8 ± 1.23 | 0.343 |
| Necro‐inflam. score | 1.09 ± 0.54 | 0.341 | 1.10 ± 0.57 | 0.081 |
| Fibrosis score | 1.18 ± 0.75 | 0.391 | 1.60 ± 0.70 | 0.104 |
Data are expressed as mean ± SD or median [interquartile range], depending on the distribution of the data.
FMT Alters Gut Microbial Composition
There was no difference in fecal microbiota alpha diversity (Shannon index) at baseline between individuals with NAFLD and allogenic FMT donors (Shannon index: NAFLD 4.7 ± 0.4 vs. donor 4.8 ± 0.1, not significant). Redundancy analysis showed a trend toward distinction in fecal microbiota composition between donors and subjects with NAFLD (Supporting Fig. S2), together with a significant difference of fiber intake in vegan donors (Supporting Table S4 ). Among others, bacteria related to Prevotella were associated with a plant‐based diet, whereas several groups belonging to the Lachnospiraceae were related to the individuals with NAFLD. Following FMT, no significant changes in fecal microbiota diversity (Shannon index P = 0.84 for the allogenic FMT; P = 0.32 for the autologous FMT) were observed between baseline and week 24; however, a change in gut microbiota composition, although not significant, was found following allogenic FMT (Supporting Fig. S2). Compared with autologous FMT, increases in fecal microbiota abundance following allogenic FMT were seen in bacteria related to Ruminococcus, Eubacterium hallii, Faecalibacterium, and Prevotella copri (Fig. 2A). In contrast, autologous FMT resulted in minor shifts in microbiota composition, and was primarily associated with changes in the abundance of bacteria related to Lachnospiraceae. There was no difference in duodenal microbiota diversity and composition before and after 24 weeks in either FMT group (data not shown).
Fig. 2.
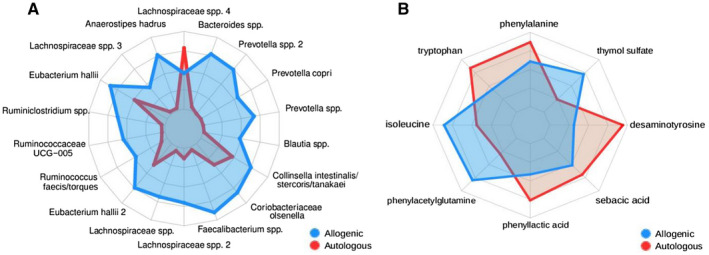
Radar plots of significantly altered biological features following either autologous (red) or allogenic (blue) FMT. (A) Fecal microbial strains. (B) Plasma metabolites.
FMT Alters Plasma Metabolite Composition
Fasting plasma metabolites of both the autologous and the allogenic treated group significantly changed between baseline and 24 weeks after FMT (Fig. 2B). Both plasma levels of the amino acids isoleucine (P = 0.039) and phenylacetylglutamine (P = 0.027) increased in plasma following allogenic FMT (Supporting Table S2). In contrast, plasma phenyllactic acid, which is an adverse microbial product of aromatic amino acid metabolism, was increased following autologous FMT (P = 0.008). Also, plasma levels of desaminotyrosine, a microbial metabolite known to trigger type I interferon signaling (IFN1) were increased following autologous FMT (P = 0.008). Finally, we found correlations among liver gene expression, fecal gut microbiota composition, and plasma metabolite levels following either autologous or allogenic FMT, as given in Fig. 3 and further described in the Discussion.
Fig. 3.
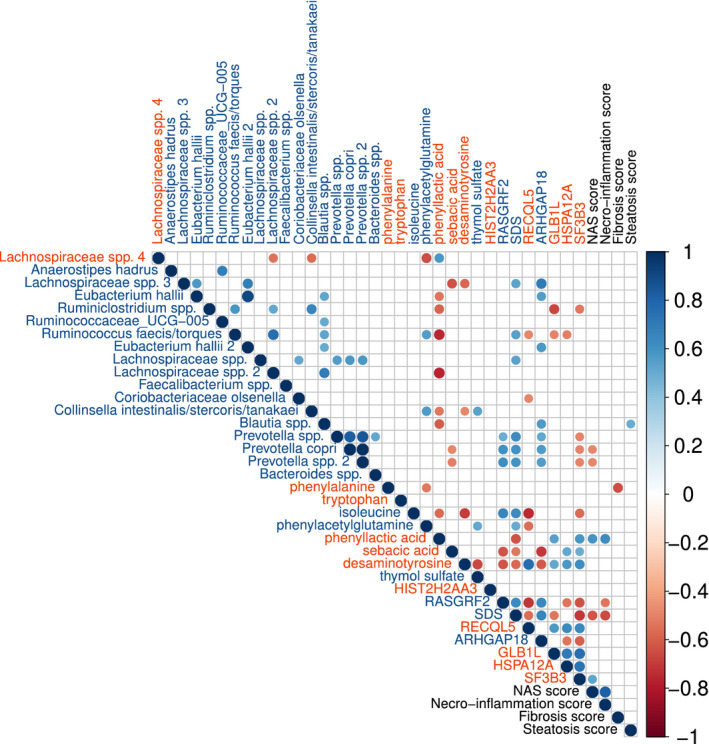
Correlation plot showing significant correlations among liver genes, fecal bacteria, and plasma metabolite levels (Spearman’s rho); blue, increased in allogenic FMT/decreased in autologous FMT; red, increased in autologous FMT/decreased in allogenic FMT. Liver histology scores are included in black font. HIST2H2AA3, Histone H2A type 3‐A; RASGRF2, Ras Protein Specific Guanine Nucleotide Releasing Factor 2; SDS, Serine Dehydratase; RECQL5, RecQ Like Helicase 5; ARHGAP18, Rho GTPase Activating Protein 18; GLB1L, Galactosidase Beta 1 Like protein; HSPA12A, Heat Shock Protein Family A (Hsp70) Member 12A; SF3B3, Splicing Factor 3b Subunit 3.
Discussion
In this study we show the effect of lean vegan donor (allogenic) versus own (autologous) FMT on obese treatment‐naïve individuals with metabolic syndrome and biopsy‐proven NAFLD, in whom NAFLD is typically observed. Although the present study was underpowered, allogenic FMT from vegan donors on a plant‐based, low‐animal‐protein diet decreased the necro‐inflammation score in paired liver biopsies. In addition, allogenic FMT showed an effect on intestinal microbiota composition, which was associated with both beneficial changes in plasma metabolites and the expression of liver genes involved in inflammation and lipid metabolism after donor FMT. Using differences in histology data in both treatment groups between baseline and 24 weeks after treatment, we calculated that 21 participants per treatment arm would have been needed to detect a significant beneficial effect of allogenic FMT in the necro‐inflammation score, whereas 120 participants per group are needed to detect a significant difference on overall NAS. Therefore, our study could serve as a blueprint for sample sizes and specific FMT donor selection of future microbiota‐based intervention trials in individuals with liver biopsy‐proven NAFLD.
Interactions Between Changes in Microbiota and Liver Genes/Histology Following FMT
As donor metabolic characteristics can be transferred by FMT,( 18 ) in this study we opted for FMT donors on a plant‐based low‐animal‐protein diet, known to have less NAFLD.( 11 ) In line with a recent paper that assessed the effect of donor FMT on magnetic resonance spectroscopy–derived proton density–fat fraction signal in NAFLD, we did not find changes in steatosis grade following allogenic FMT, as determined by liver biopsy( 35 ); however, we did find that liver necro‐inflammation score improved, which was aligned by significant changes in several hepatic genes (Fig. 1). In this regard, the ARHGAP18 gene is a protective gene that maintains endothelial cell alignment, and loss of ARHGAP18 may predispose to atherosclerosis development.( 36 ) Liver endothelial cells play a pivotal role in maintaining liver homeostasis, and endothelial cell dysfunction (i.e., loss of fenestrations) occurs early in the pathogenesis of NAFLD, promoting steatosis, inflammation, and liver fibrosis.( 37 ) Moreover, a mutual relation between gut microbiota composition and liver endothelial cell fenestration has been described,( 38 ) with a positive relation between the abundance of Firmicutes and endothelial integrity. Following allogenic FMT, ARHGAP18 was positively correlated with E. hallii, suggesting a protective role of this bacterial species in maintaining liver endothelial cell function. Moreover, ARHGAP18 was inversely correlated with plasma desaminotyrosine levels, a microbial metabolite that is known to trigger IFN1.( 39 ) Recently it was shown that a high‐fat diet induces an IFN1 response, which results in NAFLD progression through metabolically activated intrahepatic T‐cell pathogenicity.( 40 )
Finally, we observed that after allogenic FMT, hepatic SDS expression was significantly increased and showed an inverse relation with necro‐inflammation and steatosis in liver histology (Fig. 3). In human liver biopsies, SDS resides predominantly in the perivenous region of the hepatocyte,( 41 ) and expression decreased during liver damage.( 30 ) SDS catalyzes the conversion of serine into pyruvate and ammonia, and previous studies have linked these metabolites to specific microbiota composition, like P. copri abundance.( 42 ) With regard to the latter, in our study NAS scores were inversely related with P. copri, which is in line with the data reported by Boursier et al.,( 10 ) but conflict with other publications that have linked an increased abundance of this species to NAFLD.( 43 ) Hepatocyte injury and inflammatory cell infiltration in the perivenous (efferent) areas of the liver are a hallmark of NASH, and this area is involved in glycolysis, lipogenesis, ureagenesis from ammonia, and biotransformation of plasma compounds, including metabolites.( 44 ) Similarly, plasma phenyllactic acid levels, which are a microbial product of aromatic amino acid metabolism and already linked to NAFLD in humans,( 45 ) were inversely related to hepatic SDS expression following allogenic FMT. As phenyllactic acid is produced by lactic acid bacteria, the observed inverse relation between phenyllactic acid and E. hallii is interesting to note, as this bacterial species can use lactic acid for butyrate production and has beneficial metabolic effects in humans.( 46 ) Taken together, our data point toward a beneficial role of vegan‐donor FMT on prevention of NAFLD by reducing specific gut microbiota–derived plasma metabolites that are toxic to the liver.
Interactions Between Changes in Plasma Metabolites and Liver Genes/Histology Following FMT
The linear correlation of the SDS gene with isoleucine and phenylacetylglutamine (both increased in plasma following allogenic FMT) is of interest, as a recent paper using genome‐scale models indicated that individuals with NAFLD have altered metabolism of these amino acids.( 47 ) Alterations in circulating amino acids and branched chain amino acids are often explained to be the result of impaired amino acid metabolism linked to insulin resistance, especially in the muscle.( 48 ) Only recently has it been revealed that the gut microbiome is associated with plasma metabolite alterations of amino acids and branched chain amino acids.( 42 ) Our results strengthen the observation that the gut microbiome contributes to plasma amino acids and branched chain amino acid composition. The inverse relation between plasma phenylalanine with the fibrosis score corroborates with older literature that phenylalanine metabolism is decreased in individuals with hepatopathy, with plasma phenylalanine values decreasing with relatively early liver fibrosis.( 49 )
However, only recently it was shown that metabolic pathways involved in the biosynthesis of phenylalanine are increased in the gut microbiome of individuals with NAFLD.( 9 ) Despite the enhanced capacity of the gut microbiome to produce phenylalanine, plasma levels are dependent on the liver to catabolize this metabolite. Under normal circumstances and homeostasis, phenylalanine is converted in the liver to tyrosine, and when the liver is not capable of metabolizing phenylalanine, phenyllactic acid and/or phenylacetylglutamine is produced, products that are negatively (phenylacetylglutamine)( 9 ) or positively (phenyllactic acid)( 45 ) associated with NAFLD according to recent findings. Although phenylalanine and downstream metabolites are highlighted in this study, it is most likely part of a much broader multifactorial process, only partly orchestrated by the gut microbiome. Thus, further research to prove the causality of the gut microbiome in the development of NAFLD and NASH is warranted.
Study Limitations
First, due to slow recruitment, our study was underpowered, as we prematurely had to terminate our trial. Second, although we observed no significant differences in baseline liver histology (NAFL‐NASH classifications) between the autologous and allogenic FMT groups (Table 2), differences in baseline AST and ALT levels were observed. As participants were randomized, this difference occurred by chance, but could have influenced the outcome of our study. However, if this would be the case, this baseline difference would have led to an underestimation of the allogenic donor effect, as all parameters were increased in that group. A third limitation is the use of untargeted analysis of hepatic gene expression, as the genes found to be differentially expressed are not classical markers of hepatic inflammation in NAFLD. Another limitation is our choice of FMT donors, as donor metabolic characteristics can be transferred by FMT.( 18 ) We therefore chose FMT donors consuming a plant‐based low‐animal‐protein diet who are known to have less NAFLD.( 11 ) However, we did not compare the effect of lean FMT from donors on either an omnivorous or plant‐based diet. Finally, our population was relatively healthy and did not fully reflect the typical individual with NAFLD, who is often affected by multiple diseases in addition to NAFLD and therefore treated with multiple medications. This is reflected by the relatively low necro‐inflammation score found. However, numerous medications, not limited to proton pump inhibitors and antibiotics, dramatically alter the gut microbial composition, even with interindividual differences.( 50 ) To demonstrate causality between the gut microbiome and the development of NAFLD, the use of medication was an exclusion criterion for participation in this study. Keeping these limitations in mind, the question to what extent the gut microbiome plays a significant role in the development of NAFLD and especially in individuals with a more progressive form (i.e., higher necro‐inflammation score) remains to be answered.
In conclusion, our study shows that repetitive allogenic donor FMT in individuals with NAFLD affects hepatic gene expression and plasma metabolites involved in inflammation and lipid metabolism, highlighting the crosstalk between gut microbiota composition and NAFLD. Therefore, our work not only validates previous associative studies on the relation between NAFLD and gut microbiota, but also provides future sample sizes for microbiota‐based intervention trials aimed at treating NAFLD in humans.
Supporting information
Supplementary Material
Acknowledgments
The authors thank Ineke Heikamp‐de Jong for the support in the fecal sample DNA isolation. H.R. Buller and B.A. Hutten are acknowledged as DSMB members, as well as Cecilie Fryland Appeldorff for the ultrahigh performance liquid chromatography–mass spectrometry analyses. Finally, we respectfully acknowledge our participants who selflessly applied themselves to help completing this burdensome project.
Clinical Trial Registration – Trial NL4189 (NTR4339).
Supported by Hartstichting (Grant/Award No. 2012‐03) and Fondation Leducq (Grant/Award No. 17CVD01).
Potential conflict of interest: Dr. Aron‐Wisnewsky received grants from the Bettencourt Schueller Foundation. Dr. Nieuwdorp and Dr. de Vos own stock in, consult for, and has intellectual property rights in Caelus Health. He consults for Kaleido. None of these are directly relevant to the current paper.
References
- 1. Younossi Z, Tacke F, Arrese M, Chander Sharma B, Mostafa I, Bugianesi E, et al. Global perspectives on nonalcoholic fatty liver disease and nonalcoholic steatohepatitis. Hepatology 2019;69:2672‐2682. [DOI] [PubMed] [Google Scholar]
- 2. Pais R, Charlotte F, Fedchuk L, Bedossa P, Lebray P, Poynard T, et al. A systematic review of follow‐up biopsies reveals disease progression in patients with non‐alcoholic fatty liver. J Hepatol 2013;59:550‐556. [DOI] [PubMed] [Google Scholar]
- 3. McPherson S, Hardy T, Henderson E, Burt AD, Day CP, Anstee QM. Evidence of NAFLD progression from steatosis to fibrosing‐steatohepatitis using paired biopsies: implications for prognosis and clinical management. J Hepatol 2015;62:1148‐1155. [DOI] [PubMed] [Google Scholar]
- 4. Ekstedt M, Hagström H, Nasr P, Fredrikson M, Stål P, Kechagias S, et al. Fibrosis stage is the strongest predictor for disease‐specific mortality in NAFLD after up to 33 years of follow‐up. Hepatology 2015;61:1547‐1554. [DOI] [PubMed] [Google Scholar]
- 5. Ratziu V. Back to Byzance: Querelles byzantines over NASH and fibrosis. J Hepatol 2017;67:1134‐1136. [DOI] [PubMed] [Google Scholar]
- 6. Kleiner DE, Brunt EM, Wilson LA, Behling C, Guy C, Contos M, et al. Association of histologic disease activity with progression of nonalcoholic fatty liver disease. JAMA Netw Open 2019;2:e1912565. [DOI] [PMC free article] [PubMed] [Google Scholar]
- 7. Fazel Y, Koenig AB, Sayiner M, Goodman ZD, Younossi ZM. Epidemiology and natural history of non‐alcoholic fatty liver disease. Metabolism 2016;65:1017‐1025. [DOI] [PubMed] [Google Scholar]
- 8. Loomba R, Seguritan V, Li W, Long T, Klitgord N, Bhatt A, et al. Gut microbiome‐based metagenomic signature for non‐invasive detection of advanced fibrosis in human nonalcoholic fatty liver disease. Cell Metab 2019;30:607. [DOI] [PMC free article] [PubMed] [Google Scholar]
- 9. Hoyles L, Fernández‐Real JM, Federici M, Serino M, Abbott J, Charpentier J, et al. Molecular phenomics and metagenomics of hepatic steatosis in non‐diabetic obese women. Nat Med 2018;24:1070‐1080. [DOI] [PMC free article] [PubMed] [Google Scholar]
- 10. Boursier J, Mueller O, Barret M, Machado M, Fizanne L, Araujo‐Perez F, et al. The severity of nonalcoholic fatty liver disease is associated with gut dysbiosis and shift in the metabolic function of the gut microbiota. Hepatology 2016;63:764‐775. [DOI] [PMC free article] [PubMed] [Google Scholar]
- 11. Mazidi M, Kengne AP. Higher adherence to plant‐based diets are associated with lower likelihood of fatty liver. Clin Nutr 2019;38:1672‐1677. [DOI] [PubMed] [Google Scholar]
- 12. Wu GD, Compher C, Chen EZ, Smith SA, Shah RD, Bittinger K, et al. Comparative metabolomics in vegans and omnivores reveal constraints on diet‐dependent gut microbiota metabolite production. Gut 2016;65:63‐72. [DOI] [PMC free article] [PubMed] [Google Scholar]
- 13. Koeth RA, Lam‐Galvez BR, Kirsop J, Wang Z, Levison BS, Gu X, et al. l‐Carnitine in omnivorous diets induces an atherogenic gut microbial pathway in humans. J Clin Invest 2018;129:373‐387. [DOI] [PMC free article] [PubMed] [Google Scholar]
- 14. Chen Y, Liu Y, Zhou R, Chen X, Wang C, Tan X, et al. Associations of gut‐flora‐dependent metabolite trimethylamine‐N‐oxide, betaine and choline with non‐alcoholic fatty liver disease in adults. Sci Rep 2016;6:19076. [DOI] [PMC free article] [PubMed] [Google Scholar]
- 15. Meijnikman AS, Gerdes VE, Nieuwdorp M, Herrema H. Evaluating causality of gut microbiota in obesity and diabetes in humans. Endocr Rev 2018;39:133‐153. [DOI] [PubMed] [Google Scholar]
- 16. Walter J, Armet AM, Finlay BB, Shanahan F. Establishing or exaggerating causality for the gut microbiome: lessons from human microbiota‐associated rodents. Cell 2020;180:221‐232. [DOI] [PubMed] [Google Scholar]
- 17. Vrieze A, Van Nood E, Holleman F, Salojärvi J, Kootte RS, Bartelsman JFWMWM, et al. Transfer of intestinal microbiota from lean donors increases insulin sensitivity in individuals with metabolic syndrome. Gastroenterology 2012;143:913‐916.e7. [DOI] [PubMed] [Google Scholar]
- 18. de Groot P, Scheithauer T, Bakker GJ, Prodan A, Levin E, Khan MT, et al. Donor metabolic characteristics drive effects of faecal microbiota transplantation on recipient insulin sensitivity, energy expenditure and intestinal transit time. Gut 2020;69:502‐512. [DOI] [PMC free article] [PubMed] [Google Scholar]
- 19. Smits LP, Kootte RS, Levin E, Prodan A, Fuentes S, Zoetendal EG, et al. Effect of vegan fecal microbiota transplantation on carnitine‐ and choline‐derived trimethylamine‐N‐oxide production and vascular inflammation in patients with metabolic syndrome. J Am Heart Assoc 2018;7:e008342. [DOI] [PMC free article] [PubMed] [Google Scholar]
- 20. Kleiner DE, Brunt EM, Van Natta M, Behling C, Contos MJ, Cummings OW, et al. Design and validation of a histological scoring system for nonalcoholic fatty liver disease. Hepatology 2005;41:1313‐1321. [DOI] [PubMed] [Google Scholar]
- 21. Bray NL, Pimentel H, Melsted P, Pachter L. Near‐optimal probabilistic RNA‐seq quantification. Nat Biotechnol 2016;34:525‐527. [DOI] [PubMed] [Google Scholar]
- 22. Soneson C, Love MI, Robinson MD. Differential analyses for RNA‐seq: transcript‐level estimates improve gene‐level inferences. F1000Res 2015;4:1521. [DOI] [PMC free article] [PubMed] [Google Scholar]
- 23. Love MI, Huber W, Anders S. Moderated estimation of fold change and dispersion for RNA‐seq data with DESeq2. Genome Biol 2014;15:550. [DOI] [PMC free article] [PubMed] [Google Scholar]
- 24. Barri T, Holmer‐Jensen J, Hermansen K, Dragsted LO. Metabolic fingerprinting of high‐fat plasma samples processed by centrifugation‐ and filtration‐based protein precipitation delineates significant differences in metabolite information coverage. Anal Chim Acta 2012;718:47‐57. [DOI] [PubMed] [Google Scholar]
- 25. Taylor M, Wood HM, Halloran SP, Quirke P. Examining the potential use and long‐term stability of guaiac faecal occult blood test cards for microbial DNA 16S rRNA sequencing. J Clin Pathol 2017;70:600‐606. [DOI] [PubMed] [Google Scholar]
- 26. Salonen A, Nikkilä J, Jalanka‐Tuovinen J, Immonen O, Rajilić‐Stojanović M, Kekkonen RA, et al. Comparative analysis of fecal DNA extraction methods with phylogenetic microarray: effective recovery of bacterial and archaeal DNA using mechanical cell lysis. J Microbiol Methods 2010;81:127‐134. [DOI] [PubMed] [Google Scholar]
- 27. Zoetendal E, Heilig H, Klaassens E. Isolation of DNA from bacterial samples of the human gastrointestinal tract. Nat Protoc 2006;1:870‐873. [DOI] [PubMed] [Google Scholar]
- 28. Belfort R, Harrison SA, Brown K, Darland C, Finch J, Hardies J, et al. A placebo‐controlled trial of pioglitazone in subjects with nonalcoholic steatohepatitis. N Engl J Med 2006;355:2297‐2307. [DOI] [PubMed] [Google Scholar]
- 29. Meinshausen N, Bühlmann P. Stability selection. J R Stat Soc Ser B 2010;72:417‐473. [Google Scholar]
- 30. López‐Flores I, Barroso JB, Valderrama R, Esteban FJ, Martínez‐Lara E, Luque F, et al. Serine dehydratase expression decreases in rat livers injured by chronic thioacetamide ingestion. Mol Cell Biochem 2005;268:33‐43. [DOI] [PubMed] [Google Scholar]
- 31. Liao W‐Q. Recql5 protects against lipopolysaccharide/D‐galactosamine‐induced liver injury in mice. World J Gastroenterol 2015;21:10375. [DOI] [PMC free article] [PubMed] [Google Scholar]
- 32. Ciccia A, Elledge SJ. The DNA damage response: making it safe to play with knives. Mol Cell 2010;40:179‐204. [DOI] [PMC free article] [PubMed] [Google Scholar]
- 33. Shen Q, Nam SW. SF3B4 as an early‐stage diagnostic marker and driver of hepatocellular carcinoma. BMB Rep 2018;51:57‐58. [DOI] [PMC free article] [PubMed] [Google Scholar]
- 34. Mas VR, Fisher RA, Archer KJ, Maluf DG. Proteomics and liver fibrosis: identifying markers of fibrogenesis. Expert Rev Proteomics 2009;6:421‐431. [DOI] [PubMed] [Google Scholar]
- 35. Craven L, Rahman A, Nair Parvathy S, Beaton M, Silverman J, Qumosani K, et al. Allogenic fecal microbiota transplantation in patients with nonalcoholic fatty liver disease improves abnormal small intestinal permeability. Am J Gastroenterol 2020. May 15. 10.14309/ajg.0000000000000661. [Epub ahead of print] [DOI] [PubMed] [Google Scholar]
- 36. Lay AJ, Coleman PR, Formaz‐Preston A, Ting KK, Roediger B, Weninger W, et al. ARHGAP18: a flow‐responsive gene that regulates endothelial cell alignment and protects against atherosclerosis. J Am Heart Assoc [Internet]. 2019. Jan 22;8. Available from: https://www.ahajournals.org/doi/10.1161/JAHA.118.010057. [DOI] [PMC free article] [PubMed] [Google Scholar]
- 37. Hammoutene A, Rautou P‐E. Role of liver sinusoidal endothelial cells in non‐alcoholic fatty liver disease. J Hepatol 2019;70:1278‐1291. [DOI] [PubMed] [Google Scholar]
- 38. Cogger VC, Mohamad M, Solon‐Biet SM, Senior AM, Warren A, O’Reilly JN, et al. Dietary macronutrients and the aging liver sinusoidal endothelial cell. Am J Physiol Circ Physiol 2016;310:H1064‐H1070. [DOI] [PubMed] [Google Scholar]
- 39. Steed AL, Christophi GP, Kaiko GE, Sun L, Goodwin VM, Jain U, et al. The microbial metabolite desaminotyrosine protects from influenza through type I interferon. Science 2017;357:498‐502. [DOI] [PMC free article] [PubMed] [Google Scholar]
- 40. Ghazarian M, Revelo XS, Nøhr MK, Luck H, Zeng K, Lei H, et al. Type I interferon responses drive intrahepatic T cells to promote metabolic syndrome. Sci Immunol 2017;2:eaai7616. [DOI] [PMC free article] [PubMed] [Google Scholar]
- 41. Kashii T, Gomi T, Oya T, Ishii Y, Oda H, Maruyama M, et al. Some biochemical and histochemical properties of human liver serine dehydratase. Int J Biochem Cell Biol 2005;37:574‐589. [DOI] [PubMed] [Google Scholar]
- 42. Pedersen HK, Gudmundsdottir V, Nielsen HB, Hyotylainen T, Nielsen T, Jensen BAH, et al. Human gut microbes impact host serum metabolome and insulin sensitivity. Nature 2016;535:376‐381. [DOI] [PubMed] [Google Scholar]
- 43. Schwimmer JB, Johnson JS, Angeles JE, Behling C, Belt PH, Borecki I, et al. Microbiome signatures associated with steatohepatitis and moderate to severe fibrosis in children with nonalcoholic fatty liver disease. Gastroenterology 2019;157:1109‐1122. [DOI] [PMC free article] [PubMed] [Google Scholar]
- 44. Abdelmalek MF, Diehl AM. Nonalcoholic fatty liver disease as a complication of insulin resistance. Med Clin North Am 2007;91:1125‐1149. [DOI] [PubMed] [Google Scholar]
- 45. Caussy C, Hsu C, Lo M‐T, Liu A, Bettencourt R, Ajmera VH, et al. Link between gut‐microbiome derived metabolite and shared gene‐effects with hepatic steatosis and fibrosis in NAFLD. Hepatology 2018;68:918‐932. [DOI] [PMC free article] [PubMed] [Google Scholar]
- 46. Gilijamse PW, Hartstra AV, Levin E, Wortelboer K, Serlie MJ, Ackermans MT, et al. Treatment with Anaerobutyricum soehngenii: a pilot study of safety and dose–response effects on glucose metabolism in human subjects with metabolic syndrome. NPJ Biofilms Microbiomes 2020;6:16. [DOI] [PMC free article] [PubMed] [Google Scholar]
- 47. Mardinoglu A, Agren R, Kampf C, Asplund A, Uhlen M, Nielsen J. Genome‐scale metabolic modelling of hepatocytes reveals serine deficiency in patients with non‐alcoholic fatty liver disease. Nat Commun 2014;5:3083. [DOI] [PubMed] [Google Scholar]
- 48. Newgard CB, An J, Bain JR, Muehlbauer MJ, Stevens RD, Lien LF, et al. A branched‐chain amino acid‐related metabolic signature that differentiates obese and lean humans and contributes to insulin resistance. Cell Metab 2009;9:311‐326. [DOI] [PMC free article] [PubMed] [Google Scholar]
- 49. Ishii Y, Suzuki S, Kohno T, Aoki M, Kohno T, Ito A, et al. L‐[1‐ 13 C] phenylalanine breath test reflects histological changes in the liver. J Surg Res 2003;114:120‐125. [DOI] [PubMed] [Google Scholar]
- 50. Maier L, Pruteanu M, Kuhn M, Zeller G, Telzerow A, Anderson EE, et al. Extensive impact of non‐antibiotic drugs on human gut bacteria. Nature 2018;555:623‐628. [DOI] [PMC free article] [PubMed] [Google Scholar]
Associated Data
This section collects any data citations, data availability statements, or supplementary materials included in this article.
Supplementary Materials
Supplementary Material