

Abstract
Short telomeres are a principal defining feature of telomere biology disorders, such as dyskeratosis congenita (DC), for which there are no effective treatments. Here, we report that primary fibroblasts from DC patients and late generation telomerase knockout mice display lower nicotinamide adenine dinucleotide (NAD) levels, and an imbalance in the NAD metabolome that includes elevated CD38 NADase and reduced poly(ADP‐ribose) polymerase and SIRT1 activities, respectively, affecting many associated biological pathways. Supplementation with the NAD precursor, nicotinamide riboside, and CD38 inhibition improved NAD homeostasis, thereby alleviating telomere damage, defective mitochondrial biosynthesis and clearance, cell growth retardation, and cellular senescence of DC fibroblasts. These findings reveal a direct, underlying role of NAD dysregulation when telomeres are short and underscore its relevance to the pathophysiology and interventions of human telomere‐driven diseases.
Keywords: CD38 NADase, mitochondrial impairment, NAD metabolism, replicative senescence, telomere biology disorders
Subject Categories: DNA Replication, Repair & Recombination; Metabolism; Molecular Biology of Disease
Decreased levels of the essential cofactor nicotinamide adenine dinucleotide (NAD) are causally linked to telomere shortening in mouse models and patients suffering from the telomere maintenance disorder, dyskeratosis congenita.
Introduction
Telomeres consist of tandem DNA nucleotide repeats and a protein complex that is crucial in protecting chromosome ends by preventing their recognition as damaged DNA. Telomeres shorten with each cell division due to the inability of DNA polymerases to fully replicate the 3′ ends of DNA. Telomere dysfunction can arise by loss of telomeric DNA repeats or loss of protection by the telomeric protein complex, that in turn elicit a DNA damage response, and loss of cell proliferation leading to senescence or apoptosis (d'Adda di Fagagna et al, 2003). In humans, short telomeres are a key feature of telomere biology disorders and are associated with aging and age‐related pathologies that underscore the important role of telomere maintenance in aging and disease (Armanios, 2005; Bertuch, 2016; Savage, 2018). Patients with the telomere biology disorder dyskeratosis congenita (DC) have very short telomeres at a young age due to germline mutations of key telomere maintenance genes, including DKC1, TERT, TERC, TINF2, and RTEL1 (Dokal et al, 2015). Patients with DC have a high risk of bone marrow failure, cancer, and numerous other conditions. Emerging evidence suggests a crucial role for critically short telomere‐induced DNA damage signaling in cellular dysfunction in DC (Armanios, 2013; Bertuch, 2016; Savage, 2018). However, other cellular defects, including mitochondrial impairment, which may promote telomeric DNA damage and accelerate telomere shortening, could be contributing factors in the physiopathology of DC. It is possible that critically short telomeres drive the activities of DNA repair enzymes that are known to consume the central cellular metabolite, nicotinamide adenine dinucleotide (NAD or NAD+), which, if depleted, could contribute to DC.
NAD and its reduced form, NADH, act as coenzymes in redox reactions in energy metabolism, such as the tricarboxylic acid cycle, glycolysis, fatty acid beta‐oxidation, and oxidative phosphorylation. A decline in NAD levels has emerged as an important hallmark of aging. Intracellular NAD levels are greatly influenced by the NAD salvage pathway, consisting of several NAD biosynthesis and consumption enzymes (Canto et al, 2015; Verdin, 2015; Chini et al, 2017; Fang et al, 2017). The NAD biosynthesizing enzymes include nicotinamide/nicotinic acid mononucleotide adenylyltransferase (NMNAT) and nicotinamide phosphoribosyltransferase (NAMPT), which convert the NAD precursors, nicotinamide (NAM) and mononucleotide (NMN), into NAD. NAD is utilized by three types of NAD‐consuming enzymes: CD38 NADase/cyclic ADP‐ribose synthases, poly(ADP‐ribose) polymerases (PARPs), and sirtuins (SIRTs). CD38 hydrolyzes NAD to produce ADP‐ribose or a precursor of the second messenger molecule, cyclic ADP‐ribose, and NAM. SIRTs are a group of NAD‐dependent deacylases, and PARPs catalyze the transfer of the first ADP‐ribose unit from NAD to target molecules.
The NAD‐consuming enzymes compete for bioavailable NAD. Thus, hyperactivity of one NAD‐consuming pathway may limit the activities of the others, consequently affecting their cellular functions. CD38 is the major NADase in mammalian cells and determines intracellular NAD levels. It has been shown that CD38 knockout mice display significantly increased NAD concentrations and increased SIRT deacylase activities (Camacho‐Pereira et al, 2016). CD38 increases with aging and may contribute to age‐related NAD decline (Camacho‐Pereira et al, 2016; Schultz & Sinclair, 2016). However, the mechanisms underlying this age‐dependent increase in CD38 expression is unclear.
The other two key NAD‐consuming activities include sirtuins such as Sirtuin1 (SIRT1), and PARPs. SIRT1 participates in the deacetylation of several proteins, including p53, and in the activation of the peroxisome proliferator‐activated receptor γ coactivator‐1α (PGC‐1α), which together have been implicated in the regulation of the DNA damage response and mitochondrial homeostasis (Fernandez‐Marcos & Auwerx, 2011; Morris, 2013; Tang, 2017). Increasing NAD levels enhance SIRT1 activity, leading to increased PGC‐1α expression and mitochondrial biogenesis (Yang et al, 2014; Canto et al, 2015). The major PARP family protein, PARP1, plays a critical role in genome maintenance and is involved in DNA repair (Yap et al, 2019; Eisemann & Pascal, 2020). NAD consumption by PARP1 is mostly increased during genotoxic stress due to protein ADP‐ribosylation (PARylation). Persistent activation of PARP1 results in a significant decrease in cellular NAD, as reported in DNA repair‐deficient rodent and human cells (Fang et al, 2014, 2016; Mendelsohn & Larrick, 2017).
NAD bioavailability decreases in aged and DNA repair‐deficient animal models with premature aging phenotypes, while supplementation with the NAD intermediate, nicotinamide riboside (NR), improves their NAD levels, mitochondrial health, genome maintenance, and health span (Fang et al, 2014, 2016; Mendelsohn & Larrick, 2017). Telomere attrition and low NAD levels are key features of aging; however, how they are interconnected remains unclear. In this study, we utilized a human DC disease model and late generation telomerase null mice to investigate the relationship among critically short telomeres/telomere dysfunction, the NAD metabolome, mitochondrial maintenance, and replicative senescence. Our findings indicate that critically short telomeres/telomere dysfunction leads to loss of NAD homeostasis and establish a new linkage between dysfunctional telomeres and mitochondria that contributes to the deleterious consequences of telomere dysfunction. The NAD mechanism‐based intervention strategies developed in this study may serve as a stepping stone for the future treatment of human telomere biology disorders such as DC.
Results
Human and mouse models with critically short telomeres/telomere dysfunction exhibit a CD38‐associated loss of NAD
Both telomere length and NAD decline with age and have been implicated as potential causes of age and disease‐related cellular dysfunction, including mitochondrial impairment (Lopez‐Otin et al, 2013; Camacho‐Pereira et al, 2016). To examine the impact of critically short telomeres/telomere dysfunction on NAD metabolites, we determined intracellular NAD levels and NAD/NADH ratios in primary skin fibroblasts isolated from patients with DC harboring germline mutations in the key telomere maintenance genes (DC1–DC8) and from age‐matched healthy individuals (Con 1–Con 4) (Appendix Table S1). Overall, DC fibroblasts displayed lower NAD levels and lower NAD/NADH ratios, in comparison with control fibroblasts (Fig 1A and B). NAD and its reduced form, NADH, are coenzymes in redox reactions during energy biosynthesis (Canto et al, 2015; Verdin, 2015; Yang & Sauve, 2016; Chini et al, 2017; Fang et al, 2017). We thus investigated the impact of lower NAD levels and NAD/NADH ratios on intracellular ATP levels in DC fibroblasts and found that DC fibroblasts exhibited increased ADP/ATP ratios and decreased ATP levels (Appendix Fig S1A and B). In line with this observation, DC cells showed increased expression of phosphorylated AMP‐activated protein kinase (pAMPK) (Appendix Fig S1C), which is known to be activated by an elevated ADP/ATP ratio (Lin & Hardie, 2018).
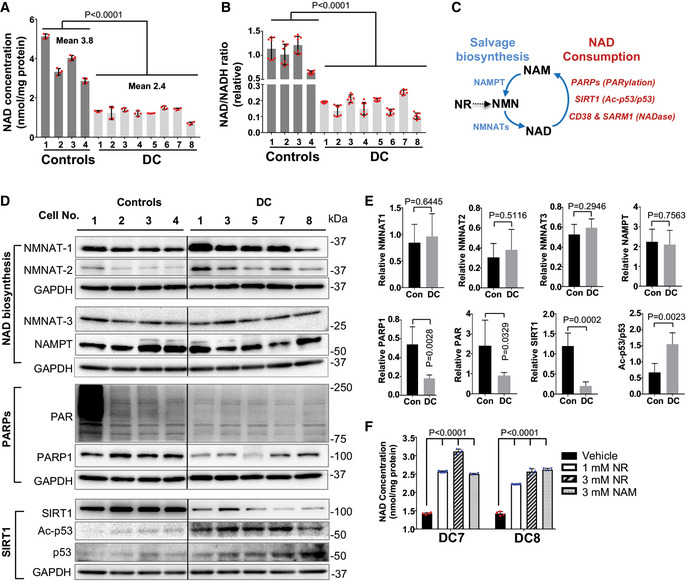
Figure 1. DC patient fibroblasts exhibit defects in NAD metabolism and NAD‐dependent PARylation and SIRT1 deacetylation activity.
-
A, BIntracellular NAD levels and NAD/NADH ratio in DC and age‐matched healthy control fibroblasts. All values are presented as mean ± SD of four and eight replicates in (A) and (B), respectively. Student's t‐test was performed on DC cells vs controls.
-
CAn overview of NAD metabolism. The activity of NAD‐consuming enzymes, such as PARPs, SIRTs, or CD38 consumes NAD and results in NAM production. The NAD biosynthesizing enzymes NMNATs and NAMPT recycle NAM back to NMN and then NMN to NAD, respectively. NR is converted to NMN, followed by conversion of NMN to NAD.
-
D, EImmunoblots of the expression of NAD synthesis and consuming proteins, and their activities in DC and control cells. Protein levels are normalized to GAPDH. Quantification values are presented as mean ± SD of four controls vs five DC samples as shown in (D). Student's t‐test was performed on DC cells vs controls. Con: control fibroblasts. Irrelevant intervening lanes in (D) have been removed for clarity (full blots are available online as Source Data).
-
FEffects of NR and NAM supplementation (24 h) on the NAD levels in DC fibroblasts. All values are presented as mean ± SD of four replicates. One‐way ANOVA was performed on DC cells in indicated conditions.
Source data are available online for this figure.
To determine the factors contributing to lower NAD levels, we examined NAD biosynthesis and consumption in DC fibroblasts (Fig 1C). We assessed protein expression levels of the NAD synthesis enzymes NAMPT and three nicotinamide mononucleotide transferases NMNAT‐1, NMNAT‐2, and NMNAT‐3, which are all required for NAD synthesis (Canto et al, 2015; Verdin, 2015; Chini et al, 2017; Fang et al, 2017). In comparison with the control fibroblasts, DC fibroblasts showed a slight trend toward increased NMNAT‐1 and NMNAT‐2 expression, but no substantial change in NMNAT‐3 and NAMPT (Fig 1D and E). Thus, it appears unlikely that altered levels of NAMPT and NMNATs underlie the NAD decline in DC fibroblasts. It remains possible, however, that increased NMNAT‐1 and NMNAT‐2 expression could represent a positive‐feedback mechanism to replenish NAD in DC fibroblasts. We also found that DC fibroblasts efficiently converted NAM (a substrate for NAD biosynthesis) to NAD (Fig 1F), supporting that NAD biosynthesis is intact in DC cells.
To determine which NAD‐consuming enzymes were responsible for NAD decline in DC cells, we assessed the protein expression and enzymatic activity of PARP1, SIRT1, and CD38 in DC fibroblasts. In comparison with the age‐matched control fibroblasts, DC fibroblasts exhibited reduced PARP1 protein levels and PARylation activities (Fig 1D and E). DC fibroblasts also displayed reduced SIRT1 protein levels and reduced deacetylation activity, as indicated by increased acetylation of the SIRT1 substrate, p53 (Fig 1D and E). Moreover, DC fibroblasts showed a significant reduction in PARylation and acetylation status of p53, when treated with the PARP1 inhibitor (0.5 μM Olaparib) and/or the SIRT1 inhibitor (1 μM EX527) (Appendix Fig S2A). The effectiveness of SIRT1 inhibition in the deacetylation of p53 was further confirmed in human BJ fibroblasts exposed to doxorubicin, a DNA damaging agent that enhances p53 expression and acetylation (Appendix Fig S2B). We found that the PARP1 and/or SIRT1 inhibitors had little impact on the NAD levels in DC fibroblasts (Appendix Fig S2C). These results support that PARylation and SIRT1‐deacetylation activities in DC fibroblasts are unlikely to contribute to NAD decline. To determine whether low NAD levels were responsible for the reduced PARylation and SIRT1‐deacetylation activities in DC fibroblasts, we cultured DC fibroblasts with the NAD precursor, NR. NR is converted to NMN by NRK1/2 synthesizing enzymes, followed by conversion of NMN to NAD by NMNATs. The ability of NR to be converted to NAD without NAMPT distinguishes NR as an efficacious agent, which has been widely used to improve age‐dependent NAD decline (Bieganowski & Brenner, 2004; Yoshino et al, 2018). Notably, short‐term (72 h) NR supplementation at various concentrations significantly increased the NAD levels and the NAD/NADH ratios in DC fibroblasts (Fig 1F and Appendix Fig S2D) and control fibroblasts (Appendix Fig S3), which suggests that NR is efficiently converted to NAD in these cells. Most importantly, NR treatment boosted the NAD‐dependent PARylation and SIRT1 deacetylation of p53 in DC fibroblasts (Appendix Fig S2E and F).
Elevated CD38 expression significantly contributes to the NAD decline observed during aging (Camacho‐Pereira et al, 2016). Overall, CD38 expression was elevated in DC fibroblasts, relative to the control cells (Fig 2A). This elevation in CD38 expression in DC fibroblasts was ameliorated upon treatment with an ATM inhibitor and was accompanied by reduced ATM phosphorylation and increased γH2AX (Fig 2B), while ATM inhibition did not affect CD38 expression in the control fibroblasts (data not shown). These data support the notion that a telomere‐induced DNA damage response (DDR) contributes to CD38 overexpression in DC cells.
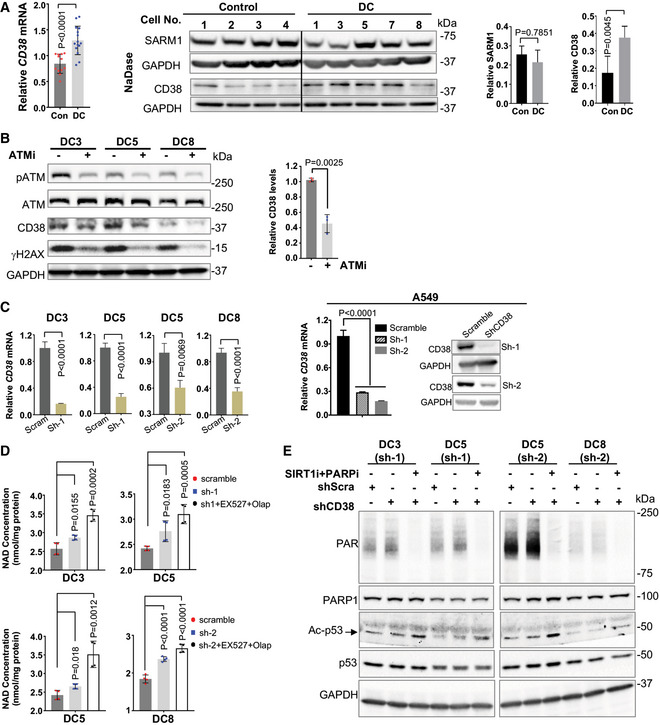
Figure 2. CD38 depletion ameliorates dysregulated NAD metabolism in DC cells.
-
AQuantitative RT‐PCR and immunoblots of the expression of CD38 and SARM1 in DC and age‐matched health control fibroblasts. All values are presented as mean ± SD of three replicates in quantitative RT‐PCR. Protein levels are normalized to GAPDH, and mean (± SD) quantification values of four controls vs five DC samples are shown. Student's t‐test was performed on DC cells vs controls. Irrelevant intervening lanes have been removed for clarity (full blots are available online as Source Data).
-
BImmunoblots and quantification of indicated proteins in DC fibroblasts treated with DMSO and with 2 μM ATM inhibitor, KU‐55933 for 48 h. Mean (± SD) quantification values of three DC lines with and without ATMi treatment are shown. P values on the basis of Student's t‐test.
-
CThe efficacy of CD38 shRNA (sh‐1 and sh‐2) was verified by quantitative RT‐PCR in DC fibroblasts and by RT‐PCR and immunoblots in A549 cells. The relative CD38 mRNA values in the CD38 knockdown cells were normalized to the scrambled shRNA. All values are presented as mean ± SD of three replicates. Student's t‐test was performed on DC and A549 cells in indicated conditions.
-
D, EIntracellular NAD levels and immunoblots of the expression of indicated proteins in the scramble and CD38 knockdown DC fibroblasts. The CD38 knockdown DC fibroblasts were treated with the PARP1 inhibitor Olaparib (400 nM) and the SIRT1 inhibitor EX 527 (1 μM) for 24 h. All values are presented as mean ± SD of four replicates. One‐way ANOVA was performed on DC cells in indicated conditions.
Source data are available online for this figure.
To bolster the direct role of CD38 overexpression in NAD dysregulation in DC cells, we generated CD38 knockdown DC fibroblasts using the lentiviral CD38 shRNA (Fig 2C). The efficacy of CD38 shRNA (sh‐1 and sh‐2) was further verified in a human lung cancer cells line, A549 (Fig 2C). CD38 knockdown led to a moderate increase in the NAD levels in DC fibroblasts, in comparison with the scrambled shRNA control (Fig 2D). We noticed that CD38 knockdown boosted NAD consumption by PARPs (Fig 2E), suggesting that PARPs are responsible for clearance of accumulated NAD upon CD38 inhibition in DC cells. A slight increase in SIRT1 deacetylation of p53 was also observed in CD38 knockdown DC fibroblast (Fig 2E). In support of this notion, NAD levels were significantly elevated in the CD38 knockdown DC fibroblasts when PARP1 and SIRT1 NAD‐consuming activities were inhibited (Fig 2D). It is noteworthy that PARP1 and SIRT1 inhibition had little impact on the NAD levels in DC fibroblasts (Appendix Fig S2C). These genetic validation experiments were further supported via chemical inhibition of CD38 in DC fibroblasts using the CD38‐specific inhibitor, 78c (Tarrago et al, 2018). Cell were treated with 78c (1 μM) for 48 h and assessed for intracellular NAD levels. 78c treatment moderately increased the NAD levels in DC fibroblasts, compared with the vehicle‐treated DC fibroblasts (Appendix Fig S4). This increase in NAD was further elevated when 78c was combined with the PARP1 and SIRT1 inhibitors (Appendix Fig S4A) or with low dose NMN (Appendix Fig S4B). Lastly, we found that the expression of another NADase, sterile alpha and Toll/interleukin receptor motif‐containing protein 1, SARM1 (a regulator of mitochondrial respiration (Muraki et al, 2013)), was comparable in DC and control fibroblasts (Fig 2A). Collectively, our results suggest that CD38 overexpression contributes to NAD dysregulation in DC fibroblasts.
To further verify that CD38 overexpression contributes to the loss of NAD homeostasis in cells with critically short telomeres/telomere dysfunction, we utilized telomerase reverse transcriptase null (Tert −/−) mice (Liu et al, 2000). Tert is the catalytic core component of telomerase, and Tert −/− mice display loss of telomerase activity and a gradual decrease in telomere length with successive generations. Generation one (G1) and three (G3) Tert −/− mice possess intermediate and critically short telomere lengths, respectively (Liu et al, 2000; Erdmann et al, 2004). Due to the high expression and activity of CD38 and the age‐dependent changes of NAD contents in brains (Zhu et al, 2015), we examined the NAD metabolome in G1 and G3 Tert −/− brain tissues. In comparison with G1 Tert −/− mice, G3 Tert −/− brain tissues exhibited lower NAD levels (Fig 3A). Notably, CD38 expression (Fig 3B and C) and NADase activity (Fig 3D) were significantly higher in G3 Tert −/− brain tissues. In contrast, Parp1 and Sirt1 protein levels and their corresponding NAD‐consuming activities, evident by PARylation and p53 acetylation status, were significantly reduced (Fig 3B and C). Collectively, our results suggest that CD38 overexpression contributes to lower NAD levels and to altered NAD signaling in human and mouse models with critically short telomeres.
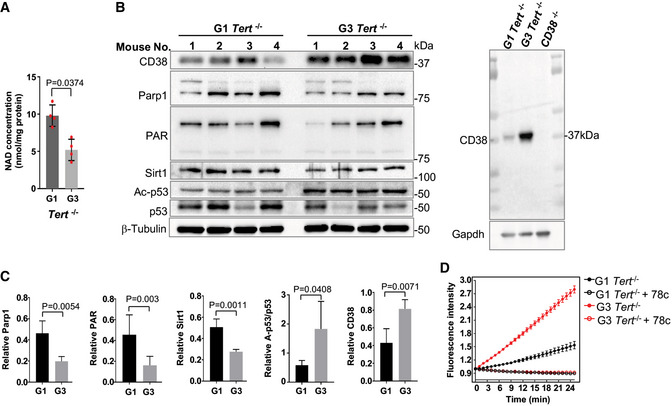
Figure 3. G3 Tert −/− mice display defects in the NAD metabolism.
-
A, BIntracellular NAD levels and immunoblots of the expression of NAD consuming‐related proteins and their activities in brain tissues from 6‐month‐old G1 and G3 Tert −/− female mice. The CD38 antibody was validated using the CD38 −/− mouse brain tissues.
-
CQuantification of immunoblots from the indicated proteins in (B).
-
DNADase activity in G1 and G3 Tert −/− mouse brain lysate was determined at various time points during the reaction. NADase activity was not detectable in the extracts treated with the CD38 inhibitor, 78c, at a concentration of 50 nM.
Defects in the NAD‐SIRT1‐mitochondrial/mitophagy axis in DC fibroblasts are ameliorated by NAD intervention
NAD‐consuming enzymes are vital to the signaling networks that contribute to mitochondrial health (Canto et al, 2015; Verdin, 2015; Chini et al, 2017; Fang et al, 2017) (Appendix Fig S5A). One target of the NAD‐consuming enzyme SIRT1 is PGC‐1α, a master regulator of mitochondrial biogenesis. A previous study reported that telomere attrition/dysfunction led to repression of PGC‐1α and mitochondrial dysfunction in mice (Sahin et al, 2011). Because DC fibroblasts have lower SIRT1 levels and SIRT1 deacetylation activity, relative to the age‐matched healthy control fibroblasts (Fig 1D), we investigated PGC‐1α expression and mitochondrial parameters in DC fibroblasts. In comparison with the control fibroblasts, DC fibroblasts expressed lower levels of PGC‐1α (Appendix Fig S5B). Due to the poor growth status of DC1‐DC8 cells in normoxic conditions, the oxygen consumption rate in DC cells was inconsistent among experiments (data not shown). Nevertheless, DC fibroblasts exhibited significantly higher cellular and mitochondrial generation of reactive oxygen species (ROS) (Appendix Fig S5C). Mitochondrial membrane potential (MMP) and mitochondrial content were also increased in most DC lines (Appendix Fig S5C). These results are in agreement with previous observations in telomerase null mice (Sahin et al, 2011), demonstrating that telomere attrition/dysfunction correlates with a defective SIRT1‐mitochondrial axis in DC.
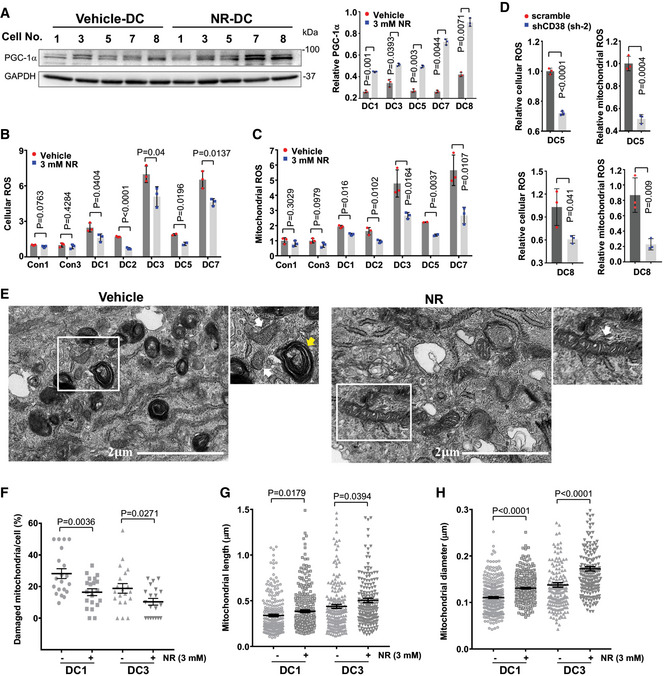
To investigate whether NAD levels affected the SIRT1‐mitochondrial axis in DC cells, DC and control fibroblasts were supplemented with 1 and 3 mM NR, respectively, for 2 weeks. NR treatment led to an increase in PGC1‐α protein expression (Fig 4A). In line with these results, NR treatment diminished cellular and mitochondrial ROS levels in DC fibroblasts (Fig 4B and C). Similarly, CD38 knockdown led to a decline in cellular and mitochondrial ROS levels in DC fibroblasts (Fig 4D). We also assessed the effect of NR on mitochondrial morphology in DC fibroblasts. Electron microscopy analysis demonstrated that mitochondria exhibited a rounded, swollen shape in DC fibroblasts. In contrast, the mitochondria appeared elongated/ellipsoidal after NR supplementation (Fig 4E, white arrows). NR‐treated DC fibroblasts showed a decrease in the occurrence of damaged mitochondria, characterized by morphological aberrations, e.g., membrane ruptures, vacuole formation and disarrayed cristae (Fig 4E and F), and an increase in the frequency of healthy mitochondria, illustrated by increased mitochondrial length and mitochondrial diameter (Fig 4G and H and Appendix Fig S5D). Thus, NR supplementation diminished mitochondrial damage in DC fibroblasts.
Figure 4. NAD intervention impacts mitochondrial parameters of DC fibroblasts.
-
ARepresentative immunoblots of the expression of PGC1‐1α in DC cells treated with vehicle or 3 mM NR. Quantification of the indicated proteins is from three immunoblots.
-
B–DCellular and mitochondrial ROS in DC and age‐matched healthy control cells supplemented with vehicle and NR (B, C) and in the scramble and CD38 knockdown DC cells (D) were measured by flow cytometry from three replicates.
-
ERepresentative images captured by transmission electron microscopy of DC1 cells treated with vehicle or NR. White arrows: mitochondria. Yellow arrow: autophagosome‐like structures with engulfed mitochondria. Enlarged image within white frame is shown.
-
F–HQuantifications of percentage of damaged mitochondria per cell (F), mitochondrial length (G), and mitochondrial diameter (H). A minimum of 200 mitochondria counted per group.
It has been reported that NAD precursors improve the turnover of defective mitochondria via a SIRT1‐dependent mitophagy process (Jang et al, 2012) (Appendix Fig S5A). Interestingly, electron microscopy analysis revealed that DC cells displayed autophagosome‐like structures, some of which had engulfed mitochondria with morphological aberrations (Fig 4E, yellow arrows). The accumulation of these structures implicates a retarded mitophagic process to remove damaged mitochondria in DC fibroblasts. In addition, relative to the controls, DC fibroblasts expressed lower levels of PINK1 and PARKIN, both of which are crucial to initiate mitophagy to eliminate dysfunctional mitochondria (Appendix Fig S5B). Consistently, DC fibroblasts exhibited reduced mitophagy, illustrated by reduced co‐localization of “mtphagy” dye with the lysosome dye (Fig 5A and B). In contrast, NR‐treated DC fibroblasts had significantly increased mitophagy (Fig 5A and B) and PINK1 and PARKIN expression (Fig 5C). Taken together, our results indicate that lower NAD levels perturb the NAD‐SIRT1‐mitochondrial/mitophagy axis and contribute to altered mitochondria/mitophagy in DC fibroblasts, which is ameliorated by NR supplementation.
Figure 5. Impaired mitophagy process in DC fibroblasts is improved by NR supplementation.
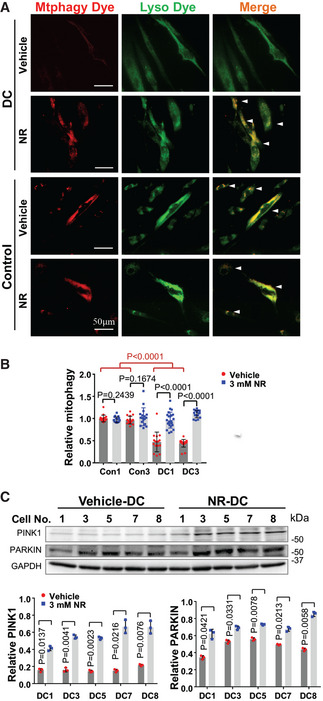
- Representative images of mitophagy showing co‐localization between the mitophagy dye (red) and the lysosome dye (green) in DC and control fibroblasts treated with vehicle or 3 mM NR. White arrows: mitophagy.
- The mean value of fluorescence intensity/cells in each image was scored. At least 15 images (˜ 200 cells) were counted per group. The relative values in each group were normalized to Con1.
- Representative immunoblots of the expression of PINK1 and PARKIN in DC cells treated with vehicle or 3 mM NR. Quantification of immunoblots from the indicated proteins is from three replicates.
NR supplementation reduces steady‐state levels of telomeric oxidative DNA lesions and telomere dysfunction‐induced DNA damage foci formation
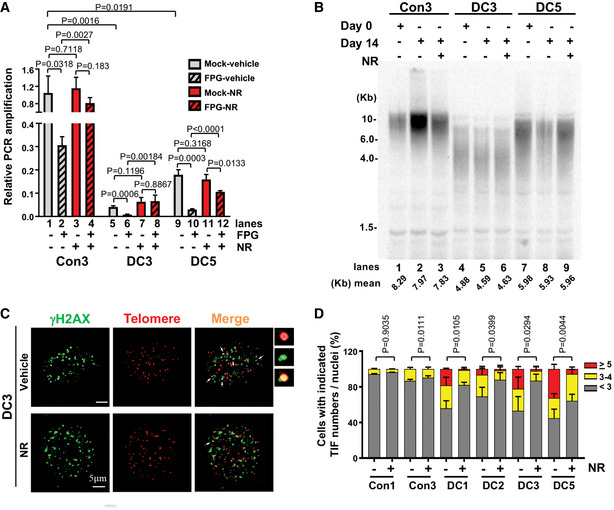
Telomere repeats contain guanine triplets and thus are particularly sensitive to oxidative stress (Sarkar & Liu, 2016). Excessive ROS in DC cells may therefore exacerbate oxidative DNA damage at telomeres. Since NR supplementation reduces cellular and mitochondrial ROS in DC fibroblasts (Fig 4B and C), we investigated the underlying beneficial effects of NR on alleviating telomere DNA defects. First, we quantitatively assessed telomere length in DC and age‐matched healthy control fibroblasts by quantitative telomere PCR (Cawthon, 2002; O'Callaghan et al, 2012), under conditions in which cells were mock‐treated or supplemented with NR. Compared with the control fibroblasts, DC fibroblasts possessed a significantly reduced telomere PCR amplification (Fig 6A, lanes 1 vs 5 and 9). Similarly, DC peripheral blood mononuclear cells showed short telomere lengths, in comparison with age‐matched controls by telomere flow cytometry with fluorescence in situ hybridization analysis (Appendix Table S1 and Fig S6). Next, we examined the impact of NR supplementation on telomere length in DC fibroblasts. After NR supplementation, no significant difference in telomere PCR amplification was observed between mock and NR treatment in either DC or control fibroblasts (Fig 6A, lanes 1 vs 3, lanes 5 vs 7, and lanes 9 vs 11). Thus, NR is unable to replenish short telomeres in DC fibroblasts. In agreement with these observations, telomere restriction fragment analysis showed that DC fibroblasts possessed a significantly reduced telomere length, in comparison with the healthy control fibroblasts (Fig 6B, lanes 1 vs 4 and 7). After NR supplementation, no significant change in telomere length was observed in either DC or control fibroblasts (Fig 6B, lanes 3 vs 2, lanes 6 vs 5, and lanes 9 vs 8).
Figure 6. NR supplementation reduces telomeric oxidative DNA lesions and TIF formation in DC cells.
-
APCR amplification efficiency at the telomere in the mock‐ and FPG‐treated DC and age‐matched healthy control fibroblasts supplemented with vehicle or 3 mM NR. All values are presented as mean ± SD of three replicates. The relative telomere PCR amplification in each sample was normalized to the 36B4 reference gene.
-
BTelomere restriction fragment analysis in DC and control fibroblasts treated with vehicle or 3 mM NR. Genomic DNA was isolated from the indicated cell lines at 0 or 14 days, with or without 3 mM NR treatment. At left, DNA molecular mass markers, in kilobase pairs (Kb).
-
C, DRepresentative images of γH2AX (green), telomere immuno‐FISH (red) in DC cells treated with vehicle or 3 mM NR. White arrows: co‐localization of γH2AX foci and telomeric DNA (or TIF). Enlarged views of co‐localizing foci are shown at the right panel and in Fig EV1. Percentage of DC and control cells with indicated TIFs per nuclei. Approximately 100 cells per condition were scored.
To quantitatively assess oxidative guanine lesions in telomeric DNA in DC and control fibroblasts, genomic DNA was treated in vitro with mock buffer alone or with the formamidopyrimidine DNA‐glycosylase enzyme (FPG) that excises oxidized guanine lesions, resulting in DNA nicks at those sites. Thus, samples with higher levels of oxidized guanine bases would have less intact DNA. To quantify the levels of intact DNA in telomeres, we performed quantitative telomere PCR on mock‐ and FPG‐treated DC and control fibroblasts. After FPG treatment, DC and control fibroblasts showed a significant decrease in telomere PCR amplification (Fig 6A, lanes 2 vs 1, 6 vs 5, 10 vs 9), suggesting the presence of oxidized bases in their telomeres. We then evaluated telomeric oxidative guanine lesions in DC and control fibroblasts treated with 3 mM NR for 2 weeks. FPG‐treated DC and control fibroblasts with NR supplementation exhibited significantly improved telomere PCR amplification compared with those not treated with NR (Fig 6A, lanes 4 vs 2 [2.6‐fold change], 8 vs 6 [3.5‐fold change], 12 vs 10 [8.1‐fold change]). Thus, NR promoted oxidative DNA base repair at telomeres in both DC and control fibroblasts, with more repair observed in DC cells.
PARylation is an important cellular DNA damage signaling process, which is diminished in DC cells (Fig 1D). Conversely, NR supplementation enhances PARylation (Appendix Fig S2E) in DC fibroblasts. In addition, CD38 inhibition ameliorates age‐related DNA damage, including telomeric loci in mice (Tarrago et al, 2018). Thus, we measured the presence of γH2AX at telomeres (or telomere dysfunction‐induced foci [TIFs]) (d'Adda di Fagagna et al, 2001) in DC and control fibroblasts, treated with 3 mM NR for 2 weeks. The percentage of cells with < 3, 3–4, ≥ 5 of TIFs per nucleus was determined by the co‐localization of γH2AX foci and telomere DNA using indirect immunostaining and telomere fluorescence in situ hybridization (d'Adda di Fagagna et al, 2001). In comparison with control fibroblasts, DC fibroblasts harbored more TIFs per nucleus. After 2 weeks of NR treatment, the percentage of DC fibroblasts with higher TIF numbers was significantly reduced (Figs 6C and D, and EV1). We noted a slight decrease in total γH2AX foci in DC fibroblasts with NR treatment, but it did not reach statistical significance (data not shown). Collectively, our results demonstrate that telomeres in DC fibroblasts are highly susceptible to oxidative base damage and TIFs, and that NR suppresses this telomere DNA damage.
Figure EV1. TIF formation in DC cells.
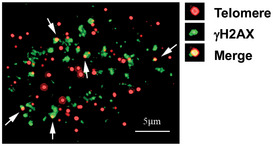
Enlarged view of the upper right panel of Fig 6C, showing a representative image with γH2AX (green) and telomere immuno‐FISH (red) in a DC cell. White arrows: co‐localization of γH2AX foci and telomeric DNA (or TIF). Enlarged view of co‐localizing foci is shown at the right panel.
NAD intervention mitigates cellular senescence and suppresses the senescence‐associated secretory phenotype (SASP) in DC fibroblasts
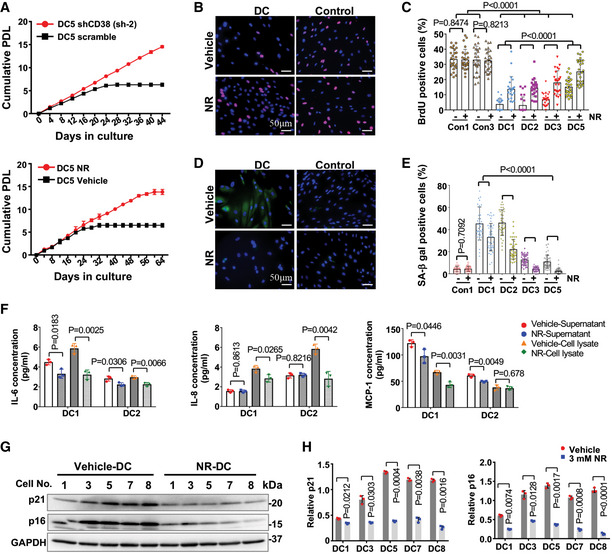
Recent studies demonstrate that increasing NAD levels by supplementation with NAD precursors ameliorate some age‐related pathologies and increase life span and health span in animals (Fang et al, 2016; Frederick et al, 2016; Mills et al, 2016; de Picciotto et al, 2016; Zhang et al, 2016; Mitchell et al, 2018; Vannini et al, 2019). Telomere loss leads to a DNA damage response, resulting in growth retardation and replicative senescence (d'Adda di Fagagna et al, 2003). Therefore, we evaluated the effects of CD38 knockdown and NR supplementation (1 and 3 mM, respectively) on the proliferative capacity of DC fibroblasts during prolonged culture in a 3% v/v oxygen incubator. DC fibroblasts were split once every 4 days and counted to determine population doublings. We observed that DC fibroblasts ceased to divide after a few passages in culture, while CD38 knockdown significantly extended the proliferative capacity of DC fibroblasts (Fig 7A and Appendix Fig S7). Similarly, continuous supplementation of NR effectively extended the proliferative capacity of DC fibroblasts (Fig 7A and Appendix Fig S7). Continuous NR treatment resulted in a substantial increase in BrdU incorporation in DC fibroblasts (Fig 7B and C), demonstrating that NR promotes the proliferation of DC fibroblasts. We also found that continuous NR supplementation reduced the percentage of senescence‐associated β‐galactosidase (SA‐β‐gal)‐positive DC cells (Fig 7D and E). To explore whether continuous NR supplementation improves the senescence‐associated secretory phenomenon in DC fibroblasts, we quantified several cytokines and chemokines in both culture supernatants and cell lysates of DC fibroblasts with vehicle and NR treatment using a human cytokine array (Appendix Table S2). With NR treatment, the levels of IL‐6 in both culture supernatants and cell lysates were significantly decreased in DC fibroblasts (Fig 7F, Appendix Table S2). NR also reduced the levels of IL‐8 in the cell lysates and MCP‐1 in the supernatants of DC fibroblasts (Fig 7F, Appendix Table S2). Moreover, NR treatment significantly dampened the elevated levels of p16 and p21 in DC fibroblasts (Fig 7G and H). Taken together, our results demonstrate that NAD metabolism intervention via NR supplementation or CD38 knockdown delays the replicative senescence onset of DC cells.
Figure 7. NAD intervention improves the proliferative capacity and suppresses cellular senescence and SASP in DC fibroblasts.
-
ACumulative population doubling analysis of the proliferation of representative scramble and CD38 knockdown DC fibroblasts or DC fibroblasts treated with vehicle or 3 mM NR. Each data point is represented as mean ± SD of three replicates.
-
B, CRepresentative images of BrdU (red) and DAPI (blue) staining of DC and age‐matched healthy control fibroblasts treated with vehicle or NR. Percentage of BrdU‐positive cells per condition. Each dot represents the percentage of cells with BrdU staining per image. Approximately 400 cells were counted per condition. All values are presented as mean ± SD.
-
D, ERepresentative images of SPiDER‐β‐gal (green) and DAPI (blue) staining of DC and age‐matched healthy control cells treated with vehicle or 3 mM NR. Percentage of SA‐β‐gal-positive cells per condition. Each dot represents the percentage of cells with SA‐β‐gal staining per image. Approximately 400 cells were counted per condition. All values are presented as mean ± SD.
-
FThe levels of IL‐6, IL‐8, and MCP‐1 in both supernatant and cell lysate of indicated DC fibroblasts treated with vehicle or 3 mM NR. All values are represented as mean ± SD of three replicates.
-
G, HRepresentative immunoblots of p21 and p16 in DC fibroblasts treated with vehicle or 3 mM NR. Quantification of the indicated proteins is presented as mean ± SD from three immunoblots.
Discussion
Telomere attrition and mitochondrial dysfunction are hallmarks of biological aging (Lopez‐Otin et al, 2013), and defects in telomere maintenance contribute to telomere biology disorders (Armanios, 2013; Bertuch, 2016; Savage, 2018). Declining NAD levels have recently emerged as a feature of aging in humans and animal models (Mouchiroud et al, 2013; Verdin, 2015; Zhu et al, 2015; Camacho‐Pereira et al, 2016; Fang et al, 2017). Increased CD38 expression contributes to a decline of NAD metabolites and distorts other NAD‐consuming enzyme activities in aged mice (Camacho‐Pereira et al, 2016). However, the molecular basis linking these hallmarks/features of aging remains unclear. In this study, we revealed several insights—(i) DC cells and telomerase null mouse tissues with critically short telomere lengths have lower NAD levels and abnormal NAD consumption, associated with CD38 overexpression; (ii) DC cells are defective in the NAD‐consuming enzyme‐related signaling networks, including the NAD‐SIRT1‐PGC‐1α and NAD‐PARP axis; and (iii) NR supplementation and CD38 inhibition restore NAD‐consuming PARP and SIRT activities, alleviates p53 acetylation, telomere DNA damage, mitochondrial impairment, and cellular and mitochondrial ROS, and mostly importantly, delays the replicative senescence onset of DC fibroblasts. Our results support the idea that telomere attrition/dysfunction affects the NAD metabolisms and their related biological pathways, thereby contributing to telomere and mitochondrial abnormalities and cellular senescence. Our studies establish a molecular mechanism for how telomere attrition/dysfunction contributes to other hallmarks of aging and telomere biology diseases and pave the way for therapeutic intervention in telomere biology disorders.
Dyskeratosis congenita patient‐derived fibroblasts and late generation Tert null mouse tissues exhibit low NAD levels (Figs 1A and 3A), indicating abnormal activities of NAD biosynthesis and/or consumption enzymes in cells with short telomeres. Mammalian organisms rely on three groups of major NAD‐consuming enzymes to utilize NAD: PARPs, SIRTs, and CD38. Consumption of NAD results in a NAM by‐product, which is recycled back to NMN by the biosynthesizing enzyme NAMPT. NMN is then adenylated to NAD by NMNATs (Canto et al, 2015; Verdin, 2010; Chini et al, 2013; Fang et al, 2017). NAMPT is the rate limiting NAD biosynthesizing enzyme, and its expression declines with aging, which leads to a decreased intracellular NAD concentration (Ma et al, 2017). However, DC cells express comparable levels of NAMPT and NMNATs, relative to age‐matched healthy controls and efficiently convert NAM to NAD, which suggest that NAD biosynthesis is intact in DC cells (Fig 1). Among several NAD‐consuming enzymes, only CD38 expression was elevated (Fig 2A). In contrast, PARP1 and SIRT1 levels and their corresponding PARylation and deacetylation activities were diminished in DC fibroblasts and late generation Tert null tissues (Figs 1D and 3B). In addition, CD38 knockdown improves NAD consumption activities by PARP and SIRT1 in DC fibroblasts (Fig 2E), while PARP and SIRT1 inhibition had little impact on the NAD levels (Appendix Fig S2). Collectively, our results support that CD38 levels impact NAD metabolism in DC fibroblasts. Our finding is also in agreement with the reports showing that CD38 expression is elevated with age in mice and is associated with an age‐dependent decline of NAD, PARylation, and SIRT deacetylation activities (Camacho‐Pereira et al, 2016), while treatment of old mice with a CD38 inhibitor alleviates NAD levels and age‐related DNA damage, including telomeric loci (Tarrago et al, 2018).
Although the molecular basis leading to CD38 overexpression in mouse aging is unclear, we observed that ATM inhibition led to a decline in CD38 levels in DC fibroblasts (Fig 2B). Our findings support the notion that a telomere attrition/dysfunction‐induced DNA damage response results in hyperactivity of CD38, which drives the loss of NAD homeostasis, thereby limiting NAD bioavailability for PARP and SIRT enzymatic activities.
Telomere loss leads to a DNA damage response, resulting in growth retardation and replicative senescence, the latter induces the senescence‐associated secretory phenotypes (SASP) (Coppe et al, 2010). Recent studies have demonstrated that SASP induces CD38 expression (Chini et al, 2019; preprint: Covarrubias et al, 2019; Mendelsohn & Larrick, 2019). DC fibroblasts have limited replicative potential due to short telomere lengths. Nevertheless, the DC fibroblasts used in our cell population doubling analyses were at early passages, and entered senescence only after prolonged culture. In addition, we observed a reduction in CD38 levels via shRNA treatment can significantly delay entry of DC fibroblasts into replicative senescence (Fig 7A and Appendix Fig S7). Thus, our data support that CD38 acts upstream of SASP and its overexpression contributes to the replicative senescence of DC fibroblasts. Further investigation may also illuminate whether a SASP‐mediated induction of CD38 may further contribute to the pathophysiology of DC patients.
The NAD‐dependent PARylation and SIRT deacetylation activities participate in signaling networks that are involved in mitochondrial health, genome maintenance, and longevity (Canto et al, 2015; Verdin, 2015; Chini et al, 2017; Fang et al, 2017). For instance, a decline in NAD levels disrupts the SIRT1‐PGC‐1α‐mitochondrial biogenesis axis in aged mice, while enhancing NAD level restores mitochondrial function in a SIRT1‐dependent manner (Gomes et al, 2013; Morris, 2013). In addition to mitochondrial biogenesis, removal of damaged or dysfunctional mitochondria by mitochondrial autophagy (mitophagy) is critical for mitochondrial health. NAD modulates mitochondrial quality via SIRT1‐mediated mitophagy (Jang et al, 2012). In this study, we show that DC fibroblasts and late generation Tert null mouse tissues exhibit a concomitant decline in NAD levels (Figs 1A and 3A), SIRT1 deacetylation activity (Figs 1D and 3B), and PGC‐1α expression (Appendix Fig S5B). We also demonstrate that DC fibroblasts have an increase in mitochondrial abnormalities, including morphological aberrations and cellular and mitochondrial ROS levels (Fig 4 and Appendix Fig S5). Furthermore, we noted that DC fibroblasts exhibited significantly decreased mitophagy and decreased expression of the two key mitophagy‐initiating proteins, PINK1 and PARKIN (Fig 5 and Appendix Fig S5B). These abnormalities were largely corrected by NR supplementation (Figs 4 and 5, Appendix Fig S5D) or by reducing CD38 levels (Fig 4D). Based on these findings, we propose that a low NAD level limits SIRT1 function, which disrupts PGC‐1α‐mediated mitochondrial biogenesis and the SIRT1‐dependent mitophagy process, thereby contributing to mitochondrial abnormalities in DC fibroblasts. A recent study (Amano et al, 2019) suggested that mitochondrial dysfunction in telomerase knockout mice is attributed to telomere dysfunction‐induced p53 activation, which represses the expression of SIRTs and PGC‐1α. Interestingly, supplementation with a NAD precursor improves SIRT1 deacetylation activity, mitochondrial biogenesis, and thioacetamide‐induced liver fibrosis of telomerase knockout mice, but this pathological perturbation was only partly SIRT1‐dependent. Our findings reveal the relevance of CD38 hyperactivity‐mediated NAD dysregulation in human telomere‐driven diseases and suggest a new approach for effective intervention of NAD dysregulation via CD38 inhibition. Thus, both NAD dysregulation and p53 activation‐mediated reduction in SIRT1 expression may contribute to reduced SIRT1 deacetylation activity, which in turn impacted mitochondrial function and pathophysiology of short telomere models.
In addition to the inability to maintain telomere homeostasis observed in DC patients, mitochondrial impairment‐induced ROS may be a contributing factor in the physiopathology of DC, which may in turn lead to further telomeric DNA damage. Telomere repeats contain guanine triplets, which are sensitive to oxidative stress, in comparison with other bases or base combinations (Sarkar & Liu, 2016). Furthermore, DC cells have a robust decline in PARP1 and protein PARylation (Fig 1D), which may reduce telomere DNA repair. We have shown that NR supplementation reduces cellular and mitochondrial ROS and boosts cellular NAD, thereby increasing the available NAD to PARPs in DC fibroblasts (Fig 4B and C, and Appendix Fig S2D and E). This is coincident with improved telomere DNA integrity, as illustrated by reduced telomeric oxidative guanine lesions and TIFs (Fig 6). Thus, NAD metabolism‐related perturbations are not merely associated with loss of telomere integrity and telomere biology disorders, but may also contribute to their pathophysiology.
Telomere attrition, if left unchecked, will result in telomere uncapping, which in turn triggers a DNA damage response and the onset of accelerated cellular senescence in DC patient cells (Armanios, 2013; Bertuch, 2016; Savage, 2018). Here, we provide a hitherto unappreciated mechanism for the perturbations in NAD metabolism that occur when telomeres are short and establish a pharmacologically reversible role of dysregulated NAD metabolism in a human telomere disorder. We demonstrate that DC cells exhibit a deficit in NAD metabolites (Fig 1) and dysregulated NAD‐related pathways (Figs 1, 4, 5, and 6). Thus, telomere attrition/dysfunction may not only activate a DNA damage response, but may also disrupt NAD metabolism. We propose a model in which telomere attrition/dysfunction leads to CD38 dysregulation. We posit that CD38 excessively consumes NAD and reduces the available NAD to PARPs and SIRTs, thereby limiting their function in telomere and mitochondrial maintenance. Consequently, mitochondrial impairment‐induced ROS and defective PARP‐related genome repair may accelerate telomere dysfunction and severely reduce the proliferative lifespan of DC cells (Appendix Fig S8). In the future, it will be interesting to determine the in vivo significance of CD38 function under conditions of telomere dysfunction, for example in late generation telomerase null mice. The finding that NR supplementation and CD38 inhibition diminish mitochondrial and cellular ROS levels and telomere DNA damage, delay replicative senescence of DC cells, and exert a geroprotective effect on DC fibroblasts, together serve to underscore the critical involvement of a dysregulated NAD metabolome and associated pathways in telomere biology disorders.
Materials and Methods
Mice and human cell lines
The generation of Tert null and CD38 null mice was described previously (Liu et al, 2000; Partida‐Sanchez et al, 2001). Primary skin fibroblasts (DC1–8) derived from individuals with DC (Alter et al, 2018) and from age‐matched healthy controls (Con1–4) were listed in Appendix Table S1 and Supplementary Methods. Cells were cultured in an incubator at 37°C with 5% (v/v) CO2 and 3% (v/v) O2. Cells were supplemented with NR (40C910‐18206‐21, ChromaDex), β‐Nicotinamide mononucleotide (NMN; Sigma, N3501), 1 μM 78c (#538763, Millipore), PARP inhibitor, Olaparib (S1060, Selleckchem), SIRT1 inhibitor, EX 527 (S1541, Selleckchem), or ATM inhibitor KU‐55933 (ab120637, Abcam) in Gibco Dulbecco's modified Eagle's medium supplemented with 15% fetal bovine serum, penicillin‐streptomycin, and l‐glutamine, which was changed every 24 h. Population doubling level calculation was determined as described (Bischoff et al, 2012). All cell lines were negative for mycoplasma.
CD38 knockdown
Endogenous CD38 was depleted using a 3UTR‐targeting lentivirus (sh‐1) or the shRNA lentiviral cocktail (sh‐2) in A549 and DC fibroblasts, while the lentivirus with the scramble sequences was used as the negative control. The targeting sequences of shRNAs are shown as follows: shCD38 3UTR: 5′‐GCATACCTTTATTGTGATCTA‐3′ (SHCLNG‐NM_001775, Sigma). shCD38 cocktail: 5′‐CAAGGGTGCATTTATTTCA, CCACACCAAACCTCTCTTA, and CTTCCTACAGATAGTCAAA‐3′ (sc‐29996‐V, Santa Cruz Biotechnology). shScramble hairpin sequence: 5′‐CCTAAGGTTAAGTCGCCCTCGCTCGAGCGAGGGCGACTTAACCTTAGG‐3′ (1864, Addgene). The shRNA lentivirus was assembled by shRNA plasmids with pCMV‐dR8.2 packaging vector (8455; Addgene) and pCMV‐VSV‐G envelope vector (8454; Addgene) using Genjet Plus Reagent (SignaGen, SL100499) in 293T cells. The knockdown efficiency was determined by Western blot and quantitative RT‐PCR using the primer set (forward: AGACTGCCAAAGTGTATGGGA; reverse GCAAGGTACGGTCTGAGTTCC).
Detection of NAD level, NAD/NADH ratio, NADase activity, and intracellular ADP/ATP ratio
The NAD level and NAD/NADH ratio and the intracellular ADP/ATP ratio were measured using the NAD/NADH assay kit (#ab65348; Abcam) and the ADP/ATP Ratio Assay Kit (#ab65313, Abcam), respectively. NADase activity was determined using 1, N6‐etheno‐NAD (N2630, Sigma) as described previously (Aksoy et al, 2006).
SA‐β‐Gal staining, BrdU incorporation, and ELISA and cytokine array
β‐galactosidase activity was carried out using a SPiDER‐β‐galactosidase staining kit (#SG02‐10, Dojindo). DC cells were incubated with 100 μM BrdU (#B23151, Invitrogen) for 2 h and fixed with 4% PFA. BrdU incorporation was detected using monoclonal BrdU antibody (#ab6326, Abcam, 1:400). BrdU‐positive cells were observed using a fluorescence microscope at 20× magnification (Axio2, Carl Zeiss, Germany). The IL‐6 concentrations in cell culture supernatants were quantified using an ELISA kit (#D6050, R&D Systems) and by the human cytokine 42‐plex discovery array (Eve Technologies).
Quantification of telomere dysfunction‐induced foci, oxidized base lesions, and telomere length
Telomere dysfunction‐induced foci were detected by indirect immunofluorescence and telomere‐FISH using primary γH2AX antibody (#05‐636‐AF488, Millipore, 1:2,000) and Alexa Fluor 488 dye‐conjugated secondary antibody (#R37120, Invitrogen, 1: 500), followed by fixation and telomere‐FISH, as described previously (Wan et al, 2012). Images were acquired on an Axio2 microscope (Zeiss) and scored manually for TIFs, measured by the co‐localization of γ‐H2AX and telomere‐FISH signal. The levels of oxidative base lesions in telomeres were determined by relative PCR amplification in mock‐ and FPG‐treated samples in reference to the 36B4 gene using the method, as described previously (Livak & Schmittgen, 2001; O'Callaghan et al, 2012; Vallabhaneni et al, 2015).
Telomere length in human fibroblast and peripheral blood mononuclear cells was measured by quantitative telomere PCR (Cawthon, 2002; O'Callaghan et al, 2012) using the Bio‐Rad CFX Connect Real‐Time System, telomere flow cytometry with fluorescence in situ hybridization (Repeat Diagnostics, Inc. Vancouver, BC) (Brind'Amour & Lansdorp, 2011), and telomere restriction fragment analysis (Wan et al, 2013). In brief, cell pellets were collected at 0 or 14 days, with or without 3 mM NR treatment. Genomic DNA was isolated from fibroblasts using a DNA isolation kit (Qiagen) and digested by AluI, MboI, and RNase A. Digested DNA was separated on a 0.8% (w/v) agarose gel by electrophoresis, denatured with alkaline buffer (2.5 M NaCl, 1.5 M NaOH), and transferred to membrane. The hybridization was performed with a Telo‐C‐Biotin 5′‐(CCCTAA)3‐3′ probe (PNA Innovations) and Chemiluminescent Nucleic Acid Detection Module Kit (Thermo). The image was captured with Image Lab software (Bio‐Rad), and mean telomere length was calculated using Quantity One (Bio‐Rad) software.
Mitochondrial parameter and mitophagy assessment
Mitochondrial membrane potential, mitochondrial content, cellular ROS, and mitochondrial ROS levels were measured by a BD Accuri™ C6 flow cytometer as previously described (Scheibye‐Knudsen et al, 2012). To determine mitochondrial quality, ultra‐thin sectioning and transmission electron microscopic analysis were utilized to visualize the ultrastructure of DC cells with vehicle or NR treatment. Mitophagy assessment was performed using a commercial kit (#MD02, Dojindo).
Western blotting
Cells were harvested and dissolved in RIPA buffer (#89901, Thermo‐Fisher Scientific) supplemented with a protease inhibitor cocktail (#78442, Thermo‐Fisher Scientific). The protein samples were separated by Bis‐Tris Gel, transferred to a nitrocellulose membrane. The blot was divided into several pieces according to the molecular weight and detected with the indicated primary antibodies (Appendix Supplementary Methods). Blots were then stripped and probed with different primary antibodies. Images were examined using a femto chemiluminescence substrate (#TD264828A, Thermo Scientific), captured with Image Lab software (Bio‐Rad), and analyzed with Quantity One (Bio‐Rad) software. Protein levels are normalized to GAPDH or β‐tubulin.
Quantification and statistical analysis
GraphPad Prism 7.0 (GraphPad Software, Inc.) was used for statistical analyses. The data are expressed as the mean ± standard deviation (SD). Statistical analysis was performed for individual pairs with indicated conditions or DC cells vs controls using Student's t‐test and ANOVA. A Tukey's post hoc test was performed for the multiple comparisons. P values of < 0.05 denoted significant differences.
Data availability
No datasets related to this publication have been deposited in public databases. All unique materials (e.g., Tert null mice described in this manuscript) are available upon request (contact: liuyie@mail.nih.gov) or at the MMRRC repository https://www.mmrrc.org/catalog/sds.php?mmrrc_id=10432.
Author contributions
YL, VAB, and SAS conceived the project. YL and KW designed the experiments. CS, KW, AJS, YG, BY, and TGD performed experiments. KW performed statistical analysis; YL, KW, LH, and YG analyzed the data; YL, KW, and LH wrote the manuscript and all authors read, reviewed, and/or edited the manuscript. NG, BPA, and SAS evaluated patients with DC and contributed patient‐derived cell lines.
Conflict of interest
The authors declare that they have no conflict of interest.
Supporting information
Appendix
Expanded View Figures PDF
Review Process File
Source Data for Figure 1
Source Data for Figure 1
Source Data for Appendix
Acknowledgements
We sincerely thank Drs. Deb. Croteau, Mike Tyers, Evandro F. Fang, Yujun Hou, and Mr. Steven Islet for helpful discussion and technical support. This work was supported by the Intramural Research Program of the National Institutes of Health, National Institute on Aging and the Division of Cancer Epidemiology and Genetics, National Cancer Institute.
The EMBO Journal (2020) 39: e103420
This article has been contributed to by US Government employees and their work is in the public domain in the USA
References
- d'Adda di Fagagna F, Reaper PM, Clay‐Farrace L, Fiegler H, Carr P, Von Zglinicki T, Saretzki G, Carter NP, Jackson SP (2003) A DNA damage checkpoint response in telomere‐initiated senescence. Nature 426: 194–198 [DOI] [PubMed] [Google Scholar]
- Aksoy P, White TA, Thompson M, Chini EN (2006) Regulation of intracellular levels of NAD: a novel role for CD38. Biochem Biophys Res Commun 345: 1386–1392 [DOI] [PubMed] [Google Scholar]
- Alter BP, Giri N, Savage SA, Rosenberg PS (2018) Cancer in the National Cancer Institute inherited bone marrow failure syndrome cohort after fifteen years of follow‐up. Haematologica 103: 30–39 [DOI] [PMC free article] [PubMed] [Google Scholar]
- Amano H, Chaudhury A, Rodriguez‐Aguayo C, Lu L, Akhanov V, Catic A, Popov YV, Verdin E, Johnson H, Stossi F et al (2019) Telomere dysfunction induces sirtuin repression that drives telomere‐dependent disease. Cell Metab 29: 1274–1290 [DOI] [PMC free article] [PubMed] [Google Scholar]
- Armanios M (2013) Telomeres and age‐related disease: how telomere biology informs clinical paradigms. J Clin Invest 123: 996–1002 [DOI] [PMC free article] [PubMed] [Google Scholar]
- Bertuch AA (2016) The molecular genetics of the telomere biology disorders. RNA Biol 13: 696–706 [DOI] [PMC free article] [PubMed] [Google Scholar]
- Bieganowski P, Brenner C (2004) Discoveries of nicotinamide riboside as a nutrient and conserved NRK genes establish a Preiss‐Handler independent route to NAD+ in fungi and humans. Cell 117: 495–502 [DOI] [PubMed] [Google Scholar]
- Bischoff DS, Makhijani NS, Yamaguchi DT (2012) Constitutive expression of human telomerase enhances the proliferation potential of human mesenchymal stem cells. Biores Open Access 1: 273–279 [DOI] [PMC free article] [PubMed] [Google Scholar]
- Brind'Amour J, Lansdorp PM (2011) Analysis of repetitive DNA in chromosomes by flow cytometry. Nat Methods 8: 484–486 [DOI] [PMC free article] [PubMed] [Google Scholar]
- Camacho‐Pereira J, Tarrago MG, Chini CCS, Nin V, Escande C, Warner GM, Puranik AS, Schoon RA, Reid JM, Galina A et al (2016) CD38 dictates age‐related NAD decline and mitochondrial dysfunction through an SIRT3‐dependent mechanism. Cell Metab 23: 1127–1139 [DOI] [PMC free article] [PubMed] [Google Scholar]
- Canto C, Menzies KJ, Auwerx J (2015) NAD(+) metabolism and the control of energy homeostasis: a balancing act between mitochondria and the nucleus. Cell Metab 22: 31–53 [DOI] [PMC free article] [PubMed] [Google Scholar]
- Cawthon RM (2002) Telomere measurement by quantitative PCR. Nucleic Acids Res 30: e47 [DOI] [PMC free article] [PubMed] [Google Scholar]
- Chini CCS, Tarrago MG, Chini EN (2017) NAD and the aging process: role in life, death and everything in between. Mol Cell Endocrinol 455: 62–74 [DOI] [PMC free article] [PubMed] [Google Scholar]
- Chini C, Hogan KA, Warner GM, Tarrago MG, Peclat TR, Tchkonia T, Kirkland JL, Chini E (2019) The NADase CD38 is induced by factors secreted from senescent cells providing a potential link between senescence and age‐related cellular NAD(+) decline. Biochem Biophys Res Commun 513: 486–493 [DOI] [PMC free article] [PubMed] [Google Scholar]
- Coppe JP, Desprez PY, Krtolica A, Campisi J (2010) The senescence‐associated secretory phenotype: the dark side of tumor suppression. Annu Rev Pathol 5: 99–118 [DOI] [PMC free article] [PubMed] [Google Scholar]
- Covarrubias AJ, Kale A, Perrone R, Lopez‐Dominguez JA, Pisco AO, Kasler HG, Schmidt MS, Wiley CD, Iyer SS, Basisty N et al (2019) Aging‐related inflammation driven by cellular senescence enhances NAD consumption via activation of CD38+ pro‐inflammatory macrophages. bioRXiv 10.1101/609438 [PREPRINT] [DOI] [Google Scholar]
- Dokal I, Vulliamy T, Mason P, Bessler M (2015) Clinical utility gene card for: dyskeratosis congenita ‐ update 2015. Eur J Hum Genet 23: 558 [DOI] [PMC free article] [PubMed] [Google Scholar]
- Eisemann T, Pascal JM (2020) Poly(ADP‐ribose) polymerase enzymes and the maintenance of genome integrity. Cell Mol Life Sci 77: 19–33 [DOI] [PMC free article] [PubMed] [Google Scholar]
- Erdmann N, Liu Y, Harrington L (2004) Distinct dosage requirements for the maintenance of long and short telomeres in mTert heterozygous mice. Proc Natl Acad Sci USA 101: 6080–6085 [DOI] [PMC free article] [PubMed] [Google Scholar]
- Fang EF, Scheibye‐Knudsen M, Brace LE, Kassahun H, SenGupta T, Nilsen H, Mitchell JR, Croteau DL, Bohr VA (2014) Defective mitophagy in XPA via PARP‐1 hyperactivation and NAD(+)/SIRT1 reduction. Cell 157: 882–896 [DOI] [PMC free article] [PubMed] [Google Scholar]
- Fang EF, Kassahun H, Croteau DL, Scheibye‐Knudsen M, Marosi K, Lu H, Shamanna RA, Kalyanasundaram S, Bollineni RC, Wilson MA et al (2016) NAD+ replenishment improves lifespan and healthspan in Ataxia telangiectasia models via mitophagy and DNA repair. Cell Metab 24: 566–581 [DOI] [PMC free article] [PubMed] [Google Scholar]
- Fang EF, Lautrup S, Hou Y, Demarest TG, Croteau DL, Mattson MP, Bohr VA (2017) NAD(+) in aging: molecular mechanisms and translational implications. Trends Mol Med 23: 899–916 [DOI] [PMC free article] [PubMed] [Google Scholar]
- Fernandez‐Marcos PJ, Auwerx J (2011) Regulation of PGC‐1alpha, a nodal regulator of mitochondrial biogenesis. Am J Clin Nutr 93: 884S–890 [DOI] [PMC free article] [PubMed] [Google Scholar]
- Frederick DW, Loro E, Liu L, Davila A Jr, Chellappa K, Silverman IM, Quinn WJ 3rd, Gosai SJ, Tichy ED, Davis JG et al (2016) Loss of NAD homeostasis leads to progressive and reversible degeneration of skeletal muscle. Cell Metab 24: 269–282 [DOI] [PMC free article] [PubMed] [Google Scholar]
- Gomes AP, Price NL, Ling AJ, Moslehi JJ, Montgomery MK, Rajman L, White JP, Teodoro JS, Wrann CD, Hubbard BP et al (2013) Declining NAD(+) induces a pseudohypoxic state disrupting nuclear‐mitochondrial communication during aging. Cell 155: 1624–1638 [DOI] [PMC free article] [PubMed] [Google Scholar]
- Jang SY, Kang HT, Hwang ES (2012) Nicotinamide‐induced mitophagy: event mediated by high NAD+/NADH ratio and SIRT1 protein activation. J Biol Chem 287: 19304–19314 [DOI] [PMC free article] [PubMed] [Google Scholar]
- Lin SC, Hardie DG (2018) AMPK: sensing glucose as well as cellular energy status. Cell Metab 27: 299–313 [DOI] [PubMed] [Google Scholar]
- Liu Y, Snow BE, Hande MP, Yeung D, Erdmann NJ, Wakeham A, Itie A, Siderovski DP, Lansdorp PM, Robinson MO et al (2000) The telomerase reverse transcriptase is limiting and necessary for telomerase function in vivo . Curr Biol 10: 1459–1462 [DOI] [PubMed] [Google Scholar]
- Livak KJ, Schmittgen TD (2001) Analysis of relative gene expression data using real‐time quantitative PCR and the 2(‐Delta Delta C(T)) Method. Methods 25: 402–408 [DOI] [PubMed] [Google Scholar]
- Lopez‐Otin C, Blasco MA, Partridge L, Serrano M, Kroemer G (2013) The hallmarks of aging. Cell 153: 1194–1217 [DOI] [PMC free article] [PubMed] [Google Scholar]
- Ma C, Pi C, Yang Y, Lin L, Shi Y, Li Y, Li Y, He X (2017) Nampt expression decreases age‐related senescence in rat bone marrow mesenchymal stem cells by targeting Sirt1. PLoS ONE 12: e0170930 [DOI] [PMC free article] [PubMed] [Google Scholar]
- Mendelsohn AR, Larrick JW (2017) The NAD+/PARP1/SIRT1 axis in aging. Rejuvenation Res 20: 244–247 [DOI] [PubMed] [Google Scholar]
- Mendelsohn AR, Larrick JW (2019) Interacting NAD(+) and cell senescence pathways complicate antiaging therapies. Rejuvenation Res 22: 261–266 [DOI] [PubMed] [Google Scholar]
- Mills KF, Yoshida S, Stein LR, Grozio A, Kubota S, Sasaki Y, Redpath P, Migaud ME, Apte RS, Uchida K et al (2016) Long‐term administration of nicotinamide mononucleotide mitigates age‐associated physiological decline in mice. Cell Metab 24: 795–806 [DOI] [PMC free article] [PubMed] [Google Scholar]
- Mitchell SJ, Bernier M, Aon MA, Cortassa S, Kim EY, Fang EF, Palacios HH, Ali A, Navas‐Enamorado I, Di Francesco A et al (2018) Nicotinamide improves aspects of healthspan, but not lifespan mice. Cell Metab 27: 667–676 [DOI] [PMC free article] [PubMed] [Google Scholar]
- Morris BJ (2013) Seven sirtuins for seven deadly diseases of aging. Free Radic Biol Med 56: 133–171 [DOI] [PubMed] [Google Scholar]
- Mouchiroud L, Houtkooper RH, Moullan N, Katsyuba E, Ryu D, Canto C, Mottis A, Jo YS, Viswanathan M, Schoonjans K et al (2013) The NAD(+)/sirtuin pathway modulates longevity through activation of mitochondrial UPR and FOXO signaling. Cell 154: 430–441 [DOI] [PMC free article] [PubMed] [Google Scholar]
- Muraki K, Han L, Miller D, Murnane JP (2013) The role of ATM in the deficiency in nonhomologous end‐joining near telomeres in a human cancer cell line. PLoS Genet 9: e1003386 [DOI] [PMC free article] [PubMed] [Google Scholar]
- O'Callaghan N, Baack N, Sharif R, Fenech M (2012) A qPCR‐based assay to quantify oxidized guanine and other FPG‐sensitive base lesions within telomeric DNA. Biotechniques 51: 403–411 [DOI] [PubMed] [Google Scholar]
- Partida‐Sanchez S, Cockayne DA, Monard S, Jacobson EL, Oppenheimer N, Garvy B, Kusser K, Goodrich S, Howard M, Harmsen A et al (2001) Cyclic ADP‐ribose production by CD38 regulates intracellular calcium release, extracellular calcium influx and chemotaxis in neutrophils and is required for bacterial clearance in vivo . Nat Med 7: 1209–1216 [DOI] [PubMed] [Google Scholar]
- de Picciotto NE, Gano LB, Johnson LC, Martens CR, Sindler AL, Mills KF, Imai S, Seals DR (2016) Nicotinamide mononucleotide supplementation reverses vascular dysfunction and oxidative stress with aging in mice. Aging Cell 15: 522–530 [DOI] [PMC free article] [PubMed] [Google Scholar]
- Sahin E, Colla S, Liesa M, Moslehi J, Muller FL, Guo M, Cooper M, Kotton D, Fabian AJ, Walkey C et al (2011) Telomere dysfunction induces metabolic and mitochondrial compromise. Nature 470: 359–365 [DOI] [PMC free article] [PubMed] [Google Scholar]
- Sarkar J, Liu Y (2016) The origin of oxidized guanine resolves the puzzle of oxidation‐induced telomere‐length alterations. Nat Struct Mol Biol 23: 1070–1071 [DOI] [PMC free article] [PubMed] [Google Scholar]
- Savage SA (2018) Beginning at the ends: telomeres and human disease. F1000Research 7: 524–538 [DOI] [PMC free article] [PubMed] [Google Scholar]
- Scheibye‐Knudsen M, Ramamoorthy M, Sykora P, Maynard S, Lin PC, Minor RK, Wilson DM 3rd, Cooper M, Spencer R, de Cabo R et al (2012) Cockayne syndrome group B protein prevents the accumulation of damaged mitochondria by promoting mitochondrial autophagy. J Exp Med 209: 855–869 [DOI] [PMC free article] [PubMed] [Google Scholar]
- Schultz MB, Sinclair DA (2016) Why NAD(+) declines during aging: it's destroyed. Cell Metab 23: 965–966 [DOI] [PMC free article] [PubMed] [Google Scholar]
- Tang BL (2016) Sirt1 and the mitochondria. Mol Cells 39: 87–95 [DOI] [PMC free article] [PubMed] [Google Scholar]
- Tarrago MG, Chini CCS, Kanamori KS, Warner GM, Caride A, de Oliveira GC, Rud M, Samani A, Hein KZ, Huang R et al (2018) A potent and specific CD38 inhibitor ameliorates age‐related metabolic dysfunction by reversing tissue NAD(+) decline. Cell Metab 27: 1081–1095 [DOI] [PMC free article] [PubMed] [Google Scholar]
- Vallabhaneni H, Zhou F, Maul RW, Sarkar J, Yin J, Lei M, Harrington L, Gearhart PJ, Liu Y (2015) Defective repair of uracil causes telomere defects in mouse hematopoietic cells. J Biol Chem 290: 5502–5511 [DOI] [PMC free article] [PubMed] [Google Scholar]
- Vannini N, Campos V, Girotra M, Trachsel V, Rojas‐Sutterlin S, Tratwal J, Ragusa S, Stefanidis E, Ryu D, Rainer PY et al (2019) The NAD‐booster nicotinamide riboside potently stimulates hematopoiesis through increased mitochondrial clearance. Cell Stem Cell 24: 405–418 [DOI] [PubMed] [Google Scholar]
- Verdin E (2015) NAD(+) in aging, metabolism, and neurodegeneration. Science 350: 1208–1213 [DOI] [PubMed] [Google Scholar]
- Wan B, Yin J, Horvath K, Sarkar J, Chen Y, Wu J, Wan K, Lu J, Gu P, Yu EY et al (2013) SLX4 assembles a telomere maintenance toolkit by bridging multiple endonucleases with telomeres. Cell Rep 4: 861–869 [DOI] [PMC free article] [PubMed] [Google Scholar]
- Yang SJ, Choi JM, Kim L, Park SE, Rhee EJ, Lee WY, Oh KW, Park SW, Park CY (2014) Nicotinamide improves glucose metabolism and affects the hepatic NAD‐sirtuin pathway in a rodent model of obesity and type 2 diabetes. J Nutr Biochem 25: 66–72 [DOI] [PubMed] [Google Scholar]
- Yang Y, Sauve AA (2016) NAD(+) metabolism: bioenergetics, signaling and manipulation for therapy. Biochim Biophys Acta 1864: 1787–1800 [DOI] [PMC free article] [PubMed] [Google Scholar]
- Yap TA, Plummer R, Azad NS, Helleday T (2019) The DNA damaging revolution: PARP inhibitors and beyond. Am Soc Clin Oncol Educ Book 39: 185–195 [DOI] [PubMed] [Google Scholar]
- Yoshino J, Baur JA, Imai SI (2018) NAD(+) intermediates: the biology and therapeutic potential of NMN and NR. Cell Metab 27: 513–528 [DOI] [PMC free article] [PubMed] [Google Scholar]
- Zhang H, Ryu D, Wu Y, Gariani K, Wang X, Luan P, D'Amico D, Ropelle ER, Lutolf MP, Aebersold R et al (2016) NAD(+) repletion improves mitochondrial and stem cell function and enhances life span in mice. Science 352: 1436–1443 [DOI] [PubMed] [Google Scholar]
- Zhu XH, Lu M, Lee BY, Ugurbil K, Chen W (2015) In vivo NAD assay reveals the intracellular NAD contents and redox state in healthy human brain and their age dependences. Proc Natl Acad Sci USA 112: 2876–2881 [DOI] [PMC free article] [PubMed] [Google Scholar]
Associated Data
This section collects any data citations, data availability statements, or supplementary materials included in this article.
Supplementary Materials
Appendix
Expanded View Figures PDF
Review Process File
Source Data for Figure 1
Source Data for Figure 1
Source Data for Appendix
Data Availability Statement
No datasets related to this publication have been deposited in public databases. All unique materials (e.g., Tert null mice described in this manuscript) are available upon request (contact: liuyie@mail.nih.gov) or at the MMRRC repository https://www.mmrrc.org/catalog/sds.php?mmrrc_id=10432.