

Abstract
Background:
Some persons who achieve viral suppression may later experience viral rebound, potentially putting them at risk for transmitting HIV. We estimate the prevalence of, and describe factors associated with, viral rebound among adults with diagnosed HIV in the United States who had ≥2 viral load tests in a 12-month period.
Setting:
The Medical Monitoring Project is an annual cross-sectional survey about the experiences and needs of adults with diagnosed HIV sampled from the National HIV Surveillance System.
Methods:
We analyzed interview and medical record data from 3 Medical Monitoring Project cycles spanning June 2015—May 2018. We analyzed viral load results from the 12-month period before the interview among persons with ≥2 viral load tests who achieved viral suppression. Data were weighted based on known probabilities of selection, adjusted for patient nonresponse, and poststratified to known population totals from the National HIV Surveillance System.
Results:
Among those with ≥2 viral load tests who achieved viral suppression, 7.5% demonstrated viral rebound. In multivariable analyses, viral rebound was higher among non-Hispanic blacks, persons ages 18–39, persons with public insurance, persons recently experiencing homelessness, persons with higher numbers of viral load tests, persons who missed HIV care appointments, and persons with suboptimal adherence to antiretroviral therapy.
Conclusions:
Viral rebound varied by sociodemographic and clinical characteristics. HIV providers can monitor persons at greatest risk for viral rebound and link patients with ancillary services or evidence-based interventions to help them remain virally suppressed. Our findings can inform strategies and interventions implemented under the Ending the HIV Epidemic initiative.
Keywords: HIV infections, viral load, United States, public health surveillance, sustained virologic response, retention in care
INTRODUCTION
Persons with HIV who achieve and maintain an undetectable viral load have effectively no risk of sexually transmitting HIV.1–4 HIV treatment as prevention emphasizes that adherence to antiretroviral therapy (ART) is key to sustaining viral suppression and preventing sexual transmission of HIV.5 However, some persons who achieve viral suppression are unable to sustain an undetectable viral load and experience viral rebound. Depending on the frequency of receipt of care and viral load testing, these persons may be unaware that their viral load levels have rebounded to detectable levels, potentially putting them at risk for transmitting HIV to sexual partners. We aimed to estimate the prevalence of, and describe the factors associated with, viral rebound among adults with diagnosed HIV living in the United States who achieved viral suppression and had at least 2 viral load tests in a 12-month period. Identifying groups in need of additional support to maintain viral suppression may better inform prevention strategies and adherence messaging in support of the Ending the HIV Epidemic initiative.6
METHODS
The Medical Monitoring Project (MMP) is an annual cross-sectional survey that describes experiences and needs of persons with diagnosed HIV. MMP produces nationally representative estimates of behavioral and clinical characteristics of adults with diagnosed HIV living in the United States.7 MMP data collection is part of routine public health surveillance and, thus, determined to be nonresearch.8 Participating states or territories obtained local institutional review board approval to collect data, when required. Informed consent was obtained from all participants.
Briefly, MMP uses a 2-stage sampling method. During the first stage, 23 project areas were sampled from all states in the U.S., the District of Columbia, and Puerto Rico. During the second stage, simple random samples of persons with diagnosed HIV aged 18 years and older are drawn annually for each participating state/territory from the National HIV Surveillance System, a census of U.S. persons with diagnosed HIV. For this analysis, we combined data from the 2015–2017 data collection cycles. Data were collected via phone or face-to-face interviews and medical record abstractions from June 2015—May 2018.
All 23 sampled jurisdictions participated. Among sampled persons, response rates ranged from 40% to 46%, resulting in 11,914 persons with interview and/or medical record data. Viral load test results from the 12-month period before the interview were abstracted. We defined viral suppression as <200 copies of viral RNA/mL, viral rebound as having at least one detectable viral load ≥200 copies/mL following a suppressed result, and sustained viral suppression as having all tests <200 copies/mL. Our analytic objective was to assess viral rebound among persons who achieved viral suppression. Persons with fewer than 2 viral load tests (n = 4009) did not have an opportunity to demonstrate viral rebound and were excluded from analysis. Among persons with 2 or more viral load tests during the 12 months before interview, persons who never achieved viral suppression (n = 373) were also excluded. Persons who “gained” viral suppression (n = 765)—that is, those with one or more unsuppressed viral loads followed by at least one suppressed viral load—were excluded, because they did not have sustained viral suppression for the entire 12-month period nor did they demonstrate viral rebound. Our final analytic subset (n = 6767) included 543 persons with documented viral rebound and 6224 persons with documented sustained viral suppression during the 12 months before interview (Fig. 1).
FIGURE 1.
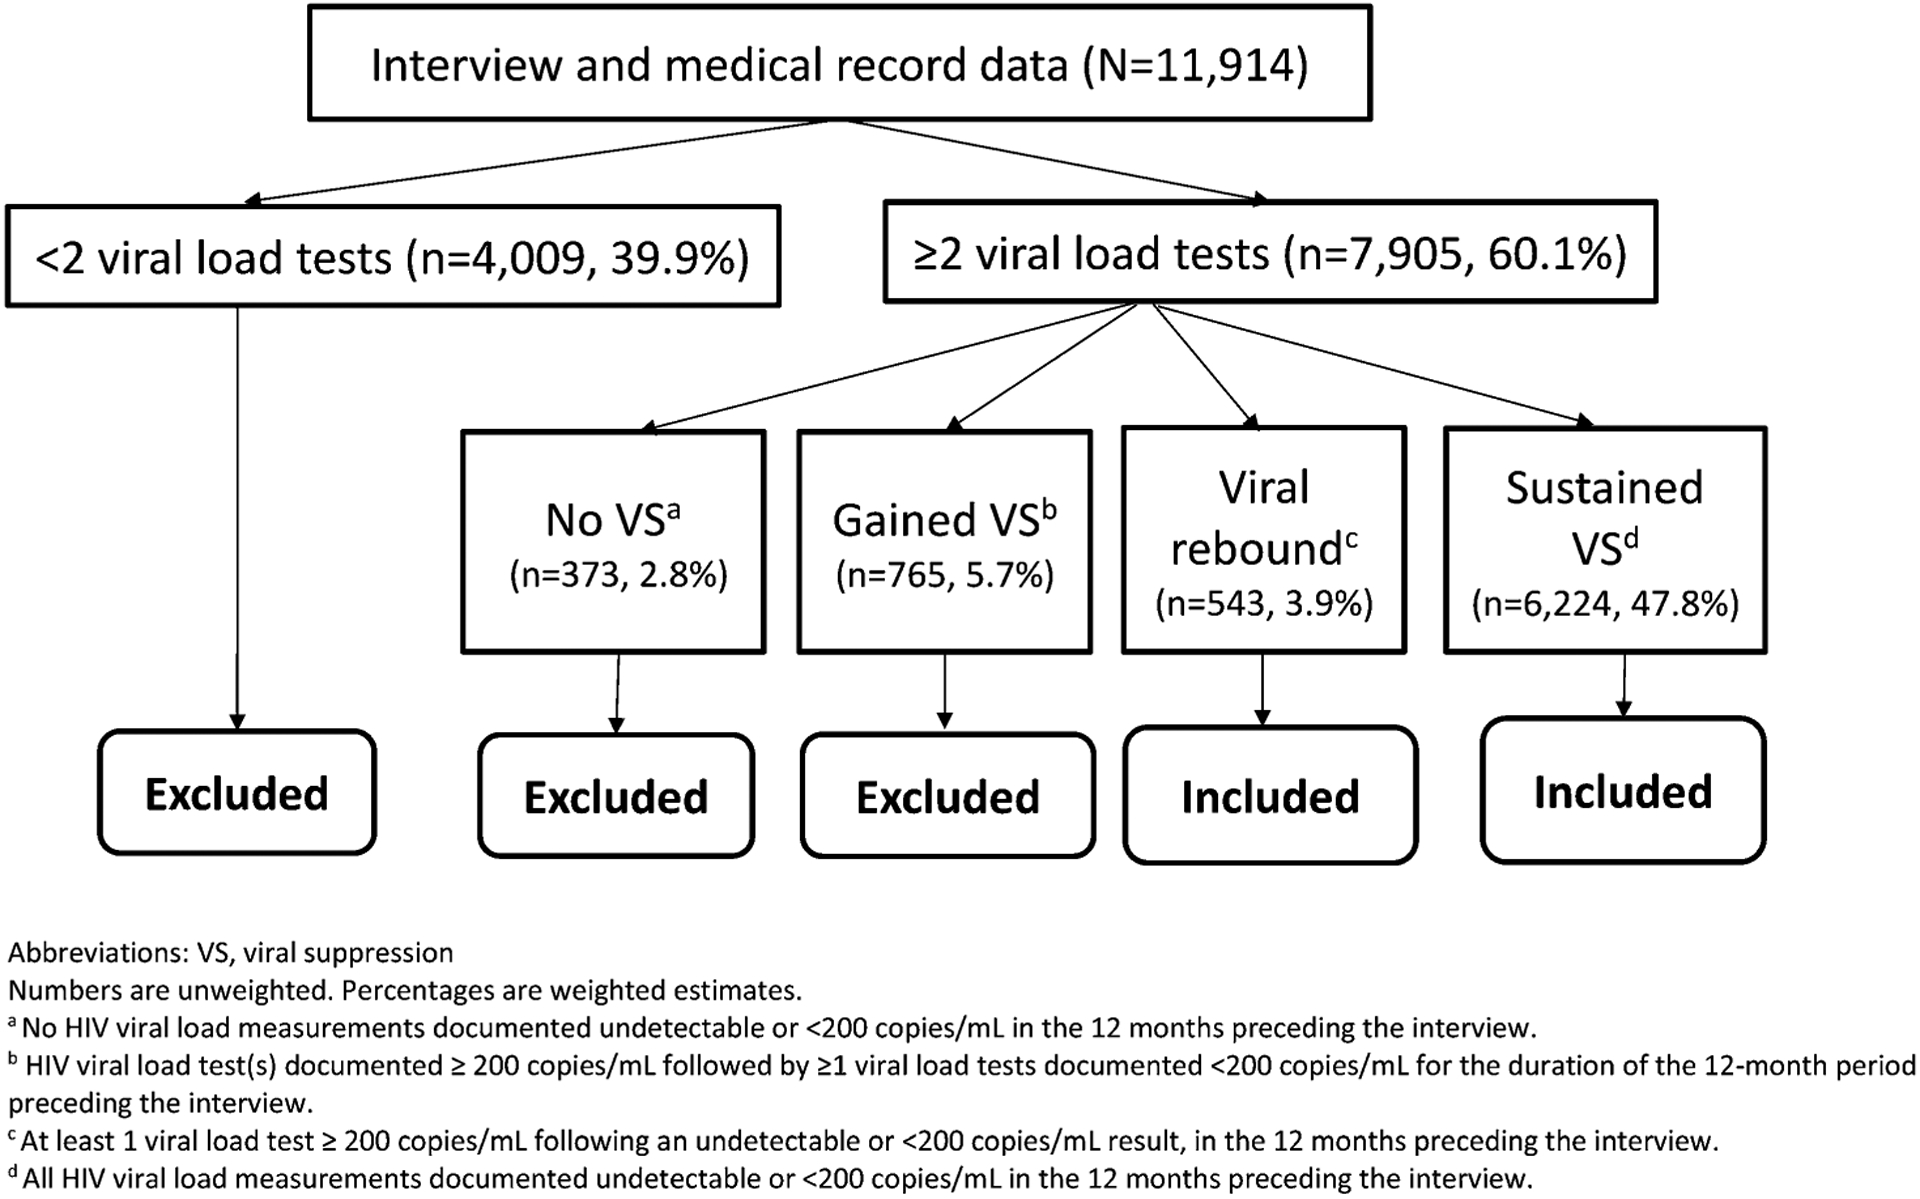
Defining the analytic subset comparing persons with documented viral rebound versus persons with sustained viral suppression, MMP, 2015–2017 (n = 6767).
Data were weighted based on known probabilities of selection at state/territory and person levels, adjusted for patient nonresponse, and poststratified to known population totals from the National HIV Surveillance System by age, race/ethnicity, and gender.9 We computed weighted prevalence and corresponding 95% confidence intervals (CIs) for all estimates. We estimated unadjusted prevalence ratios (PRs) with predicted marginal means to describe associations between viral rebound and selected sociodemographic, behavioral, and clinical characteristics among persons who achieved viral suppression and had at least one follow-up viral load test over a 12-month period. We conducted multivariable analyses to estimate PRs adjusted for other variables in the model. We excluded from multivariable analyses any variables with unadjusted P-values >0.10, any variables highly correlated with other variables (eg, gender was excluded in favor of the sexual behavior/orientation variable that encompasses gender), and variables with small cell sizes (eg, received drug/alcohol counseling or treatment). We used a multi-stage modeling procedure, whereby the first model included all variables that met the criteria described above. All variables with P ≤ 0.10 in the initial model were included in the final model. All analyses accounted for complex survey sample design and unequal selection probabilities using the survey procedures in SAS or SAS-callable SUDAAN.10,11
RESULTS
Among U.S. adults with diagnosed HIV, 60.1% (95% CI: 57.9 to 62.3) had ≥2 viral load tests over a 12-month period (Fig. 1). The remaining 39.9% (95% CI: 37.7 to 42.1) with <2 viral load tests were excluded from further analysis. Of persons with ≥2 viral load tests, those who never achieved viral suppression (2.8%, 95% CI: 2.4 to 3.2) and those who had an initial unsuppressed viral load, but later achieved and maintained viral suppression (5.7%, 95% CI: 5.1 to 6.2) were excluded from our analyses. Persons who demonstrated viral rebound (3.9%, 95% CI: 3.4 to 4.4) and sustained viral suppression (47.8%, 95% CI: 46.1 to 49.5) were included in our analyses. Within this group, 92.5% (95% CI: 91.6 to 93.3) had documented sustained viral suppression and 7.5% (95% CI: 6.7 to 8.4) had documented viral rebound. Table 1 presents prevalence of viral rebound and unadjusted and adjusted PRs (aPRs) by sociodemographic, social determinants of health, clinical, and mental health/substance use characteristics.
TABLE 1.
Viral Rebound* Among Adults With Diagnosed HIV Who Achieved Viral Suppression†, MMP, 2015–2017 (N = 6,767‡)
| Viral rebound* | Unadjusted Results | Adjusted Results | ||||||
|---|---|---|---|---|---|---|---|---|
| n§ | Row % (95% CI)∥ | Prevalence Ratio (95% CI)∥ | P | P (Wald F) | Prevalence Ratio (95% CI)∥ | P | P (Wald F) | |
| Total | 543 | 7.5 (6.7 to 8.4) | ||||||
| Sociodemographic characteristics | ||||||||
| Gender | 0.014 | |||||||
| Male | 368 | 7.0 (6.1 to 8.0) | Reference | |||||
| Female | 165 | 9.2 (7.7 to 10.8) | 1.31 (1.06 to 1.62) | 0.014 | ||||
| Sexual behavior/orientation¶ | <0.001 | |||||||
| Men who have sex with men | 210 | 6.0 (5.1 to 6.9) | Reference | |||||
| Men who have sex with women only | 149 | 9.3 (7.2 to 11.3) | 1.55 (1.21 to 2.00) | <0.001 | ||||
| Women who have sex with men | 161 | 9.3 (7.6 to 10.9) | 1.55 (1.24 to 1.94) | <0.001 | ||||
| Race and ethnicity | <0.001 | 0.005 | ||||||
| White (Non-Hispanic) | 102 | 4.6 (3.7 to 5.5) | Reference | Reference | ||||
| Black (Non-Hispanic) | 283 | 10.3 (8.9 to 11.7) | 2.23 (1.76 to 2.82) | <0.001 | 1.50 (1.14 to 1.98) | 0.003 | ||
| Hispanic or Latino# | 131 | 7.3 (6.1 to 8.6) | 1.59 (1.23 to 2.05) | <0.001 | 1.12 (0.85 to 1.47) | 0.416 | ||
| Other/Multiracial** | 27 | 6.4 (4.0 to 8.7) | 1.38 (0.92 to 2.06) | 0.122 | 0.98 (0.61 to 1.57) | 0.941 | ||
| Age (yr) | <0.001 | 0.017 | ||||||
| 18–29 | 65 | 13.3 (10.0 to 16.5) | 2.01 (1.49 to 2.72) | <0.001 | 1.36 (0.98 to 1.89) | 0.074 | ||
| 30–39 | 112 | 10.4 (8.3 to 12.5) | 1.58 (1.26 to 1.99) | <0.001 | 1.28 (1.02 to 1.61) | 0.036 | ||
| 40–49 | 112 | 6.5 (5.1 to 7.9) | 0.98 (0.76 to 1.27) | 0.904 | 0.95 (0.74 to 1.20) | 0.650 | ||
| ≥50 | 254 | 6.6 (5.6 to 7.6) | Reference | Reference | ||||
| Survey year | 0.238 | |||||||
| 2015 | 186 | 8.6 (7.0 to 10.1) | 1.21 (0.92 to 1.60) | 0.174 | ||||
| 2016 | 171 | 7.1 (5.9 to 8.2) | 1.00 (0.76 to 1.30) | 0.986 | ||||
| 2017 | 186 | 7.1 (5.6 to 8.6) | Reference | |||||
| Social determinants of health | ||||||||
| Education | <0.001 | |||||||
| <High school | 136 | 9.9 (7.8 to 11.9) | 1.61 (1.26 to 2.05) | <0.001 | ||||
| High school diploma or equivalent | 161 | 9.0 (7.3 to 10.6) | 1.46 (1.17 to 1.83) | 0.001 | ||||
| >High school | 245 | 6.1 (5.2 to 7.1) | Reference | |||||
| Health care coverage | <0.001 | 0.019 | ||||||
| Any private insurance | 127 | 5.1 (4.3 to 5.9) | Reference | Reference | ||||
| Public insurance only | 359 | 8.9 (7.8 to 10.1) | 1.75 (1.44 to 2.13) | <0.001 | 1.32 (1.07 to 1.61) | 0.008 | ||
| Ryan White coverage only/Uninsured | 52 | 8.7 (6.3 to 11.2) | 1.71 (1.26 to 2.32) | 0.001 | 1.03 (0.74 to 1.44) | 0.857 | ||
| Poverty levels†† | <0.001 | |||||||
| Above poverty level | 211 | 5.5 (4.7 to 6.3) | Reference | |||||
| At or below poverty level | 293 | 10.0 (8.7 to 11.3) | 1.80 (1.50 to 2.18) | <0.001 | ||||
| Homeless‡‡ | <0.001 | 0.030 | ||||||
| Yes | 72 | 14.5 (10.8 to 18.3) | 2.06 (1.58 to 2.68) | <0.001 | 1.39 (1.04 to 1.86) | 0.030 | ||
| No | 470 | 7.1 (6.3 to 7.9) | Reference | Reference | ||||
| Incarcerated | 0.001 | |||||||
| Yes | 41 | 15.1 (8.6 to 21.6) | 2.08 (1.35 to 3.19) | <0.001 | ||||
| No | 501 | 7.3 (6.5 to 8.1) | Reference | |||||
| Clinical characteristics | ||||||||
| Receives care at a clinic receiving Ryan | <0.001 | 0.011 | ||||||
| White funding | ||||||||
| Yes | 448 | 8.9 (7.9 to 9.8) | 2.13 (1.66 to 2.73) | <0.001 | 1.40 (1.08 to 1.83) | 0.011 | ||
| No | 85 | 4.2 (3.2 to 5.1) | Reference | Reference | ||||
| Total number of viral load tests after first suppressed result | <0.001 | <0.001 | ||||||
| 1 test | 150 | 4.5 (3.6 to 5.5) | Reference | Reference | ||||
| 2 tests | 206 | 8.0 (6.8 to 9.1) | 1.76 (1.41 to 2.19) | <0.001 | 1.71 (1.37 to 2.13) | <0.001 | ||
| 3 tests | 108 | 10.2 (8.3 to 12.1) | 2.25 (1.69 to 3.01) | <0.001 | 2.30 (1.71 to 3.09) | <0.001 | ||
| 4 or more tests | 79 | 26.8 (21.3 to 32.3) | 5.92 (4.47 to 7.85) | <0.001 | 5.54 (4.13 to 7.44) | <0.001 | ||
| Time since HIV diagnosis | 0.368 | |||||||
| < 5 yrs | 77 | 7.1 (5.5 to 8.8) | Reference | |||||
| 5–9 yrs | 108 | 6.7 (5.2 to 8.3) | 0.94 (0.69 to 1.29) | 0.714 | ||||
| ≥10 yrs | 358 | 7.9 (6.9 to 9.0) | 1.11 (0.86 to 1.44) | 0.420 | ||||
| Missed any HIV care appointments | <0.001 | <0.001 | ||||||
| Yes | 193 | 12.5 (10.6 to 14.4) | 1.98 (1.63 to 2.39) | <0.001 | 1.49 (1.21 to 1.83) | <0.001 | ||
| No | 347 | 6.3 (5.5 to 7.2) | Reference | Reference | ||||
| ART use and ART dose adherence§§ | <0.001 | <0.001 | ||||||
| No current ART use | 27 | 27.9 (17.4 to 38.5) | 5.44 (3.50 to 8.44) | <0.001 | 5.34 (3.46 to 8.23) | <0.001 | ||
| Current ART use, not 100% adherent | 279 | 11.0 (9.5 to 12.5) | 2.14 (1.80 to 2.55) | <0.001 | 1.88 (1.58 to 2.23) | <0.001 | ||
| Current ART use, 100% adherent | 232 | 5.1 (4.3 to 5.9) | Reference | Reference | ||||
| Mental health and substance use | ||||||||
| Depression (past 2 weeks)∥∥ | <0.001 | |||||||
| No depression | 405 | 6.9 (6.1 to 7.7) | Reference | |||||
| Any depression¶¶ | 133 | 10.4 (8.4 to 12.4) | 1.52 (1.23 to 1.87) | <0.001 | ||||
| Received mental health services | 0.050 | |||||||
| Needed, but did not receive | 46 | 7.7 (5.3 to 10.1) | 1.12 (0.82 to 1.54) | 0.470 | ||||
| Received | 202 | 8.7 (7.3 to 10.2) | 1.28 (1.05 to 1.56) | 0.015 | ||||
| Did not need and did not receive | 288 | 6.8 (5.9 to 7.7) | Reference | |||||
| Any drug use | 0.861 | |||||||
| Yes | 154 | 7.6 (6.2 to 9.1) | 1.02 (0.83 to 1.25) | 0.861 | ||||
| No | 383 | 7.5 (6.6 to 8.4) | Reference | |||||
| Any stimulant drug use## | 0.004 | |||||||
| Yes | 69 | 10.7 (8.0 to 13.4) | 1.48 (1.14 to 1.93) | 0.004 | ||||
| No | 468 | 7.2 (6.4 to 8.1) | Reference | |||||
| Received drug or alcohol counseling or treatment | <0.001 | |||||||
| Needed, but did not receive | 16 | 15.8 (8.2 to 23.4) | 2.24 (1.39 to 3.62) | 0.002 | ||||
| Received | 63 | 11.7 (9.0 to 14.5) | 1.66 (1.29 to 2.15) | <0.001 | ||||
| Did not need and did not receive | 458 | 7.1 (6.2 to 7.9) | Reference | |||||
| Binge drinking (past 30 days)*** | 0.163 | |||||||
| Yes | 97 | 8.7 (6.7 to 10.7) | 1.18 (0.94 to 1.49) | 0.163 | ||||
| No | 440 | 7.3 (6.5 to 8.2) | Reference | |||||
All variables measured by self-report over the past 12 months except where otherwise noted. Numbers might not add to total because of missing data. Percentages may not sum to 100 because of rounding. All variables with unadjusted P < 0.10 were considered for inclusion in multivariable analyses. For highly collinear variables (eg, gender & sexual behavior/orientation), only one variable was included in multivariable analyses.
Viral load measurement of ≥200 copies/mL documented in the 12 months preceding the interview.
Among persons with >1 viral load test in the 12 months preceding the interview.
Among persons categorized as demonstrating “sustained viral suppression” or “viral rebound.”
Numbers are unweighted.
Percentages and corresponding CIs are weighted percentages.
Persons were classified based on sexual behavior among the sexually active and reported sexual orientation among the nonsexually active.
Hispanics or Latinos may be of any race. Persons are classified in only one race category.
Includes American Indian/Alaska native, Asian, native Hawaiian/other Pacific Islander, or multiple races.
Poverty guidelines as defined by the Department of Health and Human Services (DHHS). More information regarding DHHS poverty guidelines can be found at http://aspe.hhs.gov/frequently-asked-questions-related-poverty-guidelines-and-poverty.
Living on the street, in a shelter, in a single-room-occupancy hotel, or in a car.
Among those taking ART.
Based on responses to items on the Patient Health Questionnaire (PHQ-8). Kroenke K, Strine TW, Spritzer RL et al. The PHQ-8 as a measure of current depression in the general population. J Affect Disord. 2009; 114(1–3):163–73.
Reported 2 or more symptoms of depression based on PHQ-8 items.
Injection or non-injection use of methamphetamines, amphetamines, crack, cocaine, or injected heroin.
Binge drinking was defined as having ≥ 5 alcoholic beverages in a single sitting (≥4 for women) on at least 1 day during the 30 days before the interview.
Sociodemographic Characteristics
Viral rebound was higher among women (9.2%, 95% CI: 7.7 to 10.8; unadjusted PR = 1.31, 95% CI: 1.06 to 1.62) compared with men (7.0%, 95% CI: 6.1 to 8.0). Men who have sex with men had the lowest prevalence of viral rebound (6.0%, 95% CI: 5.1 to 6.9) compared with men who have sex with women only (9.3%, 95% CI: 7.2 to 11.3; PR = 1.55, 95% CI: 1.21 to 2.00) or women who have sex with men (9.3%, 95% CI: 7.6 to 10.9; PR = 1.55, 95% CI: 1.24 to 1.94). Viral rebound was significantly higher among non-Hispanic blacks (10.3%, 95% CI: 8.9 to 11.7; PR = 2.23, 95% CI: 1.76 to 2.82) and Hispanics/Latinos (7.3%, 95% CI: 6.1 to 8.6; PR = 1.59, 95% CI: 1.23 to 2.05) compared with non-Hispanic whites (4.6%, 95% CI: 3.7 to 5.5). Viral rebound was significantly higher among persons aged 18–29 years (13.3%, 95% CI: 10.0 to 16.5; PR = 2.01, 95% CI: 1.49 to 2.72) and 30–39 years (10.4%, 95% CI: 8.3 to 12.5; PR = 1.58, 95% CI: 1.26 to 1.99), compared with persons aged ≥50 (6.6%, 95% CI: 5.6 to 7.6).
Social Determinants of Health
Viral rebound was higher among persons with less than a high school education (9.9%, 95% CI: 7.8 to 11.9; PR = 1.61, 95% CI: 1.26 to 2.05) and persons with a high school education (9.0%, 95% CI: 7.3 to 10.6; PR = 1.46; 95% CI: 1.17 to 1.83) compared with those with more than a high school education (6.1%, 95% CI: 5.2 to 7.1). Persons with any private insurance had lower rates of viral rebound (5.1%, 95% CI: 4.3 to 5.9) compared with persons with public insurance only (8.9%, 95% CI: 7.8 to 10.1; PR = 1.75, 95% CI: 1.44 to 2.13) or persons who had Ryan White coverage only or were uninsured (8.7%, 95% CI: 6.3 to 11.2; PR = 1.71, 95% CI: 1.26 to 2.32). Persons living at or below the poverty level had a higher prevalence of viral rebound (10.0%, 95% CI: 8.7 to 11.3; PR = 1.80, 95% CI: 1.50 to 2.18) compared with persons living above the poverty level (5.5%, 95% CI: 4.7 to 6.3). Persons who reported being homeless in the past 12 months had a higher prevalence of viral rebound (14.5%, 95% CI: 10.8 to 18.3; PR = 2.06, 95% CI: 1.58 to 2.68) compared with persons who were not homeless (7.1%, 95% CI: 6.3 to 7.9). Persons who reported being incarcerated in the past 12 months had a higher prevalence of viral rebound (15.1%, 95% CI: 8.6 to 21.6; PR = 2.08, 95% CI: 1.35 to 3.19) compared with persons who were not incarcerated (7.3%, 95% CI: 6.5 to 8.1).
Clinical Characteristics
Viral rebound was higher among persons who attended a clinic receiving Ryan White HIV/AIDS Program funding (8.9%, 95% CI: 7.9 to 9.8; PR = 2.13, 95% CI: 1.66 to 2.73) than among persons who attended other clinics (4.2%, 95% CI: 3.2 to 5.1). Viral rebound was associated with the total number of viral load tests performed following the first suppressed test result, as persons with 2 (8.0%, 95% CI: 6.8 to 9.1; PR = 1.76, 95% CI: 1.41 to 2.19), 3 (10.2%, 95% CI: 8.3 to 12.1; PR = 2.25, 95% CI: 1.69 to 3.01), or 4 or more viral load tests (26.8%, 95% CI: 21.3 to 32.3; PR = 5.92, 95% CI: 4.47 to 7.85) were significantly more likely to demonstrate viral rebound compared with persons with only one test (4.5%, 95% CI: 3.6 to 5.5). Viral rebound was higher among persons who missed HIV care appointments (12.5%, 95% CI: 10.6 to 14.4; PR = 1.98, 95% CI: 1.63 to 2.39) compared with persons who did not miss any appointments (6.3%, 95% CI: 5.5 to 7.2). Viral rebound was significantly higher among persons not currently taking ART (27.9%, 95% CI: 17.4 to 38.5; PR = 5.44, 95% CI: 3.50 to 8.44) and persons taking ART who reported less than 100% dose adherence in the past 30 days (11.0%, 95% CI: 9.5 to 12.5; PR = 2.14, 95% CI: 1.80 to 2.55) compared with persons taking ART who reported 100% dose adherence (5.1%, 95% CI: 4.3 to 5.9).
Mental Health and Substance Use
Viral rebound was higher among persons reporting symptoms consistent with depression in the past 2 weeks (10.4%, 95% CI: 8.4 to 12.4; PR = 1.52, 95% CI: 1.23 to 1.87) compared with persons who did not (6.9%, 95% CI: 6.1 to 7.7). Viral rebound was higher among persons who received mental health services (8.7%, 95% CI: 7.3 to 10.2; PR = 1.28, 95% CI: 1.05 to 1.56) than among persons who did not need and did not receive services (6.8%, 95% CI: 5.9 to 7.7). Persons who reported using stimulant drugs in the past 12 months (10.7%, 95% CI: 8.0 to 13.4; PR = 1.48, 95% CI: 1.14 to 1.93) had a higher prevalence of viral rebound compared with persons who did not report using stimulant drugs (7.2%, 95% CI: 6.4 to 8.1). Viral rebound was higher among persons with unmet need for drug or alcohol counseling or treatment services (15.8%, 95% CI: 8.2 to 23.4; PR = 2.24, 95% CI: 1.39 to 3.62) and persons who received services (11.7%, 95% CI: 9.0 to 14.5; PR = 1.66, 95% CI: 1.29 to 2.15) compared with persons who did not need and did not receive services (7.1%, 95% CI: 6.2 to 7.9).
Multivariable Analysis
In the preliminary multivariable model (results not shown), the following variables had P > 0.10 and were excluded from the final model: sexual behavior/orientation (P = 0.34), education (P = 0.57), poverty level (P = 0.55), incarceration (P = 0.12), depression (P = 0.25), and stimulant drug use (P = 0.31). The following factors were associated with higher likelihood of viral rebound at P < 0.10 after adjusting for other variables in the final model (Table 1): non-Hispanic black race (aPR = 1.50, 95% CI: 1.14 to 1.98; P = 0.003) compared with non-Hispanic white race; age 18–29 years (aPR = 1.36, 95% CI: 0.98 to 1.89; P = 0.074) and age 30–39 years (aPR = 1.28, 95% CI: 1.02 to 1.61; P = 0.036) compared with age 50 or higher; public health insurance coverage (aPR = 1.32, 95% CI: 1.07 to 1.61; P = 0.008) compared with any private insurance; homelessness (aPR = 1.39, 95% CI: 1.04 to 1.86; P = 0.03); receiving care at a clinic receiving Ryan White funding (aPR = 1.40, 95% CI: 1.08 to 1.83; P = 0.011); having 2 tests (aPR = 1.71, 95% CI: 1.37 to 2.13; P < 0.001), 3 tests (aPR = 2.30, 95% CI: 1.71 to 3.09; P < 0.001), or ≥4 viral load tests (aPR = 5.54, 95% CI: 4.13 to 7.44; P < 0.001) after the first virally suppressed test result compared with 1 test; missing HIV care appointments (aPR = 1.49, 95% CI: 1.21 to 1.83; P < 0.001), no current ART use (aPR = 5.34, 95% CI: 3.46 to 8.23; P < 0.001), and current ART use with less than 100% dose adherence (aPR = 1.88, 95% CI: 1.58 to 2.23; P < 0.001) compared with current ART use and 100% dose adherence.
Differences in Prevalence of Viral Rebound by State
The prevalence of viral rebound among adults with diagnosed HIV who achieved viral suppression varied from 4.5% (95% CI: 2.5 to 6.6) to 11.8% (95% CI: 7.3 to 16.4) across states participating in MMP (Table 2).
TABLE 2.
Prevalence of Viral Rebound by State* Among Adults With Diagnosed HIV Who Achieved Viral Suppression, MMP, 2015–2017 (n = 6767)†
| n‡ | Row % (95% CI)§ | |
|---|---|---|
| Total | 543 | 7.5 (6.7 to 8.4) |
| California | 47 | 5.3 (3.6 to 7.0) |
| Delaware | 30 | 8.9 (5.8 to 12.1) |
| Florida | 46 | 8.5 (5.9 to 11.2) |
| Georgia | 32 | 10.7 (6.9 to 14.4) |
| Illinois | 31 | 7.6 (4.9 to 10.3) |
| Indiana | 9 | 5.3 (1.8 to 8.9)** |
| Michigan | 22 | 7.6 (4.5 to 10.8) |
| Mississippi | 29 | 11.8 (7.3 to 16.4) |
| New Jersey | 29 | 9.7 (5.8 to 13.6) |
| New York | 74 | 9.7 (7.5 to 11.9) |
| North Carolina | 16 | 4.8 (2.4 to 7.1) |
| Oregon | 19 | 4.5 (2.5 to 6.6) |
| Pennsylvania | 32 | 6.5 (4.0 to 8.9) |
| Puerto Rico | 40 | 8.8 (5.8 to 11.7) |
| Texas | 51 | 8.5 (5.8 to 11.2) |
| Virginia | 22 | 7.1 (4.0 to 10.2) |
| Washington | 14 | 5.4 (2.6 to 8.3) |
Estimates marked with an double asterisk have a coefficient of variation ≥0.30 and may be unstable.
16 states and Puerto Rico are represented. Data collected from the 6 MMP city/county jurisdictions (Chicago, Houston, Los Angeles County, New York City, Philadelphia, and San Francisco) are included in the corresponding state.
Viral rebound (viral load measurement of ≥200 copies/mL) among persons with >.1 viral load test documented in the 12 months preceding the interview.
Numbers are unweighted.
Percentages and corresponding CIs are weighted percentages.
DISCUSSION
Among U.S. adults with HIV who achieved viral suppression and had at least one follow-up test over a 12-month period, we found that roughly 1 in 13 had documented viral rebound. Viral rebound was higher among populations disproportionally affected by HIV including non-Hispanic blacks and younger persons, mirroring findings in the literature.12–21 Disparities in viral rebound by black race persisted after adjusting for other sociodemographic factors such as education, poverty level, homelessness, incarceration, and health insurance coverage. Non-Hispanic blacks were 1.5 times as likely to demonstrate viral rebound compared with non-Hispanic whites. Our findings are consistent with those from prior MMP data collection cycles where, despite improvements in viral suppression over time among all races, we saw disparities in viral suppression among non-Hispanic blacks that persisted after adjusting for other sociodemographic, behavioral, and clinical factors.22,23 Providers should consider offering patients at highest risk for viral rebound targeted, evidence-based interventions associated with improved retention in care, ART adherence, and viral load outcomes.24 Adherence interventions developed specifically for blacks and younger persons may need to be prioritized to eliminate disparities in viral rebound by race and age.
Consistent with prior research,21,25–27 we identified several social determinants of health that were significantly associated with viral rebound in bivariate analyses. After adjusting for other variables, persons with public health insurance coverage only were significantly more likely to have documented viral rebound compared with persons with private insurance. Persons who had recently experienced homelessness were significantly more likely to have documented viral rebound compared with those who had not. To address viral rebound disparities in housing and health insurance coverage, current and new resources may be prioritized through existing programs, such as the Housing Opportunities for Persons with AIDS and the Ryan White HIV/AIDS Program, respectively.28,29 Although Housing Opportunities for Persons with AIDS is the only federal program devoted to housing needs for persons with HIV, some jurisdictions may also have local programs that address housing needs. HIV providers can identify patients with housing instability or health insurance coverage issues and refer them to case managers or social workers for assistance with housing or help enrolling in health insurance, Ryan White coverage, or the AIDS Drug Assistance Program.
In addition to demographic and social determinants of health, we identified several clinical factors that were significantly associated with viral rebound after adjusting for other variables. Not surprisingly, we found that the number of viral load tests performed after the first virally suppressed test result was significantly associated with viral rebound. For example, persons with 4 or more viral load tests performed were 5.54 times as likely to demonstrate viral rebound compared with persons with only one test. This is likely explained by the frequency of viral load testing ordered by providers based on patient-specific factors related to past ART adherence and the ART regimen prescribed. For example, providers may order less frequent viral load testing for persons with a history of sustained viral suppression and adherence to HIV care and treatment, whereas more frequent viral load testing may be an indicator of previous non-adherence with care and/or treatment or more complicated treatment regimens. In addition, we found that persons who self-reported no current ART use or recent suboptimal adherence to ART and persons who missed HIV care appointments were significantly more likely to have documented viral rebound. These associations with suboptimal viral load outcomes among factors on the HIV care continuum are consistent with the literature.17,30–32 It is important for HIV providers to provide ongoing adherence counseling and screen for barriers to maintaining viral suppression, even among patients who are virally suppressed. Providers may consult the Centers for Disease Control and Prevention’s Compendium of Evidence-Based Interventions and Best Practices for HIV Prevention,24,33 which offers examples of numerous structural (eg, financial incentives) and medication adherence interventions (eg, Project NGage) associated with improved retention in care, ART adherence, and viral load outcomes. Interventions are characterized by target population, intervention level (group or individual), and ART use history (treatment-experienced or treatment-naive). Finally, tailored HIV adherence and prevention messaging in conjunction with enhanced treatment adherence interventions may be needed to sustain viral suppression among persons at highest risk for viral rebound. The Health Resources and Services Administration recently stressed the importance of viral suppression messaging in medical and nonmedical settings, and urged HIV care and ancillary service providers to incorporate tailored messages about viral suppression into routine clinical practice.34 Enhanced focus on viral load monitoring among those at highest risk for viral rebound, referrals to case management to address unmet needs, and delivery of tailored adherence messages and interventions may further reduce disparities in viral rebound.
Limitations
One limitation of our analysis is that we excluded persons with <2 viral load tests, persons without documented viral suppression, and persons who gained viral suppression, resulting in an analytic subset of persons who achieved viral suppression and had ≥2 viral load tests in a 12-month period, who represent an estimated 52% of adults with diagnosed HIV in the United States. However, our primary aim was to estimate the prevalence of viral rebound and describe factors associated with viral rebound among adults who achieved viral suppression. Our analytic subset was similar to the overall MMP sample on sociodemographic characteristics. Because of small sample sizes, we were unable to conduct state-level multivariable analyses. However, factors independently associated with viral rebound may vary by state and could be the focus of future analyses to help state or local public health programs identify populations at highest risk for viral rebound. Second, we could only assess viral rebound when persons sought care and had viral load testing done, so our findings may not apply to persons who dropped out of care. Third, we abstracted medical records from the facility where the person reported receiving most of his/her care in the 12 months before the interview, therefore potentially missing viral load tests from persons receiving care at multiple facilities. Finally, some of the interview measures that anchored closely in time to the interview date (eg, adherence within the past 30 days or depression symptoms in the past 2 weeks) are not contemporaneous with the timing of all viral load tests conducted up to 12 months earlier, so we cannot assess or infer causality.
CONCLUSION
While the overall prevalence of documented viral rebound was only 7.5%, our analyses highlighted several populations (non-Hispanic blacks, younger persons, and those recently experiencing homelessness) disproportionately affected by viral rebound. Our findings may help inform which groups to prioritize under the “Treat” pillar of the Ending the HIV Epidemic Initiative6 and may help researchers tailor adherence strategies and interventions or adherence messaging to different populations. We confirmed several proximal clinical and behavioral factors to be associated with viral rebound, such as suboptimal adherence to ART, missed clinic appointments, and number of viral load tests. A more complete understanding of the factors associated with viral rebound may help HIV providers better identify and more closely monitor persons at greatest risk for viral rebound. Through assessing and identifying barriers to care and unmet needs, providers can link patients with ancillary services and evidence-based interventions to help them stay in care, adhere to ART treatment as prescribed, and remain virally suppressed.
ACKNOWLEDGMENTS
The authors thank MMP participants, project area staff, and Provider and Community Advisory Board members. The authors also acknowledge the contributions of the Clinical Outcomes Team and Behavioral and Clinical Surveillance Branch at CDC.
Funding for the Medical Monitoring Project is provided by the Centers for Disease Control and Prevention.
Footnotes
The authors have no conflicts of interest to disclose.
Presented in part at the 13th International Conference on HIV Treatment and Prevention Adherence, June 9, 2018; Miami, FL.
The findings and conclusions in this report are those of the authors and do not necessarily represent the views of the Centers for Disease Control and Prevention.
REFERENCES
- 1.Rodger AJ, Cambiano V, Bruun T, et al. Risk of HIV transmission through condomless sex in serodifferent gay couples with the HIV-positive partner taking suppressive antiretroviral therapy (PARTNER): final results of a multicentre, prospective, observational study. Lancet. 2019;393:2428–2438. [DOI] [PMC free article] [PubMed] [Google Scholar]
- 2.Bavinton BR, Pinto AN, Phanuphak N, et al. Viral suppression and HIV transmission in serodiscordant male couples: an international, prospective, observational, cohort study. Lancet HIV. 2018;5:e438–e447. [DOI] [PubMed] [Google Scholar]
- 3.Cohen MS, Chen YQ, McCauley M, et al. Antiretroviral therapy for the prevention of HIV-1 transmission. N Engl J Med. 2016;375:830–839. [DOI] [PMC free article] [PubMed] [Google Scholar]
- 4.Rodger AJ, Cambiano V, Bruun T, et al. Sexual activity without condoms and risk of HIV transmission in serodifferent couples when the HIV-positive partner is using suppressive antiretroviral therapy. JAMA. 2016;316:171–181. [DOI] [PubMed] [Google Scholar]
- 5.Centers for Disease Control and Prevention. Available at: https://www.cdc.gov/hiv/risk/art/index.html. Accessed February 24, 2020.
- 6.Status of HIV in America: ending the HIV epidemic. Available at: https://www.hiv.gov/federal-response/ending-the-hiv-epidemic/hiv-inamerica. Accessed February 24, 2020.
- 7.Centers for Disease Control and Prevention. Behavioral and Clinical Characteristics of Persons with Diagnosed HIV Infection—Medical Monitoring Project, United States, 2015 Cycle (June 2015-May 2016): HIV Surveillance Special Report 20. Available at: https://www.cdc.gov/hiv/pdf/library/reports/surveillance/cdc-hiv-surveillance-special-report-number-20.pdf. Accessed February 24, 2020.
- 8.Centers for Disease Control and Prevention. Distinguishing public health research and public health nonresearch. Available at: https://www.cdc.gov/od/science/integrity/docs/cdc-policy-distinguishing-public-health-research-nonresearch.pdf. Accessed February 24, 2020.
- 9.Heeringa SG, West BT, Berglund PA. Applied Survey Data Analysis. London, United Kingdom: Chapman and Hall; 2010. [Google Scholar]
- 10.SAS [computer Program]. Version 9.4 Cary, NC: SAS Institute. [Google Scholar]
- 11.SAS-callable SUDAAN [computer Program]. Version 11.0.3 Research Triangle Park, NC: SAS Institute. [Google Scholar]
- 12.Henrich TJ, Wood BR, Kuritzkes DR. Increased risk of virologic rebound in patients on antiviral therapy with a detectable HIV load <48 copies/mL. PLoS One. 2012;7:e50065. [DOI] [PMC free article] [PubMed] [Google Scholar]
- 13.Ladak F, Socias E, Nolan S, et al. Substance use patterns and HIV-1 RNA viral load rebound among HIV-positive illicit drug users in a Canadian setting. Antivir Ther. 2019;24:19–25. [DOI] [PMC free article] [PubMed] [Google Scholar]
- 14.Le Moing V, Chene G, Carrieri MP, et al. Predictors of virological rebound in HIV-1-infected patients initiating a protease inhibitor-containing regimen. AIDS. 2002;16:21–29. [DOI] [PubMed] [Google Scholar]
- 15.Nance RM, Delaney JAC, Simoni JM, et al. HIV viral suppression trends over time among HIV-infected patients receiving care in the United States, 1997 to 2015: a cohort study. Ann Intern Med. 2018;169:376–384. [DOI] [PMC free article] [PubMed] [Google Scholar]
- 16.Palmer A, Gabler K, Rachlis B, et al. Viral suppression and viral rebound among young adults living with HIV in Canada. Medicine (Baltimore). 2018;97:e10562. [DOI] [PMC free article] [PubMed] [Google Scholar]
- 17.Robertson M, Laraque F, Mavronicolas H, et al. Linkage and retention in care and the time to HIV viral suppression and viral rebound—New York City. AIDS Care. 2015;27:260–267. [DOI] [PubMed] [Google Scholar]
- 18.Sheehan DM, Fennie KP, Mauck DE, et al. Retention in HIV care and viral suppression: individual- and neighborhood-level predictors of racial/ethnic differences, Florida, 2015. AIDS Patient Care STDS. 2017;31:167–175. [DOI] [PMC free article] [PubMed] [Google Scholar]
- 19.Tanner Z, Lachowsky N, Ding E, et al. Predictors of viral suppression and rebound among HIV-positive men who have sex with men in a large multi-site Canadian cohort. BMC Infect Dis. 2016;16:590. [DOI] [PMC free article] [PubMed] [Google Scholar]
- 20.Mujugira A, Celum C, Tappero JW, et al. Younger age predicts failure to achieve viral suppression and virologic rebound among HIV-1-infected persons in serodiscordant partnerships. AIDS Res Hum Retroviruses. 2016;32:148–154. [DOI] [PMC free article] [PubMed] [Google Scholar]
- 21.Beattie CM, Wiewel EW, Zhong Y, et al. Multilevel factors associated with a lack of viral suppression among persons living with HIV in a federally funded housing program. AIDS Behav. 2019;23:784–791. [DOI] [PubMed] [Google Scholar]
- 22.Beer L, Bradley H, Mattson CL, et al. Trends in racial and ethnic disparities in antiretroviral therapy prescription and viral suppression in the United States, 2009–2013. J Acquir Immune Defic Syndr. 2016;73: 446–453. [DOI] [PMC free article] [PubMed] [Google Scholar]
- 23.Beer L, Mattson CL, Bradley H, et al. Understanding cross-sectional racial, ethnic, and gender disparities in antiretroviral use and viral suppression among HIV patients in the United States. Medicine (Baltimore). 2016;95:e3171. [DOI] [PMC free article] [PubMed] [Google Scholar]
- 24.Centers for Disease Control and Prevention. Compendium of evidence-based interventions and best practices for HIV prevention. Available at: https://www.cdc.gov/hiv/research/interventionresearch/compendium/index.html. Accessed February 24, 2020.
- 25.Bowen EA, Canfield J, Moore S, et al. Predictors of CD4 health and viral suppression outcomes for formerly homeless people living with HIV/AIDS in scattered site supportive housing. AIDS Care. 2017;29: 1458–1462. [DOI] [PubMed] [Google Scholar]
- 26.Milloy MJ, Kerr T, Buxton J, et al. Social and environmental predictors of plasma HIV RNA rebound among injection drug users treated with antiretroviral therapy. J Acquir Immune Defic Syndr. 2012;59:393–399. [DOI] [PMC free article] [PubMed] [Google Scholar]
- 27.Small W, Milloy MJ, McNeil R, et al. Plasma HIV-1 RNA viral load rebound among people who inject drugs receiving antiretroviral therapy (ART) in a Canadian setting: an ethno-epidemiological study. AIDS Res Ther. 2016;13:26. [DOI] [PMC free article] [PubMed] [Google Scholar]
- 28.Health Resources and Services Administration. About the Ryan White HIV/AIDS Program. Available at: https://hab.hrsa.gov/about-ryan-white-hivaids-program/about-ryan-white-hivaids-program. Accessed February 24, 2020.
- 29.US Department of Housing and Urban Development. HOPWA: Housing Opportunities for Persons with AIDS. Available at: https://www.hudexchange.info/programs/hopwa/. Accessed February 24, 2020.
- 30.Crawford TN. Poor retention in care one-year after viral suppression: a significant predictor of viral rebound. AIDS Care. 2014;26:1393–1399. [DOI] [PubMed] [Google Scholar]
- 31.O’Connor JL, Gardner EM, Esser S, et al. A simple self-reported adherence tool as a predictor of viral rebound in people with viral suppression on antiretroviral therapy. HIV Med. 2016;17:124–132. [DOI] [PubMed] [Google Scholar]
- 32.Beer L, Skarbinski J. Adherence to antiretroviral therapy among HIV-infected adults in the United States. AIDS Educ Prev. 2014;26:521–537. [DOI] [PMC free article] [PubMed] [Google Scholar]
- 33.Centers for Disease Control and Prevention. Effective Interventions. Available at: https://www.cdc.gov/hiv/effective-interventions/index.html. Accessed February 24, 2020.
- 34.Health Resources and Services Administration. HRSA Dear Colleague Letter. Available at: https://hab.hrsa.gov/sites/default/files/hab/program-grants-management/ViralSuppressionProgramLetterFinal10-19-2018.pdf. Accessed February 24, 2020.