

Abstract
Objectives
Opioid consumption in France has remained stable over the last 15 years, with much lower levels than in the USA. However, few data are available on patients who consume opioids and their use of the health system. Emergency department (ED) data has never been used as a source to investigate opioid use disorder (OUD) in France.
Design/settings/participants
We used the OSCOUR national surveillance network, collecting daily ED data from 93% of French ED, to select and describe visits and hospitalisations after an OUD-related ED visit between 2010 and 2018 using International Classification of Diseases, version 10 (ICD10) codes. We described the population of interest and used binomial negative regressions to identify factors significantly associated with OUD such as gender, age, administrative region, year of admission and ICD10 codes. We also analysed the related diagnoses.
Primary outcome measure
Trend in ED visits for an OUD-related ED visit.
Results
We recorded 34 362 OUD-related visits out of 97 892 863 ED visits (36.1/100 000 visits). OUD-related visits decreased from 39.2/100 000 visits in 2010 to 32.9/100 000 visits in 2018, resulting in an average yearly decrease of 2.1% (95% CI 1.5% to 2.7%) after multivariate analysis. We recorded 15 966 OUD-related hospitalisations out of 20 359 574 hospitalisations after ED visits (78.4/100 000 hospitalisations) with an increase from 74.0/100 000 hospitalisations in 2010 to 81.4/100 000 hospitalisations in 2018. The analysis of related diagnoses demonstrated mostly polydrug abuse in this population.
Conclusions
While the proportion of OUD visits decreased in the time frame, the hospitalisation proportion increased. The implementation of a nationwide surveillance system for OUD in France using ED visits would provide prompt detection of changes over time.
Keywords: substance misuse, epidemiology, health informatics, accident & emergency medicine
Strengths and limitations of this study.
First study on a large database containing 93% of all emergency departments (EDs) visits in France in the study period.
Exploratory analysis of opioid use disorder (OUD) ED visit related diagnosis.
Multivariate analysis of OUD rates to take into consideration cofounders.
Change in the coverage of included emergencies and number of ED visit through the study period.
No clinical data more than sociodemographic variables and diagnoses.
Introduction
High morbidity and mortality rates characterise the current unprecedented opioid epidemic in the USA,1 2 with an estimated 135 deaths every day in 2017.3 Initially, prescribed opioids were the primary reason for this crisis. Today, the substances involved are changing with a predominance of fentanyl and heroin.4 5 Canada has witnessed the same trend with a 43% increase in strong opioids (fentanyl, hydromorphone, oxycodone and morphine) between 2005 and 2011.6
In Europe, the general trend is also upward, especially for strong opioids, with a 400% and 300% increase in the UK7 and Germany,8 respectively, between 2000 and 2010.
In France, administrative databases and cross-sectional studies9–11 show relative stability in opioid consumption, with an increase for some drugs (+1950% use for oxycodone, +105% for tramadol between 2004 and 2017). Between 2000 and 2015, opioid-related mortality increased from 1 to 4 deaths a week, lower than the rates observed in North America. French hospital discharge databases show that opioid-related hospitalisations increased from 17.6 to 56.9/100 000 population between 2000 and 2015.9 Given the worrying international context, it would be beneficial to reinforce current epidemiological surveillance by exploring new data sources to accurately assess the burden of opioid use disorder (OUD) in France.
Data from emergency department (ED) visits are one such potential source, since they have already been used to monitor trends in seasonal outbreaks,12 non-infectious diseases13 and to assess the health impact of environmental events.14–16 Importantly, they also have been used specifically for OUD in the USA to monitor trends at the state and national levels.17 18 ED data allow for the observation of a greater variety of patients than those who are hospitalised, mostly catching less serious patients.
The primary objective was to describe trends in OUD-related ED visits, defined as all visits related to opioid use (poisoning, addiction, overdose, withdrawal, side-effects), by using data from the OSCOUR network hypothesising an increase in visits over time. If such an increase were indeed observed, a rethinking of national public health policy on opioids (prescription guidelines, physicians training, implementation of a dedicated surveillance system) would seem essential. Secondary objectives were to describe ED OUD chief complaint, related diagnoses and hospitalisation after an ED visit, giving an insight of this population.
Materials and methods
Materials
In France, ED data are collected from computerised medical records completed during consultations in hospitals participating in the OSCOUR network. OSCOUR grew from 23 hospitals in 2004 to 695 in 2018, covering 93.2% of all ED visits in all French administrative regions, and totalling 150 million ED visits since its inception.
Participating hospitals transmit daily data to OSCOUR about individual patients seen during the previous 7 days. Most data are transmitted the day following a visit. As patients have no unique identification number, the number of distinct individuals consulted cannot be assessed, only the total number of visits. No identifiable information are collected through the OSCOUR system.
Transmitted data contain clinical information with a primary (PD) and up to five secondary (SD) discharge diagnoses, ranked in order of significance and coded using the International Classification of Diseases, version 10 (ICD10).19 However, PD is only indicated in 75% of visits. For each visit, the following information is collected: chief complaint in free-text, severity score (from 1 to 5), demographic information (date of birth, gender, residence zip code), administrative information (date and time of admission and discharge, orientation after ED visit (hospitalisation, death, discharge)).
While data were available from 2004 onward, we focused our analysis on ED visits documented in OSCOUR between 2010 and 201820 to ensure data quality.
Methods
Identification of visits
We used ICD10 to identify OUD-related records using methodologies described in the literature.3 21–29 The suitability of each code was then discussed with a group of experts comprising emergency physicians (members of the French Society of Emergency Medicine) and actors in drug surveillance in France (French Monitoring Centre for Drugs and Drug Addiction). We used codes related to opioid poisoning, including ‘Opium poisoning’ [T40.0], ‘Heroin poisoning’ [T40.1], ‘Other opioids poisoning (Codeine or Morphine)’ [T40.2], ‘Methadone poisoning’ [T40.3], ‘Synthetic narcotics poisoning’ [T40.4] and ‘Other narcotics’ [T40.6] and codes related to ‘Mental behavioural disorders due to use of opioids’ [F11]. We included visits for which the corresponding codes were found in the PD or SD, keeping the first code found as the identifier code.
Statistical analyses
We calculated OUD proportions per 100 000 ED visits, dividing the number of visits corresponding to each opioid code by the number of visits associated with any ICD10 code. We then calculated hospitalisation proportions for OUD per 100 000 hospitalisations to assess the burden of OUD in all hospitalisations. To assess OUD severity, we also computed the proportion of OUD-related ED visits resulting in hospitalisation (per 100 000 OUD visits). Finally, we described the characteristics of the population for all ED visits, OUD-related ED visits and subsequent hospitalisations, using percentages for categorical variables. Continuous variables were categorised only when comparison with other studies was necessary (description section).
To identify potential OUD-related factors in all ED visits during the study period, we performed univariate and multivariate regression models. Covariates including gender, age, year of admission, administrative region and ICD10 codes were introduced into the models. After observing overdispersion in Poisson regression models, we performed negative binomial models. Continuous variables were modelled using fractional polynomials.30 Results are presented as proportion ratios (PR) according to a reference category/value for each covariate.
In addition, we performed an exploratory analysis including a description of the chief complaint based on identification of ICD10 codes in free-text, to assess the potential value of using the chief complaint in OUD identification. Free-texts were analysed by two senior and one junior epidemiologists, manually identifying ICD10 codes for each term. We analysed the most frequent related diagnoses in order to explain comorbidity in OUD patients.
This study followed the Strengthening the Reporting of Observational Studies in Epidemiology statement31 guidelines. All analyses were performed using R V.3.5.332 and SAS V.9.3. No study with human or animal subjects was performed by any of the authors during the development of this article. The study was only based on a secondary use of an anonymised database collected from health professionals. According to French law studies such studies are not required to receive ethics committee approval.
Patient and public involvement
No patients were involved in the design, or conduct, or reporting, or dissemination plans of the research.
Results
ED visits
From 1 January 2010 to 31 December 2018, of the 131 524 288 ED visits recorded in OSCOUR 97 892 863 (74.4%) had a PD. We identified 34 362 OUD-related ED visits (36.1/100 000 visits), divided into 27 952 defined with PD and 6410 with SD. We excluded 32 942 (0.03%) ED visits due to missing data, 7 (0.02%) being OUD-related. Patients were mostly men (64.6%, 43.5/100 000 vs 35.3%, 26.0/100 000 ED visits), and median age was 36 (IQR: (27–48)) (table 1). Over the study period, the proportion of OUD-related ED visits according to age group (figure 1A) evolved, with a sharp decrease in the 20–49 years old group but no increase in younger or older groups.
Table 1.
ED visits and hospitalisations for opioid use disorder
| ED visits | Hospitalisations | ||||||||||
| Number | % | Number of OUD-related ED visits | % | Proportion of OUD-related ED visits(/100 000 ED visits)* | Number | % | Number of OUD-related hospitalisations | % | Proportion of OUD-related hospitalisations (/100 000 hospitalisations)† | Proportion of OUD-related hospitalisations after an ED visit (%)‡ | |
| Overall | 97 892 863 | 34 362 | 36.1 | 20 359 574 | 15 966 | 78.4 | 46.40 | ||||
| Gender | |||||||||||
| Female | 46 703 789 | 48 | 12 128 | 35 | 26 | 9 973 304 | 49 | 6498 | 41 | 65.2 | 57.30 |
| Male | 51 022 814 | 52 | 22 193 | 65 | 43.5 | 10 379 105 | 51 | 9464 | 59 | 91.2 | 42.60 |
| Unidentified | 166,26 | 0.2 | 41 | 0.1 | 24.7 | 7.165 | 0 | 4 | 0 | 55.8 | 9.80 |
| Age (years) | |||||||||||
| 0–9 | 14 219 838 | 15 | 620 | 1.8 | 4.4 | 1 324 424 | 6.7 | 306 | 1.9 | 23.1 | 49.40 |
| 10–19 | 12 273 794 | 13 | 2563 | 7.5 | 20.9 | 1 154 524 | 5.9 | 1210 | 7.6 | 104.8 | 47.20 |
| 20–29 | 13 522 858 | 14 | 7860 | 23 | 58.1 | 1 378 686 | 7 | 2822 | 18 | 204.7 | 35.90 |
| 30–39 | 11 331 629 | 12 | 8569 | 25 | 75.6 | 1 430 061 | 7.3 | 3543 | 22 | 247.8 | 41.30 |
| 40–49 | 10 202 226 | 11 | 7122 | 21 | 69.8 | 1 719 576 | 8.8 | 3367 | 21 | 195.8 | 47.30 |
| 50–59 | 9 012 155 | 9.6 | 3289 | 9.6 | 36.5 | 2 056 094 | 11 | 1848 | 12 | 89.9 | 56.20 |
| 60–69 | 7 463 405 | 7.9 | 1432 | 4.2 | 19.2 | 2 396 151 | 12 | 889 | 5.6 | 37.1 | 62.00 |
| 70+ | 16 333 519 | 17 | 2832 | 8.3 | 17.3 | 8 192 414 | 42 | 1942 | 12 | 23.7 | 68.60 |
| Year | |||||||||||
| 2010 | 5 417 628 | 5.5 | 2123 | 6.2 | 39.2 | 1 202 155 | 5.9 | 890 | 5.6 | 74 | 41.90 |
| 2011 | 6 940 082 | 7.1 | 2642 | 7.7 | 38.1 | 1 527 334 | 7.5 | 1175 | 7.4 | 76.9 | 44.50 |
| 2012 | 8 005 769 | 8.2 | 2820 | 8.2 | 35.2 | 1 761 210 | 8.7 | 1213 | 7.6 | 68.9 | 43.00 |
| 2013 | 9 038 982 | 9.2 | 3296 | 9.6 | 36.5 | 1 968 554 | 9.7 | 1462 | 9.2 | 74.3 | 44.40 |
| 2014 | 10 783 928 | 11 | 3935 | 12 | 36.5 | 2 260 275 | 11 | 1804 | 11 | 79.8 | 45.80 |
| 2015 | 12 894 907 | 13 | 4571 | 13 | 35.4 | 2 624 995 | 13 | 2107 | 13 | 80.3 | 46.10 |
| 2016 | 14 092 119 | 14 | 4786 | 14 | 34 | 2 886 361 | 14 | 2303 | 14 | 79.8 | 48.10 |
| 2017 | 14 982 603 | 15 | 5013 | 15 | 33.5 | 3 026 234 | 15 | 2486 | 16 | 82.1 | 49.60 |
| 2018 | 15 736 845 | 16 | 5176 | 15 | 32.9 | 3 102 456 | 15 | 2526 | 16 | 81.4 | 48.80 |
| ICD10 code | |||||||||||
| [F11] Mental and behavioural disorders due to use of opioids | 20 657 | 60 | 9471 | 59 | 45.80 | ||||||
| [T40] Poisoning by narcotics and psychodysleptics | 185 | 0.5 | 69 | 0.4 | 37.30 | ||||||
| [T400] Opium | 169 | 0.5 | 93 | 0.6 | 55.00 | ||||||
| [T401] Heroin | 1181 | 3.4 | 482 | 3 | 40.80 | ||||||
| [T402] Other opioids | 6299 | 18 | 3749 | 24 | 59.50 | ||||||
| [T403] Methadone | 1129 | 3.3 | 577 | 3.6 | 51.10 | ||||||
| [T404] Other narcotics | 307 | 0.9 | 159 | 1 | 51.80 | ||||||
| [T406] Unspecified narcotics | 4435 | 13 | 1366 | 8.6 | 30.80 | ||||||
*Numberof opioid abuse/number of visits.
†Numberof hospitalisations for OUD/number of hospitalisations.
‡Numberof hospitalisations for OUD/number of OUD-related ED visits. Reference for ICD10 code is ‘Other opioids’ [T402] accounting for morphine and codeine.
ED, emergency department; ICD10, International Classification of Diseases, version 10; OUD, opioid use disorder.
Figure 1.

(A) Distribution of OUD-related ED visits according to age group by year, France 2010–2018. (B) Trends in proportion of OUD-related ED visits and subsequent hospitalisations per 100 000, 2010–2018. ED, emergency department; OUD, opioid use disorder.
Figure 1B shows the trends in OUD-related ED visits and post-visit hospitalisations. The proportion of visits decreased from 39.2/100 000 in 2010 to 32.9/100 000 visits in 2018. Figure 2 shows the distribution of visits according to age and gender. Three peaks are observed, the first representing children aged under 7 years old, the second patients aged between 18 and 50, mostly men, and the third patients over 75, mostly women.
Figure 2.
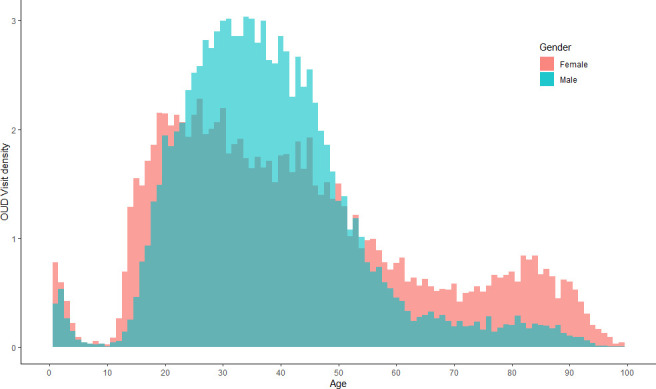
Distribution of the age density function according to the number of emergency department visits by gender. OUD, opioid use disorder.
The most frequent ICD10 code was ‘Mental and behavioural disorders due to use of opioids’ [F11], which accounted for 60.1% of visits. The other most frequent codes were ‘Other opioids’ [T402] (18.3%) and ‘Unspecified narcotics’ [T406] (12.9%). We found a difference in the use of ICD10 codes according to age, as shown in figure 3, with code F11 being more frequent in the 20–59 age group while code T402 was used mainly in young children (0–9) and the elderly (70+).
Figure 3.

Distribution of identification code for opioid use disorder by age. ICD10, International Classification of Diseases, version 10.
Crude and adjusted PR estimates for trends in OUD-related ED visits are shown in table 2. A crude PR yearly decrease of 1.9% (95% CI 1.3% to 2.6%) per year between 2010 and 2018 was reported. An increase of 59% (95% CI 54% to 65%) in male ED visits was observed compared with female visits. The largest increase in PR was observed in the 30–39 age group (48% increase, 95% CI 45% to 50%) while the largest decrease was found in 0–9 age group (83% decrease, 95% CI 82% to 84%). For opioid-related ICD10 codes, a higher increase for ‘Mental and behavioural disorders due to use of opioids’ [F11] (952% (95% CI 917% to 989%) in the proportion of ED visits was observed than for ‘Other opioids (Morphine, Codeine)’ [T402].
Table 2.
Univariate and multivariate analyses for trends in the proportion of opioid use disorder-related emergency department visits
| Ref | Crude PR | 95% CI | P value | Adjusted PR | 95% CI | P value | |
| Gender | |||||||
| Female | Ref | 1 | 1 | ||||
| Male | 1.59 | (1.54 to 1.65) | <0.001 | 1.4 | (1.36 to 1.44) | <0.001 | |
| Unidentified | 0.89 | (0.64 to 1.25) | 0.524 | 0.7 | (0.50 to 0.97) | 0.032 | |
| Age (years) (reference) | |||||||
| 0–9 | 5 | 0.17 | (0.16 to 0.18) | <0.001 | 0.17 | (0.17 to 0.18) | <0.001 |
| 10–19 | 15 | 0.71 | (0.70 to 0.72) | <0.001 | 0.72 | (0.71 to 0.72) | <0.001 |
| 20–29 | 25 | 1.24 | (1.23 to 1.25) | <0.001 | 1.23 | (1.22 to 1.24) | <0.001 |
| 30–39 | 35 | 1.48 | (1.45 to 1.50) | <0.001 | 1.45 | (1.42 to 1.47) | <0.001 |
| 40–49 | 45 | 1.39 | (1.36 to 1.43) | <0.001 | 1.35 | (1.33 to 1.38) | <0.001 |
| 50–59 | 55 | 1.12 | (1.09 to 1.16) | <0.001 | 1.08 | (1.06 to 1.11) | <0.001 |
| 60–69 | 65 | 0.8 | (0.78 to 0.83) | <0.001 | 0.75 | (0.75 to 0.80) | <0.001 |
| 70+ | 90 | 0.24 | (0.23 to 0.26) | <0.001 | 0.23 | (0.22 to 0.24) | <0.001 |
| Year (quantitative) | 0.981 | (0.974 to 0.987) | <0.001 | 0.979 | (0.973 to 0.985) | <0.001 | |
| ICD10 code | |||||||
| [F11] Mental and behavioural disorders due to use of opioids | 9.52 | (9.17 to 9.89) | <0.001 | 8.96 | (8.64 to 9.28) | <0.001 | |
| [T40] Poisoning by narcotics and psychodysleptics | 0.09 | (0.07 to 0.10) | <0.001 | 0.08 | (0.07 to 0.10) | <0.001 | |
| [T400] Opium | 0.08 | (0.07 to 0.09) | <0.001 | 0.08 | (0.07 to 0.09) | <0.001 | |
| [T401] Heroin | 0.14 | (0.13 to 0.15) | <0.001 | 0.13 | (0.13 to 0.14) | <0.001 | |
| [T402] Other opioids | Ref | 1 | 1 | ||||
| [T403] Methadone | 0.1 | (0.10 to 0.11) | <0.001 | 0.1 | (0.10 to 0.11) | <0.001 | |
| [T404] Other narcotics | 0.14 | (0.13 to 0.16) | <0.001 | 0.14 | (0.13 to 0.16) | <0.001 | |
| [T406] Unspecified narcotics | 1.65 | (1.57 to 1.73) | <0.001 | 1.66 | (1.58 to 1.73) | <0.001 | |
ICD10, International Classification of Diseases, version 10; PR, proportion ratios.
In multivariate analysis, a 2.1% yearly decrease (95% CI 1.5% to 2.7%) in the proportion of OUD-related ED visits was observed between 2010 and 2018. A 40% increase in visits (95% CI 36% to 44%) was observed in men compared with women. The largest increase in terms of age was observed in the 30–39 age group (45%, 95% CI 42% to 47%), while the largest decrease was in the 0–9 (83%, 95% CI 82% to 83%) and 70+ age groups (77%, 95% CI 76% to 78%). The ICD10 code ‘Mental and behavioural disorders due to use of opioid’ (F11) was associated with an increase in the proportion of OUD-related ED visits (896%, 95% CI 864% to 928%). Significant differences in proportions were observed across France’s various administrative regions. Those with the greatest decrease in the proportion of visits were the overseas regions of French Guiana (81%, 95% CI 72% to 87%) and Mayotte (82%, 95% CI 70% to 90%). The regions with the highest increases in OUD-related ED visits were Brittany (61%, 95% CI 50% to 72%), Provence-Alpes-Côte-d’Azur (40%, 95% CI 32% to 49%) and Hauts-de-France (33%, 95% CI 25% to 41%).
Post-ED visit hospitalisations
We found 15 966 OUD-related hospitalisations (46.5% of ED visits for OUD) from a total of 20 359 574 hospitalisations after ED visits (78.4/100 000 hospitalisations). During the study period, an increase in the proportion of OUD-related hospitalisations was observed, from 74.0/100 000 in 2010 to 81.4/100 000 in 2018 (figure 1B). This increase was highest in the 20–49 years old age group and lowest in 0–9 and 70+ years old age groups. Although young patients had the highest all-cause hospitalisation proportion (247.8/100 000 hospitaliations) they had the lowest proportions after an ED visit for OUD (35.9%). Hospitalisation after an OUD-related ED visit was highest among elderly patients (68.6%).
Chief complaints
From the 34 362 OUD-related ED visits, we extracted 17 938 non-empty chief complaints (52.2%). After free-text analysis, we linked 11 978 (66.8%) chief complaints to an ICD10 code leaving 5960 which could not be used due to lack of precision or non-medical information. A wide variety was observed in the 11 978 chief complaints, with 244 unique codes being used. The most frequent codes were ‘Drugs and biological substances poisoning’ [T509] (27.8%), ‘Malaise and fatigue or Coma or Syncope’ [R53-R40] (11.3%), ‘Mental behavioural disorders due to multiple drug use, alcohol’ [F10] (11.1%). ICD10 codes used for identifying visits [T40.X, F11] accounted for 2.2% of the chief complaints. See online supplemental file 1 for a more detailed list of frequent chief complaints.
bmjopen-2020-037425supp001.pdf (46.3KB, pdf)
OUD-related diagnoses
We identified 27 952 ED visits where OUD was the primary discharge diagnosis. Of these, 4981 (17.9%) had at least one related diagnosis for a total of 6940 related diagnoses. We identified 6410 ED visits where OUD was the secondary discharge diagnosis. We extracted a total of 13 350 related diagnoses of an ED visit for OUD, resulting in 607 unique related diagnoses. The most frequent related diagnoses were ‘Mental and behavioural disorders due to use of alcohol’ [F10] (11.2%), ‘Benzodiazepines poisoning’ [T424] (7.8%), ‘Mental and behavioural disorders due to use of opioid’ [F11] (4.1%), ‘Intentional self-poisoning by and exposure to narcotics and psychodysleptics’ [X62] (3.7%), ‘Poisoning by non-opioid analgesics, antipyretics and antirheumatics’ [X42] (3.0%), ‘Somnolence, stupor and coma’ [R40] (2.8%) and ‘Depressive episode’ [F32] (2.9%).
We performed a subgroup analysis in the three age groups observed earlier. In the paediatric population (0–7 years), accidental poisoning [X40-49] accounted for 37.9% of related diagnoses while other poisoning [T39-44] accounted for 24.2%. In the 18–50 years old population, related diagnoses were similar to those of the overall population, the most frequent diagnosis in men being ‘Mental and behavioural disorders due to use of alcohol’ [F10] (15.3%), and ‘Benzodiazepines poisoning’ [T424] in women (10.6%). For visits in patients 75 years of age and older, most of the related diagnoses were comorbidities (‘Acute renal failure’, ‘Volume depletion’, ‘Congestive heart failure’, etc) rather than diagnoses associated with other poisoning which was seen in the other age groups. See online supplemental file 2 for a detailed list of frequent related diagnoses.
bmjopen-2020-037425supp002.pdf (66.5KB, pdf)
Discussion
Key results
This is the first study to use ED data to investigate OUD in France. We showed a 2.1% decrease per year in the proportion of OUD-related ED visits between 2010 and 2018 after adjusting for gender, age, administrative region and ICD10 code. This contrasts with data in USA, where the proportion of OUD-related ED visits observed in 2010 was 63/100 00018 with an increase between 2011 and 2015.17 However, our data are consistent with those previously observed in France showing relative stability between 2004 and 2017 in opioid consumption. The discrepancy between the increase in the raw numbers of OUD-related ED visits and the decrease in the proportion of visits can be explained by the increase in total ED activity in France,33 a phenomenon seen worldwide.34
We described different populations of interest, showing differences in ED use according to age and gender. We identified three subgroups of interest. The first comprised children from 0 to 7 years, mostly affected by accidental poisoning. The two others comprised mainly young men and elderly women, respectively. A percentage of the former was associated with recreational drug consumption and polydrug abuse, while the latter included a visit for a comorbidity linked to side effects of opioids prescribed for chronic pain.
‘Mental and behavioural disorders due to use of opioids’ [F11] was the most frequent code found for OUD identification, accounting for 60% of ED visits. This code includes concepts such as intoxication, withdrawal and addiction, and refers to a psychiatric diagnosis, while other codes (eg, [T40X]) are related to a diagnosis of poisoning.
The increasing trend in hospitalisation after an OUD-related ED visit, from 41.9% in 2010 to 48.8% in 2018, indicates an increase in the severity of OUD over time. The 20–40 years old age group was three times more likely to be hospitalised than the other age groups. The difference in hospitalisations per 100 000 hospitalisations and the proportion hospitalised after an OUD-related ED visit across the various age groups indicates that although the severity of OUD is greater among the elderly, they are mostly hospitalised for reasons other than OUD, while among young patients OUD-related hospitalisations were more frequent than expected.
The increase in hospitalisation proportions may be explained by several assumptions. It may be due to an increased severity over the study period. This severity may be explained by a shift in the type of product consumption toward stronger opioids or in the population using opioids. However this assumption is not easily assessed as the severity score is not accurately recorded. Another assumption could be a change in the clinical management of these patients due to an awareness on OUD.
The chief complaint does not appear to be an appropriate/useful indicator for OUD identification, at least using the OSCOUR database, due to the proportion of missing data, unexploitable data and the fact that only 2.2% of the exploitable chief complaints were very similar to the identification codes. One possible explanation for this is that the chief complaint is coded at the patient’s entry by paramedical staff with a lack of standardisation to guide the priority of care.
Analysis of related diagnoses showed an association of OUD-related ED visits with alcohol and benzodiazepine poisoning, which describes a polydrug abuse population, something previously reported.35 36 OUD was also linked to psychiatric disorders such as depressive episodes or attempted drug-based suicide, and varied between the different subgroups identified through this study.
Interpretation
These results would suggest that the change over time for OUD-related ED visits in France is consistent with previous findings in the country.9 11 They should however be interpreted with caution, as different coding practices (depending on ED or physician practices) and the fact that data on other variables were not collected in the present study, may partly explain this trend. The difference observed between France and the USA could partially be explained by opioid dispensing legislation. In France, strong opioids are listed as narcotics. They can only be prescribed for 28 days, and all refills necessitate mandatory medical evaluation. The current epidemic situation in other countries has also raised awareness about OUD, leading to guidelines at the national37 and European levels.38
Limitations
This study has several limitations. Due to the increase in participation over time in the OSCOUR network, the findings might reflect discrepancies in the coding practices used in different ED.
With respect to the identification of ED visits, although the ICD10 codes were selected after a literature review, no evaluation of the code identification performance has been performed internationally. Having said that, an evaluation of the now obsolete ICD9 codes showed a positive predictive value of 81%.21 Moreover, missing values for codes (25.6% of all ED visits) may have led to biassed estimates regarding the proportion of ED visits. Nevertheless, the trend shown in this study is very likely robust because missing data were homogeneous throughout the study period.
In the data source, we lacked clinical data such as vital signs at admission, radiological nor biological tests and we had no individual socioeconomic variables regarding education, salary or other variables reflecting social inequalities, which limits conclusions on the differences reported.
OUD may also have been underestimated through potential selection bias, since the most serious cases are admitted directly to intensive care units and do not go through the ED. Furthermore, it is sometimes difficult to make a definitive diagnosis of OUD in ED visits, which leads to classification bias, which in turn leads to underestimation of OUD-related visits.
Moreover, as it was impossible for us to link several potential ED visits for the same patient, it was not possible to identify subgroups of patients who were more likely to make return visits to the ED for further consultation.
Conclusion
This study describes the use of ED for OUD-related issues in France based on a nationwide syndromic surveillance system. It provides insight into trends in OUD-related ED visits and related populations.
To complete the picture of health system utilisation for OUD, it would be interesting to develop a description of the hospitalised population from another data source, in order to better identify the characteristics of these patients. Adding social inequality variables would help to better understand their burden on opioid consumption.
We showed a decreasing trend in the proportion of OUD-related ED visits between 2010 and 2018 and an increasing trend in hospitalisation after an OUD-related ED visit.
Our results demonstrated that the OSCOUR syndromic surveillance system is suitable and useful to monitor near real-time trends in OUD, and that it should be routinely used for this purpose.
Supplementary Material
Acknowledgments
We would like to thank the emergency department physicians from FEDORU for their participation in workshops. Our thanks also to Jean-Claude Desenclos, Scientific Director of Santé Publique France and copyeditor Jude Sweeney for their valuable advice when reviewing this manuscript.
Footnotes
Contributors: CC-S, YLS and MMT designed the study. YG, AM and MMT performed the review of literature. YG and YLS performed the analysis. YG drafted the first version of the article. AM, CC-S, YLS and MMT critically revised the article. All authors discussed the results and contributed to the final manuscript.
Funding: The authors have not declared a specific grant for this research from any funding agency in the public, commercial or not-for-profit sectors.
Competing interests: None declared.
Patient consent for publication: Not required.
Provenance and peer review: Not commissioned; externally peer reviewed.
Data availability statement: Data are available upon reasonable request. Researchers who provide a methodologically valid request can, under certain conditions, obtain all individual-level data, the analysis protocol and code scripts by contacting the corresponding author.
Supplemental material This content has been supplied by the author(s). It has not been vetted by BMJ Publishing Group Limited (BMJ) and may not have been peer-reviewed. Any opinions or recommendations discussed are solely those of the author(s) and are not endorsed by BMJ. BMJ disclaims all liability and responsibility arising from any reliance placed on the content. Where the content includes any translated material, BMJ does not warrant the accuracy and reliability of the translations (including but not limited to local regulations, clinical guidelines, terminology, drug names and drug dosages), and is not responsible for any error and/or omissions arising from translation and adaptation or otherwise.
References
- 1.Rudd RA, Seth P, David F, et al. Increases in drug and opioid-involved overdose deaths — United States, 2010–2015. MMWR Morb Mortal Wkly Rep 2016;65:1445–52. 10.15585/mmwr.mm655051e1 [DOI] [PubMed] [Google Scholar]
- 2.Compton WM, Jones CM, Baldwin GT. Relationship between nonmedical prescription-opioid use and heroin use. N Engl J Med 2016;374:154–63. 10.1056/NEJMra1508490 [DOI] [PMC free article] [PubMed] [Google Scholar]
- 3.CDC opioid V1 | Knowledge repository. Available: https://www.surveillancerepository.org/cdc-opioid-v1 [Accessed 1 Jul 2019].
- 4.Kertesz SG. Turning the tide or RIPtide? the changing opioid epidemic. Substance Abuse 2017;38:3–8. 10.1080/08897077.2016.1261070 [DOI] [PubMed] [Google Scholar]
- 5.Kuehn B. Declining opioid prescriptions. JAMA 2019;321:736 10.1001/jama.2019.0647 [DOI] [PubMed] [Google Scholar]
- 6.Fischer B, Jones W, Rehm J. Trends and changes in prescription opioid analgesic dispensing in Canada 2005–2012: an update with a focus on recent interventions. BMC Health Serv Res 2014;14:90. 10.1186/1472-6963-14-90 [DOI] [PMC free article] [PubMed] [Google Scholar]
- 7.Zin CS, Chen L-C, Knaggs RD. Changes in trends and pattern of strong opioid prescribing in primary care: strong opioid prescribing in the United Kingdom. Eur J Pain 2014;18:1343–51. [DOI] [PMC free article] [PubMed] [Google Scholar]
- 8.Schubert I, Ihle P, Sabatowski R. Increase in opiate prescription in Germany between 2000 and 2010. Dtsch Aerzteblatt Online 2013. 10.3238/arztebl.2013.0045 [DOI] [PMC free article] [PubMed] [Google Scholar]
- 9.Chenaf C, Kaboré J-L, Delorme J, et al. Prescription opioid analgesic use in France: trends and impact on morbidity-mortality. Eur J Pain 2019;23:124–34. 10.1002/ejp.1291 [DOI] [PubMed] [Google Scholar]
- 10.Rapport OFDT : Drogues et Addictions, Données Essentielles. Available: https://www.ofdt.fr/publications/collections/rapports/ouvrages-collectifs/drogues-et-addictions-donnees-essentielles/ [Accessed 21 october 2020].
- 11.ANSM Rapport Antalgiques Opioides, 2019. Available: https://ansm.sante.fr/content/download/157015/2058811/version/3/file/Rapport_Antalgiques-Opioides_Fev-2019_3.pdf_2019-03-06.pdf [Accessed 21 october 2020].
- 12.Bernard S. Influenza activity in France, season 2017-2018. Bull Epidémiologique Hebd 2018;34:664–74. [Google Scholar]
- 13.Miron O, Yu K-H, Wilf-Miron R, et al. Suicide rates among adolescents and young adults in the United States, 2000-2017. JAMA 2019;321:2362–4. 10.1001/jama.2019.5054 [DOI] [PMC free article] [PubMed] [Google Scholar]
- 14.Fougère E, Caserio-Schönemann C, Daoudi J, et al. Syndromic surveillance and UEFA Euro 2016 in France – health impact assessment. Online J Public Health Inform 2017;9 10.5210/ojphi.v9i1.7769 [DOI] [Google Scholar]
- 15.Vandentorren S, Paty A-C, Baffert E, et al. Syndromic surveillance during the Paris terrorist attacks. The Lancet 2016;387:846–7. 10.1016/S0140-6736(16)00507-9 [DOI] [PubMed] [Google Scholar]
- 16.Meynard J-B, Chaudet H, Texier G, et al. Value of syndromic surveillance within the armed forces for early warning during a dengue fever outbreak in French Guiana in 2006. BMC Med Inform Decis Mak 2008;8:29. 10.1186/1472-6947-8-29 [DOI] [PMC free article] [PubMed] [Google Scholar]
- 17.Daly ER, Dufault K, Swenson DJ, et al. Use of emergency department data to monitor and respond to an increase in opioid overdoses in New Hampshire, 2011-2015. Public Health Rep 2017;132:73S–9. 10.1177/0033354917707934 [DOI] [PMC free article] [PubMed] [Google Scholar]
- 18.Hasegawa K, Espinola JA, Brown DFM, et al. Trends in US emergency department visits for opioid overdose, 1993–2010. Pain Med 2014;15:1765–70. [DOI] [PubMed] [Google Scholar]
- 19.ICD ICD-10 - International classification of diseases, 10th revision. Available: https://www.cdc.gov/nchs/icd/icd10.htm [Accessed 1 Jul 2019].
- 20.Caserio-Schönemann C, Meynard JB. Ten years experience of syndromic surveillance for civil and military public health, France, 2004-2014. Euro Surveill 2015;20:21126. 10.2807/1560-7917.ES2015.20.19.21126 [DOI] [PubMed] [Google Scholar]
- 21.Green CA, Perrin NA, Janoff SL, et al. Assessing the accuracy of opioid overdose and poisoning codes in diagnostic information from electronic health records, claims data, and death records. Pharmacoepidemiol Drug Saf 2017;26:509–17. 10.1002/pds.4157 [DOI] [PubMed] [Google Scholar]
- 22.Singleton MD, Rock PJ. Assessment of a surveillance case definition for heroin overdose in emergency medical services data. Online J Public Health Inform 2018;10 10.5210/ojphi.v10i1.8353 [DOI] [Google Scholar]
- 23.O'Connor S, Grywacheski V, Louie K. At-a-glance - hospitalizations and emergency department visits due to opioid poisoning in Canada. Health Promot Chronic Dis Prev Can 2018;38:244–7. 10.24095/hpcdp.38.6.04 [DOI] [PMC free article] [PubMed] [Google Scholar]
- 24.Scholl L, Seth P, Kariisa M, et al. And opioid-involved overdose deaths — United States, 2013–2017. Morb Mortal Wkly Rep 2018;67:1419–27. [DOI] [PMC free article] [PubMed] [Google Scholar]
- 25.Walsh A. Going beyond chief complaints to identify opioid-related emergency department visits. Online J Public Health Inform 2017;9 10.5210/ojphi.v9i1.7617 [DOI] [Google Scholar]
- 26.Bjørn A-MB, Jepsen P, Larsson HJ, et al. Hospitalizations for opioid poisoning: a nation-wide population-based study in Denmark, 1998-2004. Addiction 2009;104:104–8. 10.1111/j.1360-0443.2008.02420.x [DOI] [PubMed] [Google Scholar]
- 27.Burns EM, Rigby E, Mamidanna R, et al. Systematic review of discharge coding accuracy. J Public Health 2012;34:138–48. 10.1093/pubmed/fdr054 [DOI] [PMC free article] [PubMed] [Google Scholar]
- 28.Fernandez W, Hackman H, Mckeown L, et al. Trends in opioid-related fatal overdoses in Massachusetts, 1990–2003. J Subst Abuse Treat 2006;31:151–6. 10.1016/j.jsat.2006.04.008 [DOI] [PubMed] [Google Scholar]
- 29.Ising A, Proescholdbell S, Harmon KJ, et al. Use of syndromic surveillance data to monitor poisonings and drug overdoses in state and local public health agencies. Inj Prev 2016;22:i43–9. 10.1136/injuryprev-2015-041821 [DOI] [PubMed] [Google Scholar]
- 30.Royston P, Ambler G, Sauerbrei W. The use of fractional polynomials to model continuous risk variables in epidemiology. Int J Epidemiol 1999;28:964–74. 10.1093/ije/28.5.964 [DOI] [PubMed] [Google Scholar]
- 31.von Elm E, Altman DG, Egger M, et al. The strengthening the reporting of observational studies in epidemiology (STROBE) statement: guidelines for reporting observational studies. J Clin Epidemiol 2008;61:344–9. 10.1016/j.jclinepi.2007.11.008 [DOI] [PubMed] [Google Scholar]
- 32.R Development Core Team R: a language and environment for statistical computing. Vienna, Austria, 2008. Available: http://www.R-project.org
- 33.Naouri D, El Khoury C, Vincent-Cassy C, et al. The French emergency national survey: a description of emergency departments and patients in France. PLoS One 2018;13:e0198474. 10.1371/journal.pone.0198474 [DOI] [PMC free article] [PubMed] [Google Scholar]
- 34.Tang E, Ravaud P, Riveros C, et al. Comparison of serious adverse events posted at ClinicalTrials.gov and published in corresponding Journal articles. BMC Med 2015;13:189. 10.1186/s12916-015-0430-4 [DOI] [PMC free article] [PubMed] [Google Scholar]
- 35.Jones JD, Mogali S, Comer SD. Polydrug abuse: a review of opioid and benzodiazepine combination use. Drug Alcohol Depend 2012;125:8–18. 10.1016/j.drugalcdep.2012.07.004 [DOI] [PMC free article] [PubMed] [Google Scholar]
- 36.Lavie E, Fatséas M, Denis C, et al. Benzodiazepine use among opiate-dependent subjects in buprenorphine maintenance treatment: correlates of use, abuse and dependence. Drug Alcohol Depend 2009;99:338–44. 10.1016/j.drugalcdep.2008.07.017 [DOI] [PubMed] [Google Scholar]
- 37.SFETD Recommandations de Bonne Pratique Clinique Par Consensus Formalisé (Janvier 2016): Utilisation Des Opioïdes Forts Dans La Douleur Chronique Non Cancéreuse Chez l’adulte, 2016. [DOI] [PubMed] [Google Scholar]
- 38.O’Brien T, Christrup LL, Drewes AM, et al. European pain federation position paper on appropriate opioid use in chronic pain management. Eur J Pain 2017;21:3–19. 10.1002/ejp.970 [DOI] [PMC free article] [PubMed] [Google Scholar]
Associated Data
This section collects any data citations, data availability statements, or supplementary materials included in this article.
Supplementary Materials
bmjopen-2020-037425supp001.pdf (46.3KB, pdf)
bmjopen-2020-037425supp002.pdf (66.5KB, pdf)