

Abstract
To characterize the thermosensitive coil–globule transition in atomistic detail, the conformational dynamics of linear polymer chains of acrylamide-based polymers have been investigated at multiple temperatures. Therefore, molecular dynamic simulations of 30mers of polyacrylamide (AAm), poly-N-methylacrylamide (NMAAm), poly-N-ethylacrylamide (NEAAm), and poly-N-isopropylacrylamide (NIPAAm) have been performed at temperatures ranging from 250 to 360 K for 2 μs. While two of the polymers are known to exhibit thermosensitivity (NEAAm, NIPAAm), no thermosensitivity is observed for AAm and NMAAm in aqueous solution. Our computer simulations consistently reproduce these properties. To understand the thermosensitivity of the respective polymers, the conformational ensembles at different temperatures have been separated according to the coil–globule transition. The coil and globule conformational ensembles were exhaustively analyzed in terms of hydrogen bonding with the solvent, the change of the solvent accessible surface, and enthalpic contributions. Surprisingly, independent of different thermosensitive properties of the four polymers, the surface affinity to water of coil conformations is higher than for globule conformations. Therefore, polymer–solvent interactions stabilize coil conformations at all temperatures. Nevertheless, the enthalpic contributions alone cannot explain the differences in thermosensitivity. This clearly implies that entropy is the distinctive factor for thermosensitivity. With increasing side chain length, the lifetime of the hydrogen bonds between the polymer surface and water is extended. Thus, we surmise that a longer side chain induces a larger entropic penalty due to immobilization of water molecules.
1. Introduction
Since their first discovery, thermosensitive polymers (TSPs) have been the subject of interest in many different fields of research.1−4 Next to medical applications, such as tissue engineering, bioseparation, and drug delivery,5−10 they have been proven to be highly valuable as programmable materials11 and for gel actuators amongst other things. Their development has advanced to the point that it is now possible to use TSPs as a remote-controlled drug delivery platform in cancer therapy.12 Crucial for the majority of the applications is the extraordinary phase behavior of these polymers. Counterintuitively, depending on solvent conditions, TSPs undergo a liquid–gel-phase transition with a lower critical solution temperature (LCST). Thus, above the associated phase transition temperature, TSPs form a viscoelastic gel, whereas below, they are found to be in a liquid mixture with the solvent.13
The above-mentioned macroscopic liquid-gel phase transition of TSPs has been linked to a microscopic conformational rearrangement, i.e., the coil–globule transition (CGT).14−16 While the liquid–gel-phase transition can be measured by clear changes in the properties of the bulk fluid, such as the change of opacity, the conformational CGT can be reproduced in experiments in dilute solution, without necessarily exhibiting a phase transition of the liquid mixture.15,17−20 Since detailed information about polymer conformations is extremely challenging to be obtained experimentally, this transition is solely defined by the change in the size distribution of the polymer chains in solution. At “low temperatures”, i.e., below the CGT temperature T < T*, TSPs exist in extended conformations, indicated by a large radius of gyration (Rg). However, at “high temperatures”, T > T*, the polymer chains collapse, exhibiting a clearly lower distribution of Rg. Conventionally, the extended conformational state is called coil (C), whereas the collapsed state is called globule (G).13,21,22
Experimental studies have been complemented by computational investigations to study the conformational changes of polymers on an atomistic level. Molecular dynamic (MD) simulations have been established as the state-of-the-art method.23,24 Nevertheless, there are multiple reasons, why characterizing the CGT is computationally challenging: One important aspect is that none of the two conformational states, i.e., neither C nor G, are defined by distinct structural descriptors. Consequently, the conformational space is large in both conformational states, the C and the G subensembles.25 Hence, the CGT is fundamentally different from protein-folding processes in that respect.26 The absence of a well-defined fold leads to an insuperable uncertainty of whether the captured conformational subspace comprises the most favorable conformational states, i.e., the lowest free energy minima. Thus, both states can be very diverse conformationally. In fact, there is experimental evidence for conformational substates within the G, which can be separated kinetically.27
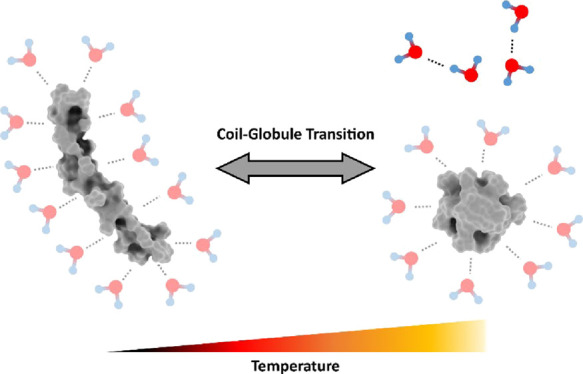
Due to the slow timescale of the transition between C and G, it is a challenge to achieve sufficient conformational sampling. Hence, it is not trivial to assess how large the variance of thermodynamic and structural properties within C and G may be. Furthermore, depending on the simulation temperature, it is very challenging to sample a large number of transitions. Therefore, reliable ensemble averages can only be estimated from long simulations, in particular, at low simulation temperatures.28−30 The slow timescale of the conformational transition translates to a large barrier in free energy, which can often only be overcome by sophisticated advanced sampling methods.31 Albeit often compared with protein folding/denaturation processes, the conformational collapse of TSPs has often been studied with comparably short simulation time.32,33 We schematically depict the CGT in Figure 1.
Figure 1.
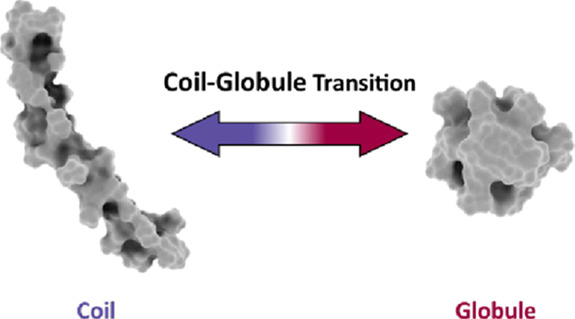
Schematic illustration of the coil–globule transition (CGT). Exemplary structures of coil and globule conformations of NIPAAm are shown.
To explain the thermosensitivity of the CGT, the free energy of the process needs to be evaluated at different temperatures.31 Generally, the free energy can be separated into enthalpic and entropic contributions. Whereas the entropic contributions to the free energy can be a challenge to obtain, the enthalpic contributions can be estimated by calculating the internal energy difference between the two states, i.e., C and G. To our knowledge, these contributions to the free energy of the CGT have not been assessed in detail before. In this study, we aim to systematically compare C and G conformations at different temperatures with respect to their difference in enthalpy. Furthermore, we performed a detailed analysis of the hydration of the C and G subensembles since we expect the interactions with water to be of crucial importance for the energy balance of the transition. Moreover, to facilitate the understanding of the thermosensitive character of the transition, we investigated a set of polymers, which are partly TSP and partly non-TSP (see below).
To compare the two conformational states, i.e., C and G, at different temperatures, we separated the conformational ensembles accordingly on the basis of established structural descriptors. Since the C and G ensemble are defined by the size distribution of the polymer chains in experiments, we calculate the radius of gyration (Rg) and the hydrodynamic radius (Rh) of the conformational ensembles, which we obtained from our simulations at different temperatures. Furthermore, we calculated the solvent accessible surface area (σ), which has been shown to be a useful additional indicator to distinguish C and G.31,34 In addition, we calculated the persistence length of the polymers, as a measure for the general stiffness of the polymer chains.35,36
Furthermore, we rigorously quantified the contributions to the enthalpy of the CGT process, which originate from polymer–solvent, solvent–solvent, and internal interactions of the polymer, respectively. Moreover, we calculated the lifetimes of hydrogen bonds between the polymer and solvent. A comparison of these lifetimes is useful to evaluate the hydration entropy qualitatively. As already mentioned before, to obtain reasonable estimates for the mean internal energies, sufficient sampling is crucial. Therefore, we invested a significantly longer simulation time than previous studies to minimize the bias introduced by arbitrarily chosen starting structures.
To better understand the onset of the thermosensitivity of the CGT, we compared a set of chemically closely related polymers. Despite their close relationship, they differ in their thermosensitive behavior, one half being TSPs and the other half being non-TSPs. Comparing more than one representative of both TSP and non-TSP opens up the possibility to make more general statements about the differences between these two classes of polymers. To interpret the results of simulations of TSPs consistently, it is crucial to validate the force field with non-TSPs also. Furthermore, examination of additional TSPs next to NIPAAm, a prominent model system for the thermosensitive CGT,22,37 is highly beneficial to determine the decisive mechanisms for the thermosensitivity. To our knowledge, TSPs and non-TSPs have very rarely been compared systematically before.38
1.1. Model Systems
We selected four acrylamide-based polymers as model systems: besides poly-N-isopropylacrylamide (NIPAAm), we simulated three additional closely related polymers. We systematically decreased the length of the substituent at the nitrogen, obtaining poly-N-ethylacrylamide (NEAAm), poly-N-methylacrylamid (NMAAm), and polyacrylamide (AAm). These polymers are displayed in Figure 2. NEAAm and NIPAAm are known to undergo a thermosensitive transition with a LCST of T* ≈ 347 K,4,22 and T* ≈ 305 K,1,18,21 respectively. AAm on the other hand is an example for a non-TSP in watery solution.39 NMAAm has been conjectured to exhibit an LCST above 373 K, in aqueous solution.4,22 To our knowledge, this assertion has hitherto not been confirmed experimentally. Therefore, we expect it to be nonthermosensitive in the investigated range of temperatures.
Figure 2.
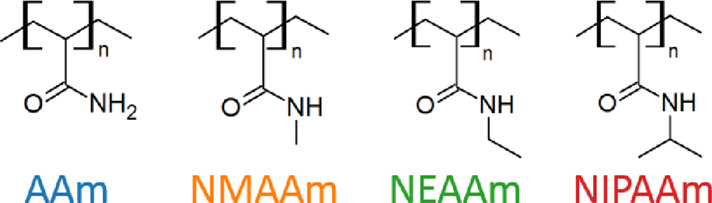
Set of closely related acrylamide-based polymers. We introduce colors for easier identification in figures below. From left to right: in blue, polyacrylamide (AAm); in orange, poly-N-methylacrylamide (NMAAm); in green, poly-N-ethylacrylamide (NEAAm); and in red, poly-N-isopropylacrylamide (NIPAAm).
Generally, the existence of the CGT and the actual transition temperature of linear polymer chains also depend on the chain length.40−42 We chose to simulate polymer chains with 30 monomer units since the 30mer is a well-established model system for the CGT of NIPAAm.41,43,44
2. Computational Methods
2.1. Simulation Setup
As starting structures for the MD simulations, we prepared extended conformations of syntactic 30mers of AAm, NMAAm, NEAAm, and NIPAAm, making use of the Maestro software package.45 We solvated these structures in cubic boxes with a side length of 8 nm with SPC/E water.46,47 Prior to the MD simulations, we minimized the initial configurations using the steepest descent method. Before the production runs, we equilibrated the system in short NVT simulations. Except for the preparation of the initial polymer configuration, we used the GROMACS MD-simulation software package.48 For all simulations, we used the OPLS2005 force field,49,50 which has been established for simulations of NIPAAm in previous publications.31,43,44,51−53 We show force-field parameters in the Supporting Information. In our production runs, we applied the Parinello–Rahman barostat,54,55 with a reference pressure of 1 bar and the velocity-rescaling thermostat56 at respective simulation temperatures ranging from 250 to 360 K. We used the LINCS algorithm to constrain the bonds involving hydrogen atoms and used a timestep of 2 fs for our MD integration.57,58 All production runs were performed with a simulation length of 2 μs. Throughout all simulations, we applied periodic boundary conditions and used the particle mesh Ewald method for treating long-range electrostatic interactions.59
2.2. Conformational Analysis
We calculated the radius of gyration (Rg) and the solvent accessible surface area (σ) of conformations sampled every 20 ps in our trajectory. For these analyses, we used the GROMACS tools.60,61 Following our previously published approach, we defined the conformational subensembles of C and G in the joint Rg-σ plane.31 Thus, we separated populations in the two-dimensional histograms in this space. We verified this conformational distinction by visual inspection of the structures. Furthermore, we validated the ratio of the mean Rg within both subensembles. This method led to a temperature-independent conformational criterion for every polymer to identify C or G, respectively. Therewith, we were able to separate C and G conformations at all applicable temperatures, which facilitated the systematic comparison of these two conformational states.
As an additional metric for the dimensions of the polymers, we calculated the hydrodynamic radius (Rh) of snapshots along our trajectory. Therefore, we used HYDROpro software to process conformations, which we sampled every 10 ns.62 By calculating the ratio of Rg over Rh,
| 1 |
we were able to evaluate the compactness of the conformations of the polymer chains. Typically, we find ρ ≈ 0.7 for globular structures, whereas ρ > 1 for extended conformations, i.e., the C.63−66
Furthermore, to quantify the polymer stiffness, we calculated the persistence length. An introduction into the methodology, as well as all related results and discussion, can be found in the Supporting Information.
2.3. Hydration Analysis
To quantify polymer–polymer and polymer–water interactions, we performed a detailed analysis of hydrogen bonds. Therefore, we considered oxygen atoms of the polymer to be hydrogen bond acceptors and nitrogen atoms of the polymers and oxygen atoms of water molecules to be able to accept and donate hydrogen bonds. We applied a combined criterion for hydrogen bonds: first, donor and acceptor atoms need to be 3.5 Å or closer, and second, the angle between the atoms of hydrogen-donor–acceptor needs to be 30° or smaller. We separately counted the hydrogens between the following pairs of sets of atoms: polymer–polymer, polymer–water, polymer oxygen–water, and polymer nitrogen–water. To compare the polymers with respect to their interaction with water, we calculated the mean number of hydrogen bonds between the polymers and water (ν). For this analysis, we separated the structural subensembles of C and G (see above) and calculated the mean within these subensembles for all polymers at every applicable temperature. As a measure for the affinity of the surface of the polymers to water, we calculated the number of hydrogen bonds per solvent accessible surface area νσ = ν/σ. Likewise, we calculated these quantities for C and G separately.
Furthermore, we estimated the lifetime of the hydrogen bonds of the polymers with water from the autocorrelation of the existence function of the hydrogen bonds.67 Therefore, we separately analyzed the hydrogen bonds with the nitrogen of the polymer and the oxygen of the polymer and water at different temperatures. To judge the lifetimes of the hydrogen bonds at different temperatures, we performed analogous analyses of pure water simulations and used the lifetime of the hydrogen bonds between water molecules in bulk water at different temperatures as reference.
2.4. Thermodynamic Analysis
To quantify the enthalpy of the CGT at different temperatures, we separately calculated the following contributions
| 2 |
where ΔCGHSol is the difference in the enthalpy of solvent–solvent interactions, ΔCGHPol is the difference in enthalpy of the polymer, and ΔCGHPol – Sol is the difference in enthalpy of polymer–solvent interactions. All these differences ΔCG are calculated as mean changes with the conformational transition, at the respective temperature. Under the assumption that no work is done (ΔCGV = 0), we estimate the enthalpy of the CGT by the internal energy. Therefore, we calculated the enthalpy of conformations as the sum of the nonbonded potential energy terms of the respective groups, i.e., Lennard–Jones and electrostatic potentials. These potential energies have been obtained with the energy-group feature of the rerun functionality of GROMACS. In the framework of this analysis, we also took the change in the potential energy of the torsional degrees of freedom of the polymer into account. Since we ascertained that the contribution of this term to the enthalpy difference is two magnitudes smaller than the other contributions, we neglected it in the following.
Since the solvent accessible surface area decreases with the CGT, the number of water molecules bound to G is expected to be smaller than for C. Therefore, the number of polymer–solvent interactions is expected to decrease, with the collapse of the polymer chain. At the same time, the number of solvent–solvent interactions is expected to increase. Furthermore, the number of polymer–polymer interactions is expected to increase with the CGT. Assuming the number of interaction sites of solvent and polymers to be conserved, we reason that for every two water molecules, which unbind from the polymer, a water–water and a polymer–polymer bond are formed. Furthermore, assuming all bonds to be energetically equivalent (solvent–solvent, polymer–solvent, and polymer–polymer), in a crude approximation
| 3 |
follows. Thus, after a small rearrangement we obtain
| 4 |
These assumptions may be very inaccurate for other compounds, depending on the affinity of the accessible chemical groups to water. We will test the validity of these assumptions based on our simulation data.
3. Results
3.1. Conformational Analysis and Thermosensitivity
To facilitate the comparison of C and G, we separated our conformational ensembles at different temperatures accordingly. Therefore, we projected all sampled polymer conformations onto the Rg-σ plane for each polymer species (see Figure S5). Since we aimed to achieve a temperature-independent classification, we used the conformations from simulations at all temperatures to make our state definition. In these two-dimensional histograms, we separated the conformational subensembles C and G for every polymer in the series. We note that this separation becomes less distinct with decreasing side chain length. In particular, for the polymers, which do not exhibit a thermosensitive CGT, i.e., AAm and NMAAm, the C ensemble is less pronounced. For comparison, the criteria for the state definition are shown in Figure S6. Furthermore, we show the defined state borders for every polymer and the mean properties within the C and G subensembles in Figures S7 and S8, respectively. There, we can observe that the state borders follow a consistent trend and that Rg(coil) over Rg(globule) is between 1.2 and 1.4 for all polymers. Additionally, we note that the latter relation appears to be systematically lower for non-TSP than for TSP.
With this state definition, we identified the predominant conformational state in the simulations at different temperatures. In Figure 3, we show the mean conformational state at different temperatures for every polymer. Here, the eventual temperature sensitivity is visible. It is apparent that only NEAAm and NIPAAm show a thermosensitive transition. From the turning point of the logistic fit of the mean state, we obtain an estimate for the CGT temperature. According to these fits, we report T* = 281 K for NEAAm and T* = 272 K for NIPAAm, respectively. We show the underlying timeseries of Rg, σ, and the conformational state we derived from these two quantities, for all temperatures and all polymers in Figures S1–S4.
Figure 3.

Mean conformational state at different simulation temperatures (T), calculated with the state definition in two-dimensional Rg-σ histograms (Figure S5). Here, we show the arithmetic mean of the assigned states over all frames in our 2 μs simulations. The error bars represent the standard error of the mean. From top to bottom, in respective colors and symbols: in blue triangles, we show data points from simulations of AAm; in orange squares, NMAAm; in green diamonds, NEAAm; and in red crosses, NIPAAm. Where applicable, we show a logistic fit of the data and depict the turning point of the curve with a dashed line, which gives an estimate for the CGT temperature (T*).
To validate the definition of conformational states, we evaluated the compactness of the polymer conformations. Therefore, we characterized the polymers’ ratio of radius of gyration over hydrodynamic radius, ρ = Rg / Rh, Figure S9. There, we can generally not only judge the conformational change with the temperature but also note that ρ spreads around 0.7 ± 0.05 for the collapsed conformations of all polymers in our set.
In Figure S12, we show the mean number of internal hydrogen bonds at different temperatures for the series of polymers. We observed consistent trends as for the state definition with other structural descriptors. Generally, hardly any internal hydrogen bonds exist in the C. These internal hydrogen bonds are formed when the polymer chains collapse, which is in line with the picture of the CGT outlined in earlier sections. The number of internal hydrogen bonds in the G state is higher for AAm than for the other polymers due to the primary amide function. This major difference between AAm and the other polymers influences basically all other analyses.
3.2. Hydration and Enthalpic Differences of Coils and Globules
Above, we visualize the hydrogen bonds between the polymers and water at different temperatures. We show the number of hydrogen bonds (ν) in Figure 4 and the number of hydrogen bonds per solvent accessible surface area (νσ) in Figure 5, respectively. At every temperature, we analyze the C and G subensembles separately. We note that the C exhibits consistently higher ν but a lower νσ than the G. This holds true for every polymer at all temperatures. We note that νσ is smaller for the TSPs in our set, namely, NIPAAm and NEAAm, than for the non-TSPs. As a trend, νσ increases with decreasing sidechain length. Furthermore, AAm generally exhibits higher ν than the other polymers in the set, hence also much higher νσ. This is due to the fact that the primary amine can form two hydrogen bonds (as already mentioned before). Except for AAm, ν is very similar within the set. In Figure S14, we show the naïve mean over the whole trajectories, without separation of the subensembles, which is generally less straightforward to interpret. This is due to the fact that the naïve mean represents a weighted average of C and G for which the weights change with temperature.
Figure 4.

Number of hydrogen bonds (ν) between polymers and water. We show data related to the respective polymers as follows: (a) AAm, (b) NMAAm, (c) NEAAm, and (d) NIPAAm. We calculated the mean and standard deviation of these quantities within the C (purple spheres) and the G (dark red diamonds), respectively, and performed a linear fit for these points. The opacity of the symbols represents the state predominantly existing at a given temperature. In addition, we plot small dots to make it easier to identify the position of the highly transparent points.
Figure 5.

Number of hydrogen bonds between polymers and water per solvent accessible surface area (νσ). We show data related to these respective polymers as follows: (a) AAm, (b) NMAAm, (c) NEAAm, and (d) NIPAAm. We calculate the mean and standard deviation of these quantities within the C (purple spheres) and the G (dark red diamonds), respectively, and perform a linear fit for these points. The opacity of the symbols represents the state predominantly existing at a given temperature. In addition, we plot small dots to make it easier to identify the position of the highly transparent points. Please note the different y-axis scale for AAm.
In Figure S15, we show the mean number of hydrogen bonds between water and nitrogen or oxygen of the polymers, respectively. There, we observe no significant difference between the number of hydrogen bonds at the nitrogen and oxygen of the polymer with respect to the comparison of the C and G. This observation holds true for almost all polymers at all temperatures, with AAm being the exception (see above).
To compare the enthalpic contributions with the CGT in accordance with eq 3, we plotted the enthalpy difference of the polymer ΔCGHPol against the enthalpy difference of the water–water interactions ΔCGHSol, Figure 6. There, we generally notice that the data scatters around the diagonal,
Figure 6.

Comparison of enthalpic contributions to the free energy of the CGT. ΔCGHPol is the difference in internal energy of the polymer; ΔCGHSol is the difference in internal energy of the water–water interactions. We show data related to the respective polymers as follows: (a) AAm, (b) NMAAm, (c) NEAAm, and (d) NIPAAm. In all panels, we plot the mean difference of these two quantities at different temperatures. The corresponding simulation temperature is color coded in accordance with the color bar. To facilitate the comparison of the magnitude of these two properties, we plot x = y as a dashed grey line.
x = y. From that, we conclude that the approximation ΔCGHSol ≈ ΔCGHPol is valid within a certain variance (eq 3). Thus, both these quantities are of very similar magnitude at all temperatures for all polymers. Taking a closer look, we note that the shorter the sidechain, the more the trendline is shifted in the positive direction (linear fit in green in the respective panels). Accordingly, as a trend, ΔCGHSol > ΔCGHPol for these polymers. Generally, since both ΔCGHPol and ΔCGHSol are negative, the G is favored at all temperatures for all polymers in respect to these quantities. Once more, both these quantities are lower for AAm in comparison to the other polymers because it can form an additional hydrogen bond per monomer unit (see above).
In Figure 7, we compare ΔCGHPol – Sol with the sum ΔCGHPol + ΔCGHSol. Here, we can see that
Figure 7.

Comparison of the enthalpic contributions to the free energy of the CGT. ΔCGHPol is the difference in internal energy of the polymer, ΔCGHSol is the difference in internal energy of the water–water interactions, and ΔCGHPol – Sol is the difference in internal energy of the polymer–water interactions. We show data related to the respective polymers as follows: (a) AAm, (b) NMAAm, (c) NEAAm, and (d) NIPAAm. In all panels, we plot the sum, ΔCGHPol + ΔCGHSol vs ΔCGHPol – Sol at different temperatures. The corresponding simulation temperature is color coded in accordance with the color bar. To facilitate the comparison of the magnitude of the two axes, we plot y = −x as a dashed grey line within the respective panels. Furthermore, we mark the area where x + y > 0 in grey. In this region, the total enthalpy of the transition (ΔCGHTot = ΔCGHSol + ΔCGHPol + ΔCGHPol – Sol) would be unfavorable. In addition, we plot a linear fit of the data with the function: y = −x + b in green.
ΔCGHPol – Sol > 0 for all polymers at all temperatures. Therefore, the enthalpy of the polymer–solvent interactions generally disfavors the CGT, which agrees with the expectation. In accordance with eq 4, we plot the linear function y = – x in a dashed grey line, as an orientation. In addition, we fit
the data of all polymers with the linear function y = – x + b. The resulting fits confirm that
ΔCGHPol + ΔCGHSol ≈ – ΔCGHPol – Sol is generally a valid approximation (eq 4). We note that the shorter the sidechain, the further is the trendline shifted in negative direction. We show the differences in ΔCGHTot in Figure S18. There, we can see that the mean ΔCGHTot shows a clear trend to be higher for longer sidechains. While on average ΔCGHTot > 0 for NIPAAm, for AAm, almost all values are below 0.
Furthermore, we compared ΔCGHPol and ΔCGHSol with −ΔCGHPol – Sol/2 in Figures S16 and S17, respectively. According to eq 4, these three quantities are expected to be approximately equal. In Figure S16, we can ascertain that as a trend ΔCGHSol and −ΔCGHPol – Sol/2 are indeed approximately equal for all polymers, whereas the shorter the sidechain, the systematically lower is ΔCGHPol in comparsion to −ΔCGHPol – Sol/2.
In Figure 8, we depict the mean lifetimes of hydrogen bonds between the polymers and water. We display the ratio of the lifetimes of hydrogen bonds between polymer and water (⟨τPol – Sol ⟩) over the lifetimes of hydrogen bonds in bulk water at the same temperature (⟨τSol – Sol ⟩). The lifetimes of the hydrogen bonds with oxygen and nitrogen are displayed in separate panels. Generally, ⟨τPol – Sol ⟩ is longer with increasing sidechain length. This trend is more prominent for hydrogen bonds involving the polymer’s oxygen atoms of the amide groups than for the hydrogen bonds at the nitrogen atoms. Nevertheless, the trend is also visible there. We note that at low temperatures, ⟨τPol – Sol ⟩ is significantly longer than ⟨τSol – Sol ⟩, for both nitrogen and oxygen. Moreover, the higher the temperature, the smaller is the ratio of ⟨τPol – Sol ⟩ and ⟨τSol – Sol ⟩. In Figure S19, we show the unscaled values of ⟨τPol – Sol ⟩, and as a reference, we show ⟨τSol – Sol ⟩ in bulk solvent in Figure S20.
Figure 8.

Mean lifetimes of hydrogen bonds between the solvent and amide group of the different polymers (⟨τPol – Sol ⟩) at different temperatures. Scaled by the mean lifetime of hydrogen bonds in bulk water at the same temperature (⟨τSol – Sol ⟩). In the upper panel, we show the lifetimes between the solvent and nitrogen atoms of the polymers, and in the lower panel, we show the lifetimes between the solvent and oxygen atoms of the polymers. In blue triangles, we show data points from simulations of AAm; in orange squares, NMAAm; in green diamonds, NEAAm; and in red crosses, NIPAAm. We show a logistic fit of the data in the respective color.
4. Discussion
4.1. Conformational States and Thermosensitivity
Our estimates of the CGT temperatures are in excellent qualitative agreement with experimental references, i.e., they reproduce the existence and ordering of CGT temperatures within the set of polymers. In experiments, the CGT temperatures of NIPAAm and NEAAm have been determined as approximately 3051,18,21 and 347 K,4,22 respectively. We estimate these CGT temperatures to be 272 and 281 K, respectively. Therefore, despite being qualitatively correct, the obtained transition temperatures are systematically lower than the experimentally obtained values. We believe that this shift originates from small inaccuracies of the force field and water model (see below). However, our estimate for the CGT temperature of NIPAAm is in perfect agreement with prior computational publications. Generally, this temperature has been estimated to lie within 270–280 K with this combination of the force field and water model.31,52 Hence, considering our superior sampling efforts combined with our improved temperature resolution, we are confident to estimate the CGT temperature with higher accuracy than before.
For the first time, a set of closely related polymers has been simulated for such a long simulation time, i.e., 2 μs, at different temperatures. Due to the high barrier between C and G, the expected timescales of the transition are generally long.31 In Figure S4, we show the timeseries of Rg, σ, and the resulting conformational state of NIPAAm at different temperatures. There, we can assess that, at 270 K, the first transition to a stable globule only occurs after almost 1 μs. The accuracy of MD-based predictions inherently relies on the extent of the captured conformational ensemble. Insufficient sampling may provide unphysical state populations, which inevitably result in erroneous predictions and unreliable observations. Therefore, simulations of only a few 100 ns may not be enough to determine the preferred conformational state at low temperatures. Nevertheless, we are aware that also 2 μs of simulation time will most likely not suffice to obtain convergence in all degrees of freedom. However, we do observe back and forth transitions between the conformational subensembles. This indicates, that we, in fact, sample close-to-equilibrium distributions and not only kinetically trapped conformations.
We further report that the previously published method for separating C and G in the Rg-σ plane is applicable to other polymers besides NIPAAm. Despite this method being increasingly challenging with less pronounced populated C states, we were able to define distinct state borders, leading to thoroughly consistent results in all aspects. As an additional verification, we evaluated the ratio of the mean Rg(coil) over Rg(globule), which agrees with the expected values and published size distributions for NIPAAm 30mers.68 Furthermore, having analyzed the ratio of Rg over Rh, i.e., ρ, we can consistently confirm the globularity of the structures at the respective temperatures. In summary, we are confident in the validity of the separation of the conformational subensembles. This method enabled us to systematically compare C and G at different temperatures.
4.2. Hydration and Enthalpic Differences of Coils and Globules
Based on the aforementioned state separation, we characterized the hydration of the C and G subensembles of the polymers at different temperatures. Therefore, we profiled the interaction of each polymer with the surrounding water molecules. We report that our results for ν are not only well in line, with similar computational studies on NIPAAm,69 but also qualitatively agree with experimental measurements of the hydration number of NIPAAm.70,71 Comparing ν and νσ, we notice that the comparison between C and G gives qualitatively consistent results for all polymers in our set at all temperatures, no matter whether thermosensitive or not. Generally, ν is higher in C than in G. This is due to the fact that the polymer forms internal hydrogen bonds with the structural collapse. In contrast, νσ is generally lower in C than in G. Thus, the general affinity to water of the surface changes. In addition, the volume of the solvation shell, therefore, the number of nonbulk waters, decreases with the conformational transition to the G. Furthermore, we find that νσ systematically decreases with increasing sidechain length. Generally, these results go in line, with the quantification of the enthalpic contributions of the CGT.
We were able to confirm our initial assumptions: On the one hand ΔCGHSol ≈ ΔCGHPol (eq 3) and on the other hand ΔCGHSol + ΔCGHPol ≈ – ΔCGHPol – Sol (eq 4). Since these equations are approximately true, we reason that the general picture of the release of water molecules from the solvation shell to bulk water, with polymer bonds forming is valid. Nevertheless, we noticed systematic deviations from these approximations. Comparing the values for ΔCGHtot of the different polymers, we find the following trend: With increasing sidechain length, on average the globule becomes less favored. Furthermore, according to our results, the G is not generally enthalpically favored. Additionally, the enthalpy of the CGT is dominated by ΔCGHPol – Sol, which is generally large in magnitude and positive thus unfavorable. As a trend, with decreasing size of the substituent ΔCGHSol is more positive than ΔCGHPol. Under the assumption that the number of binding sites, of both solvent and polymer molecules, is conserved, we infer that the potential energy per bond varies. Furthermore, we found that ΔCGHPol is systematically shifted in comparison to −ΔCGHPol – Sol/2. In contrast to that ΔCGHSol ≈ – ΔCGHPol – Sol/2, for all polymers. Therefore, we assume that solvent–solvent bonds and polymer–solvent bonds are approximately equivalent in potential energy for all polymers. However, the shorter the sidechain, the more favorable are polymer–polymer interactions in comparison to polymer–solvent interactions.
In summary, in terms of the potential energy, both polymer–polymer and solvent–solvent interactions favor the CGT. In contrast, the polymer–solvent interactions, which dominate the enthalpy, disfavor the CGT. Furthermore, the longer the sidechain, the weaker are the polymer–polymer interactions in comparison to the polymer–solvent interactions. Therefore, with increasing sidechain, the globule is in sum enthalpically less favorable. We assume electrostatic interactions to be of major importance for the potential energy. Therefore, deficiencies in the determination of the partial charges of the polymers may affect the energetic balance of the CGT. This may lead to shifted thermosensitive behavior, as already reported by the referenced studies.72,73 We furthermore believe, that the strength of the polymer–polymer and polymer–solvent bonds may be influenced by sterical hindrance, i.e., binding partners with high affinity may not get into close contact for geometrical reasons. This would not be contradicted by the known effect of the tacticity on the thermosensitivity.
Lastly, we evaluated the lifetime of hydrogen bonds between the polymers and solvent. Generally, ⟨τPol – Sol ⟩ is longer than ⟨τSol – Sol ⟩ for all polymers in our set at every temperature we simulated. With increasing temperature, the ratio of ⟨τPol – Sol ⟩ over ⟨τSol – Sol ⟩ decreases. Furthermore, we note that this ratio is systematically higher with longer sidechains. From significantly longer lifetimes of hydrogen bonds, we reason an increased immobility of water molecules at the surface of the polymers, which is consistent with recently published experimental results.74 We hypothesize that the trend of increasing ⟨τPol – Sol ⟩ with increasing sidechain is partly due to steric hindrance of water molecules, which intercalate between neighboring oxygen and nitrogen atoms. Therefore, we expect the sterical barrier for water molecules in the solvation shell to diffuse to the bulk to grow with the increasing size of the group at the nitrogen. Moreover, we hypothesize that large rearrangements in the solvation shell are necessary for the CGT to occur, which agrees with recent studies.53,75 Therefore, the deceleration of the water dynamics at low temperatures significantly increases transition times.
Furthermore, we believe that the immobilization of water molecules in the solvation shell translates into an entropic penalty in comparison to bulk water. Therefore, as it has been stated before in literature, we expect the thermosensitivity to originate from an entropic effect.76,77 With increasing temperature, the effect of this penalty on the free energy increases. Furthermore, the larger the solvation shell volume, the larger the impact of this penalty. This hypothesis is well in line with recently published experimental data74,76 and computational studies.78,79 Furthermore, this theory is not contradicted by the fact that the CGT temperature shifts in water–alcohol mixtures or in deuterated water.76,80,81 Accordingly, we expect the water model in simulations to be of great importance for the balance of the CGT.76 Hence, we surmise that the temperature shift for the CGT temperature may find its origin in the interplay between deficiencies of the water model and inaccuracies in the force field. According to our results, a purely enthalpic contemplation of the energetic balance of this transition cannot fully explain the thermosensitivity of the process.
5. Conclusions
The separation of the conformational ensembles at different temperatures enabled us to make some general statements about the hydration of C and G. Comparing the number of hydrogen bonds per solvent accessible surface area (νσ) for TSPs and non-TSPs, we can identify clear distinctions. We conclude that not only the affinity of the polymers’ surface to water but also the decrease in the solvation shell volume with the collapse of the chain play an important role in the stabilization of C. We want to emphasize that the differences in hydration between C and G can be identified at temperatures above and below the CGT temperature. Therefore, merely describing the hydration of the conformations, without making considerations about the effect on the free energy of the whole system (including solvent), may not lead to an exhaustive explanation of the thermosensitivity.
We want to emphasize that the non-TSPs in our set collapse at every simulated temperature, whereas the TSPs do not collapse below the transition temperature. Therefore, to explain the thermosensitivity, it is important to understand what stabilizes the C at lower temperatures, rather than what drives the collapse at higher temperatures. Furthermore, we report that it is not sufficient to simulate only a few hundred nanoseconds (or even less), especially at low temperatures, since the timescales of the transition are of a similar magnitude. Depending on the starting structure, the simulation results may be largely biased if the simulation time is too short.
According to our results, the G is not generally enthalpically favored. We found that with increasing size of the substituent at the nitrogen, the polymer–polymer interactions with forming the G become weaker in comparison to the polymer–water interactions. This leads to the G being enthalpically less favored with longer sidechains. Furthermore, we ascertained the lifetimes of the hydrogen bonds between polymer and water to be generally longer than in bulk water. In addition, we note that these lifetimes are systematically higher in TSPs than in non-TSPs. Therefore, we hypothesize that the higher affinity of water to the surface of C leads to an entropic penalty for the systems due to tightly bound waters. As a result, at higher temperatures, the C will not be stabilized by the surrounding solvent anymore.
In conclusion, we believe that the thermosensitive CGT can only be fully explained with a detailed consideration of the entropic contributions to the free energy of this transition. We believe that the entropy of the solvation is a crucial quantity for the free-energy balance of the CGT. We aim at quantifying this property in future publications.
Acknowledgments
The computational results presented have been achieved using the HPC infrastructure LEO of the University of Innsbruck and the Vienna Scientific Cluster (VSC). This work was supported by the Austrian Science Fund (FWF) via the grant P30737 “Protein Dynamics and Proteolytic Susceptibility” and via grant M2005 (postdoctoral fellowship to M.P.). Furthermore, this project has received funding from the European Union’s Horizon 2020 research and innovation program under grant agreement no. 764958.
Glossary
Abbreviations and Symbols
- C
coil
- G
globule
- CGT
coil–globule transition
- TSP
thermosensitive polymers
- AAm
polyacrylamide
- NMAAm
poly-N-methylacrylamide
- NEAAm
poly-N-ethylacrylamide
- NNIPAAm
poly-N-isopropylacrylamide
- Rg
radius of gyration
- Rh
hydrodynamic radius
- σ
solvent-accessible surface area
- ⟨τ⟩
mean lifetime of hydrogen bonds
- ν
mean number of hydrogen bonds with water
- νσ
mean number of hydrogen bonds with water per solvent accessible surface area
- ΔCGH
enthalpy difference with the CGT
- ΔCGHSol
enthalpy difference with the CGT originating from the solvent–solvent interactions
- ΔCGHPol
enthalpy difference with the CGT originating from the inner energy of the polymer
- ΔCGHPol – Sol
enthalpy difference with the CGT originating from the polymer–solvent interactions
Supporting Information Available
The Supporting Information is available free of charge at https://pubs.acs.org/doi/10.1021/acs.jpcb.0c07232.
Timeseries of radius of gyration, solvent-accessible surface area, and state; definition of conformational states; state assignation of all conformations; state borders and means in conformational states; ratio of radius of gyration and hydrodynamic radius; persistence length; internal hydrogen bonds; naïve mean of ν and νσ at different temperatures; mean number of hydrogen bonds of amid group with water; differences in enthalpy contributions; lifetimes of hydrogen bonds; and force field parameters (PDF)
Author Contributions
The manuscript was written through contributions of all authors. All authors have given approval to the final version of the manuscript.
The authors declare no competing financial interest.
Supplementary Material
References
- Heskins M.; Guillet J. E. Solution Properties of Poly(N-Isopropylacrylamide). J. Macromol. Sci., Part A - Chem. 1968, 2, 1441–1455. 10.1080/10601326808051910. [DOI] [Google Scholar]
- Kubota K.; Fujishige S.; Ando I. Solution Properties of Poly(N-Isopropylacrylamide) in Water. Polym. J. 1990, 22, 15–20. 10.1295/polymj.22.15. [DOI] [Google Scholar]
- Wei M.; Gao Y.; Li X.; Serpe M. J. Stimuli-Responsive Polymers and Their Applications. Polym. Chem. 2017, 8, 127–143. 10.1039/C6PY01585A. [DOI] [Google Scholar]
- Taylor L. D.; Cerankowski L. D. Preparation of Films Exhibiting a Balanced Temperature Dependence to Permeation by Aqueous Solutions—a Study of Lower Consolute Behavior. J. Polym. Sci. Polym. Chem. Ed. 1975, 13, 2551–2570. 10.1002/pol.1975.170131113. [DOI] [Google Scholar]
- Zhou Z.; Zhu S.; Zhang D. Grafting of Thermo-Responsive Polymer inside Mesoporous Silica with Large Pore Size Using ATRP and Investigation of Its Use in Drug Release. J. Mater. Chem. 2007, 17, 2428. 10.1039/b618834f. [DOI] [Google Scholar]
- Bromberg L. Temperature-Responsive Gels and Thermogelling Polymer Matrices for Protein and Peptide Delivery. Adv. Drug Delivery Rev. 1998, 31, 197–221. 10.1016/S0169-409X(97)00121-X. [DOI] [PubMed] [Google Scholar]
- Zarrintaj P.; Jouyandeh M.; Ganjali M. R.; Hadavand B. S.; Mozafari M.; Sheiko S. S.; Vatankhah-Varnoosfaderani M.; Gutiérrez T. J.; Saeb M. R. Thermo-Sensitive Polymers in Medicine: A Review. Eur. Polym. J. 2019, 117, 402–423. 10.1016/j.eurpolymj.2019.05.024. [DOI] [Google Scholar]
- Moghadam S.; Larson R. G. Assessing the Efficacy of Poly(N-Isopropylacrylamide) for Drug Delivery Applications Using Molecular Dynamics Simulations. Mol. Pharmaceutics 2017, 14, 478–491. 10.1021/acs.molpharmaceut.6b00942. [DOI] [PubMed] [Google Scholar]
- Salinas Y.; Castilla A. M.; Resmini M. An L-Proline Based Thermoresponsive and PH-Switchable Nanogel as a Drug Delivery Vehicle. Polym. Chem. 2018, 9, 2271–2280. 10.1039/C8PY00308D. [DOI] [Google Scholar]
- Lombardo S. M.; Schneider M.; Türeli A. E.; Günday Türeli N. Key for Crossing the BBB with Nanoparticles: The Rational Design. Beilstein J. Nanotechnol. 2020, 11, 866–883. 10.3762/bjnano.11.72. [DOI] [PMC free article] [PubMed] [Google Scholar]
- Zhang X.; Pint C. L.; Lee M. H.; Schubert B. E.; Jamshidi A.; Takei K.; Ko H.; Gillies A.; Bardhan R.; Urban J. J.; Wu M.; Fearing R.; Javey A. Optically- and Thermally-Responsive Programmable Materials Based on Carbon Nanotube-Hydrogel Polymer Composites. Nano Lett. 2011, 11, 3239–3244. 10.1021/nl201503e. [DOI] [PubMed] [Google Scholar]
- Shen S.; Ding B.; Zhang S.; Qi X.; Wang K.; Tian J.; Yan Y.; Ge Y.; Wu L. Near-Infrared Light-Responsive Nanoparticles with Thermosensitive Yolk-Shell Structure for Multimodal Imaging and Chemo-Photothermal Therapy of Tumor. Nanomed. Nanotechnol., Biol. Med. 2017, 13, 1607–1616. 10.1016/j.nano.2017.02.014. [DOI] [PubMed] [Google Scholar]
- Gandhi A.; Paul A.; Sen S. O.; Sen K. K. Studies on Thermoresponsive Polymers: Phase Behaviour, Drug Delivery and Biomedical Applications. Asian J. Pharm. Sci. 2015, 10, 99–107. 10.1016/j.ajps.2014.08.010. [DOI] [Google Scholar]
- Birshtein T. M.; Pryamitsyn V. A. Coil-Globule Type Transitions in Polymers. 2. Theory of Coil-Globule Transition in Linear Macromolecules. Macromolecules 1991, 24, 1554–1560. 10.1021/ma00007a017. [DOI] [Google Scholar]
- Okada Y.; Tanaka F. Cooperative Hydration, Chain Collapse, and Flat LCST Behavior in Aqueous Poly(N-Isopropylacrylamide) Solutions. Macromolecules 2005, 38, 4465–4471. 10.1021/ma0502497. [DOI] [Google Scholar]
- Taylor M.; Tomlins P.; Sahota T. Thermoresponsive Gels. Gels 2017, 3, 4. 10.3390/gels3010004. [DOI] [PMC free article] [PubMed] [Google Scholar]
- Wang X.; Qiu X.; Wu C. Comparison of the Coil-to-Globule and the Globule-to-Coil Transitions of a Single Poly(N-Isopropylacrylamide) Homopolymer Chain in Water. Macromolecules 1998, 31, 2972–2976. 10.1021/ma971873p. [DOI] [Google Scholar]
- Tiktopulo E. I.; Bychkova V. E.; Ricka J.; Ptitsyn O. B. Cooperativity of the Coil-Globule Transition in a Homopolymer: Microcalorimetric Study of Poly(N-Isopropylacrylamide). Macromolecules 1994, 27, 2879–2882. 10.1021/ma00088a031. [DOI] [Google Scholar]
- Tiktopulo E. I.; Uversky V. N.; Lushchik V. B.; Klenin S. I.; Bychkova V. E.; Ptitsyn O. B. “Domain” Coil-Globule Transition in Homopolymers. Macromolecules 1995, 28, 7519–7524. 10.1021/ma00126a032. [DOI] [Google Scholar]
- Baysal B. M.; Karasz F. E. Coil-Globule Collapse in Flexible Macromolecules. Macromol. Theory Simul. 2003, 12, 627–646. 10.1002/mats.200350028. [DOI] [Google Scholar]
- Meewes M.; Ricka J.; De Silva M.; Nyffenegger R.; Binkert T. Coil-Globule Transition of Poly(N-Isopropylacrylamide): A Study of Surfactant Effects by Light Scattering. Macromolecules 1991, 24, 5811–5816. 10.1021/ma00021a014. [DOI] [Google Scholar]
- Aseyev V.; Tenhu H.; Winnik F. M.. Non-Ionic Thermoresponsive Polymers in Water. In Self Organized Nanostructures of Amphiphilic Block Copolymers II; Müller A. H. E., Borisov O., Eds.; Springer Berlin Heidelberg: Berlin, Heidelberg, 2011, pp. 29–89. [Google Scholar]
- Dünweg B.; Kremer K. Molecular Dynamics Simulation of a Polymer Chain in Solution. J. Chem. Phys. 1993, 99, 6983–6997. 10.1063/1.465445. [DOI] [Google Scholar]
- Zhelavskyi O. S.; Kyrychenko A. Atomistic Molecular Dynamics Simulations of the LCST Conformational Transition in Poly(N-Vinylcaprolactam) in Water. J. Mol. Graphics Modell. 2019, 90, 51–58. 10.1016/j.jmgm.2019.04.004. [DOI] [PubMed] [Google Scholar]
- Kholodenko A. L.; Freed K. F. Coil-Globule Transition: Comparison of Field Theoretic and Conformational Space Formulations. J. Phys. A: Math. Gen. 1984, 17, 2703–2727. 10.1088/0305-4470/17/13/022. [DOI] [Google Scholar]
- Haran G. How, When and Why Proteins Collapse: The Relation to Folding. Curr. Opin. Struct. Biol. 2012, 22, 14–20. 10.1016/j.sbi.2011.10.005. [DOI] [PMC free article] [PubMed] [Google Scholar]
- Ye X.; Lu Y.; Shen L.; Ding Y.; Liu S.; Zhang G.; Wu C. How Many Stages in the Coil-to-Globule Transition of Linear Homopolymer Chains in a Dilute Solution?. Macromolecules 2007, 40, 4750–4752. 10.1021/ma070167d. [DOI] [Google Scholar]
- García E. J.; Hasse H. Studying Equilibria of Polymers in Solution by Direct Molecular Dynamics Simulations: Poly(N-Isopropylacrylamide) in Water as a Test Case. Eur. Phys. J. Spec. Top. 2019, 227, 1547–1558. 10.1140/epjst/e2018-800171-y. [DOI] [Google Scholar]
- Genheden S.; Ryde U. Will Molecular Dynamics Simulations of Proteins Ever Reach Equilibrium?. Phys. Chem. Chem. Phys. 2012, 14, 8662. 10.1039/c2cp23961b. [DOI] [PubMed] [Google Scholar]
- Sawle L.; Ghosh K. Convergence of Molecular Dynamics Simulation of Protein Native States: Feasibility vs Self-Consistency Dilemma. J. Chem. Theory Comput. 2016, 12, 861–869. 10.1021/acs.jctc.5b00999. [DOI] [PubMed] [Google Scholar]
- Podewitz M.; Wang Y.; Quoika P. K.; Loeffler J. R.; Schauperl M.; Liedl K. R. Coil–Globule Transition Thermodynamics of Poly(N-Isopropylacrylamide). J. Phys. Chem. B 2019, 123, 8838–8847. 10.1021/acs.jpcb.9b06125. [DOI] [PubMed] [Google Scholar]
- Inoue M.; Hayashi T.; Hikiri S.; Ikeguchi M.; Kinoshita M. Mechanism of Globule-to-Coil Transition of Poly(N-Isopropylacrylamide) in Water: Relevance to Cold Denaturation of a Protein. J. Mol. Liq. 2019, 292, 111374. 10.1016/j.molliq.2019.111374. [DOI] [Google Scholar]
- Shaw D. E.; Bowers K. J.; Chow E.; Eastwood M. P.; Ierardi D. J.; Klepeis J. L.; Kuskin J. S.; Larson R. H.; Lindorff-Larsen K.; Maragakis P.; et al. Millisecond-Scale Molecular Dynamics Simulations on Anton. In Proceedings of the Conference on High Performance Computing Networking, Storage and Analysis - SC ‘09; ACM Press: New York, New York, USA, 2009, p 1. [Google Scholar]
- Chiessi E.; Paradossi G. Influence of Tacticity on Hydrophobicity of Poly(N-Isopropylacrylamide): A Single Chain Molecular Dynamics Simulation Study. J. Phys. Chem. B 2016, 120, 3765–3776. 10.1021/acs.jpcb.6b01339. [DOI] [PubMed] [Google Scholar]
- Hsu H.-P.; Paul W.; Binder K. Estimation of Persistence Lengths of Semiflexible Polymers: Insight from Simulations. Polym. Sci. Ser. C 2013, 55, 39–59. 10.1134/S1811238213060027. [DOI] [Google Scholar]
- Kratky O.; Porod G. Diffuse Small-Angle Scattering of x-Rays in Colloid Systems. J. Colloid Sci. 1949, 4, 35–70. 10.1016/0095-8522(49)90032-X. [DOI] [PubMed] [Google Scholar]
- Kujawa P.; Aseyev V.; Tenhu H.; Winnik F. M. Temperature-Sensitive Properties of Poly(N-Isopropylacrylamide) Mesoglobules Formed in Dilute Aqueous Solutions Heated above Their Demixing Point. Macromolecules 2006, 39, 7686–7693. 10.1021/ma061604b. [DOI] [Google Scholar]
- de Oliveira T. E.; Mukherji D.; Kremer K.; Netz P. A. Effects of Stereochemistry and Copolymerization on the LCST of PNIPAm. J. Chem. Phys. 2017, 146, 034904 10.1063/1.4974165. [DOI] [PubMed] [Google Scholar]
- Asadujjaman A.; Espinosa de Oliveira T.; Mukherji D.; Bertin A. Polyacrylamide “Revisited”: UCST-Type Reversible Thermoresponsive Properties in Aqueous Alcoholic Solutions. Soft Matter 2018, 14, 1336–1343. 10.1039/C7SM02424J. [DOI] [PubMed] [Google Scholar]
- Moore M. A. Theory of the Polymer Coil-Globule Transition. J. Phys. A: Math. Gen. 1977, 10, 305–314. 10.1088/0305-4470/10/2/019. [DOI] [Google Scholar]
- Tucker A. K.; Stevens M. J. Study of the Polymer Length Dependence of the Single Chain Transition Temperature in Syndiotactic Poly(N-Isopropylacrylamide) Oligomers in Water. Macromolecules 2012, 45, 6697–6703. 10.1021/ma300729z. [DOI] [Google Scholar]
- Lesage A.; Dahirel V.; Victor J.-M.; Barbi M. Polymer Coil–Globule Phase Transition Is a Universal Folding Principle of Drosophila Epigenetic Domains. Epigenetics Chromatin 2019, 12, 28. 10.1186/s13072-019-0269-6. [DOI] [PMC free article] [PubMed] [Google Scholar]
- Walter J.; Ermatchkov V.; Vrabec J.; Hasse H. Molecular Dynamics and Experimental Study of Conformation Change of Poly(N-Isopropylacrylamide) Hydrogels in Water. Fluid Phase Equilib. 2010, 296, 164–172. 10.1016/j.fluid.2010.03.025. [DOI] [Google Scholar]
- Walter J.; Sehrt J.; Vrabec J.; Hasse H. Molecular Dynamics and Experimental Study of Conformation Change of Poly(N-Isopropylacrylamide) Hydrogels in Mixtures of Water and Methanol. J. Phys. Chem. B 2012, 116, 5251–5259. 10.1021/jp212357n. [DOI] [PubMed] [Google Scholar]
- Schrödinger Release 2018–1: Maestro; Schrödinger, LLC: New York, NY: 2018. [Google Scholar]
- Berendsen H. J. C.; Postma J. P. M.; van Gunsteren W. F.; Hermans J.. Interaction Models for Water in Relation to Protein Hydration; 1981; pp. 331–342. [Google Scholar]
- Berendsen H. J. C.; Grigera J. R.; Straatsma T. P. The Missing Term in Effective Pair Potentials. J. Phys. Chem. 1987, 91, 6269–6271. 10.1021/j100308a038. [DOI] [Google Scholar]
- Abraham M. J.; Murtola T.; Schulz R.; Páll S.; Smith J. C.; Hess B.; Lindahl E. GROMACS: High Performance Molecular Simulations through Multi-Level Parallelism from Laptops to Supercomputers. SoftwareX 2015, 1-2, 19–25. 10.1016/j.softx.2015.06.001. [DOI] [Google Scholar]
- Jorgensen W. L.; Maxwell D. S.; Tirado-Rives J. Development and Testing of the OPLS All-Atom Force Field on Conformational Energetics and Properties of Organic Liquids. J. Am. Chem. Soc. 1996, 118, 11225–11236. 10.1021/ja9621760. [DOI] [Google Scholar]
- Kaminski G. A.; Friesner R. A.; Tirado-Rives J.; Jorgensen W. L. Evaluation and Reparametrization of the OPLS-AA Force Field for Proteins via Comparison with Accurate Quantum Chemical Calculations on Peptides †. J. Phys. Chem. B 2001, 105, 6474–6487. 10.1021/jp003919d. [DOI] [Google Scholar]
- Rodríguez-Ropero F.; Hajari T.; van der Vegt N. F. A. Mechanism of Polymer Collapse in Miscible Good Solvents. J. Phys. Chem. B 2015, 119, 15780–15788. 10.1021/acs.jpcb.5b10684. [DOI] [PubMed] [Google Scholar]
- Boţan V.; Ustach V.; Faller R.; Leonhard K. Direct Phase Equilibrium Simulations of NIPAM Oligomers in Water. J. Phys. Chem. B 2016, 120, 3434–3440. 10.1021/acs.jpcb.6b00228. [DOI] [PubMed] [Google Scholar]
- Custodio K. K. S.; Claudio G. C.; Nellas R. B. Structural Dynamics of Neighboring Water Molecules of N-Isopropylacrylamide Pentamer. ACS Omega 2020, 5, 1408–1413. 10.1021/acsomega.9b02898. [DOI] [PMC free article] [PubMed] [Google Scholar]
- Parrinello M.; Rahman A. Polymorphic Transitions in Single Crystals: A New Molecular Dynamics Method. J. Appl. Phys. 1981, 52, 7182–7190. 10.1063/1.328693. [DOI] [Google Scholar]
- Nosé S.; Klein M. L. Constant Pressure Molecular Dynamics for Molecular Systems. Mol. Phys. 1983, 50, 1055–1076. 10.1080/00268978300102851. [DOI] [Google Scholar]
- Bussi G.; Donadio D.; Parrinello M. Canonical Sampling through Velocity Rescaling. J. Chem. Phys. 2007, 126, 014101 10.1063/1.2408420. [DOI] [PubMed] [Google Scholar]
- Miyamoto S.; Kollman P. A. Settle: An Analytical Version of the SHAKE and RATTLE Algorithm for Rigid Water Models. J. Comput. Chem. 1992, 13, 952–962. 10.1002/jcc.540130805. [DOI] [Google Scholar]
- Hess B.; Bekker H.; Berendsen H. J. C.; Fraaije J. G. E. M. LINCS: A Linear Constraint Solver for Molecular Simulations. J. Comput. Chem. 1997, 18, 1463–1472. . [DOI] [Google Scholar]
- Essmann U.; Perera L.; Berkowitz M. L.; Darden T.; Lee H.; Pedersen L. G. A Smooth Particle Mesh Ewald Method. J. Chem. Phys. 1995, 103, 8577–8593. 10.1063/1.470117. [DOI] [Google Scholar]
- Bondi A. Van Der Waals Volumes and Radii. J. Phys. Chem. 1964, 68, 441–451. 10.1021/j100785a001. [DOI] [Google Scholar]
- Eisenhaber F.; Lijnzaad P.; Argos P.; Sander C.; Scharf M. The Double Cubic Lattice Method: Efficient Approaches to Numerical Integration of Surface Area and Volume and to Dot Surface Contouring of Molecular Assemblies. J. Comput. Chem. 1995, 16, 273–284. 10.1002/jcc.540160303. [DOI] [Google Scholar]
- Ortega A.; Amorós D.; García de la Torre J. Prediction of Hydrodynamic and Other Solution Properties of Rigid Proteins from Atomic- and Residue-Level Models. Biophys. J. 2011, 101, 892–898. 10.1016/j.bpj.2011.06.046. [DOI] [PMC free article] [PubMed] [Google Scholar]
- Kok C.; Rudin A. Relationship between the Hydrodynamic Radius and the Radius of Gyration of a Polymer in Solution. Die Makromol. Chemie, Rapid Commun. 1981, 2, 655–659. 10.1002/marc.1981.030021102. [DOI] [Google Scholar]
- Kok C. M.; Rudin A. Prediction of Sedimentation Coefficients of Random Coil Polymers. J. Appl. Polym. Sci. 1982, 27, 3357–3368. 10.1002/app.1982.070270914. [DOI] [Google Scholar]
- Mukherji D.; Wagner M.; Watson M. D.; Winzen S.; de Oliveira T. E.; Marques C. M.; Kremer K. Relating Side Chain Organization of PNIPAm with Its Conformation in Aqueous Methanol. Soft Matter 2016, 12, 7995–8003. 10.1039/C6SM01789D. [DOI] [PubMed] [Google Scholar]
- Zhang G.; Wu C. Reentrant Coil-to-Globule-to-Coil Transition of a Single Linear Homopolymer Chain in a Water / Methanol Mixture. Phys. Rev. Lett. 2001, 86, 822–825. 10.1103/PhysRevLett.86.822. [DOI] [PubMed] [Google Scholar]
- van der Spoel D.; van Maaren P. J.; Larsson P.; Tîmneanu N. Thermodynamics of Hydrogen Bonding in Hydrophilic and Hydrophobic Media. J. Phys. Chem. B 2006, 110, 4393–4398. 10.1021/jp0572535. [DOI] [PubMed] [Google Scholar]
- Bejagam K. K.; An Y.; Singh S.; Deshmukh S. A. Machine-Learning Enabled New Insights into the Coil-to-Globule Transition of Thermosensitive Polymers Using a Coarse-Grained Model. J. Phys. Chem. Lett. 2018, 9, 6480–6488. 10.1021/acs.jpclett.8b02956. [DOI] [PubMed] [Google Scholar]
- Tavagnacco L.; Zaccarelli E.; Chiessi E. On the Molecular Origin of the Cooperative Coil-to-Globule Transition of Poly(N-Isopropylacrylamide) in Water. Phys. Chem. Chem. Phys. 2018, 20, 9997–10010. 10.1039/C8CP00537K. [DOI] [PMC free article] [PubMed] [Google Scholar]
- Shiraga K.; Naito H.; Suzuki T.; Kondo N.; Ogawa Y. Hydration and Hydrogen Bond Network of Water during the Coil-to-Globule Transition in Poly(N-Isopropylacrylamide) Aqueous Solution at Cloud Point Temperature. J. Phys. Chem. B 2015, 119, 5576–5587. 10.1021/acs.jpcb.5b01021. [DOI] [PubMed] [Google Scholar]
- Ono Y.; Shikata T. Hydration and Dynamic Behavior of Poly(N-Isopropylacrylamide)s in Aqueous Solution: A Sharp Phase Transition at the Lower Critical Solution Temperature. J. Am. Chem. Soc. 2006, 128, 10030–10031. 10.1021/ja063990i. [DOI] [PubMed] [Google Scholar]
- Du H.; Wickramasinghe R.; Qian X. Effects of Salt on the Lower Critical Solution Temperature of Poly (N-Isopropylacrylamide). J. Phys. Chem. B 2010, 114, 16594–16604. 10.1021/jp105652c. [DOI] [PubMed] [Google Scholar]
- Polák J.; Ondo D.; Heyda J. Thermodynamics of N-Isopropylacrylamide in Water: Insight from Experiments, Simulations, and Kirkwood–Buff Analysis Teamwork. J. Phys. Chem. B 2020, 124, 2495–2504. 10.1021/acs.jpcb.0c00413. [DOI] [PubMed] [Google Scholar]
- Chakraborty I.; Mukherjee K.; De P.; Bhattacharyya R. Monitoring Coil–Globule Transitions of Thermoresponsive Polymers by Using NMR Solvent Relaxation. J. Phys. Chem. B 2018, 122, 6094–6100. 10.1021/acs.jpcb.8b02179. [DOI] [PubMed] [Google Scholar]
- Ortiz de Solorzano I.; Bejagam K. K.; An Y.; Singh S. K.; Deshmukh S. A. Solvation Dynamics of N-Substituted Acrylamide Polymers and the Importance for Phase Transition Behavior. Soft Matter 2020, 16, 1582–1593. 10.1039/C9SM01798D. [DOI] [PubMed] [Google Scholar]
- Bischofberger I.; Calzolari D. C. E.; De Los Rios P.; Jelezarov I.; Trappe V. Hydrophobic Hydration of Poly-N-Isopropyl Acrylamide: A Matter of the Mean Energetic State of Water. Sci. Rep. 2015, 4, 4377. 10.1038/srep04377. [DOI] [PMC free article] [PubMed] [Google Scholar]
- Pica A.; Graziano G. An Alternative Explanation of the Cononsolvency of Poly(N-Isopropylacrylamide) in Water–Methanol Solutions. Phys. Chem. Chem. Phys. 2016, 18, 25601–25608. 10.1039/C6CP04753J. [DOI] [PubMed] [Google Scholar]
- Deshmukh S. A.; Sankaranarayanan S. K. R. S.; Suthar K.; Mancini D. C. Role of Solvation Dynamics and Local Ordering of Water in Inducing Conformational Transitions in Poly(N-Isopropylacrylamide) Oligomers through the LCST. J. Phys. Chem. B 2012, 116, 2651–2663. 10.1021/jp210788u. [DOI] [PubMed] [Google Scholar]
- Pérez-Ramírez H. A.; Haro-Pérez C.; Odriozola G. Effect of Temperature on the Cononsolvency of Poly(N-Isopropylacrylamide) (PNIPAM) in Aqueous 1-Propanol. ACS Appl. Polym. Mater. 2019, 1, 2961–2972. 10.1021/acsapm.9b00665. [DOI] [Google Scholar]
- Tavagnacco L.; Zaccarelli E.; Chiessi E. Molecular Description of the Coil-to-Globule Transition of Poly(N-Isopropylacrylamide) in Water/Ethanol Mixture at Low Alcohol Concentration. J. Mol. Liq. 2020, 297, 111928. 10.1016/j.molliq.2019.111928. [DOI] [Google Scholar]
- Wang X.; Wu C. Light-Scattering Study of Coil-to-Globule Transitaion of a Poly(N-Isopropylacrylamide) Chain in Deuterated Water. Macromolecules 1999, 32, 4299–4301. 10.1021/ma9902450. [DOI] [Google Scholar]
Associated Data
This section collects any data citations, data availability statements, or supplementary materials included in this article.