Abstract
Purpose
To examine the independent and incremental value of CT-derived quantitative burden and attenuation of COVID-19 pneumonia for the prediction of clinical deterioration or death.
Methods
This was a retrospective analysis of a prospective international registry of consecutive patients with laboratory-confirmed COVID-19 and chest CT imaging, admitted to four centers between January 10 and May 6, 2020. Total burden (expressed as a percentage) and mean attenuation of ground glass opacities (GGO) and consolidation were quantified from CT using semi-automated research software. The primary outcome was clinical deterioration (intensive care unit admission, invasive mechanical ventilation, or vasopressor therapy) or in-hospital death. Logistic regression was performed to assess the predictive value of clinical and CT parameters for the primary outcome.
Results
The final population comprised 120 patients (mean age 64 ± 16 years, 78 men), of whom 39 (32.5%) experienced clinical deterioration or death. In multivariable regression of clinical and CT parameters, consolidation burden (odds ratio [OR], 3.4; 95% confidence interval [CI]: 1.7, 6.9 per doubling; P = .001) and increasing GGO attenuation (OR, 3.2; 95% CI: 1.3, 8.3 per standard deviation, P = .02) were independent predictors of deterioration or death; as was C-reactive protein (OR, 2.1; 95% CI: 1.3, 3.4 per doubling; P = .004), history of heart failure (OR 1.3; 95% CI: 1.1, 1.6, P = .01), and chronic lung disease (OR, 1.3; 95% CI: 1.0, 1.6; P = .02). Quantitative CT measures added incremental predictive value beyond a model with only clinical parameters (area under the curve, 0.93 vs 0.82, P = .006). The optimal prognostic cutoffs for burden of COVID-19 pneumonia as determined by Youden’s index were consolidation of greater than or equal to 1.8% and GGO of greater than or equal to 13.5%.
Conclusions
Quantitative burden of consolidation or GGO on chest CT independently predict clinical deterioration or death in patients with COVID-19 pneumonia. CT-derived measures have incremental prognostic value over and above clinical parameters, and may be useful for risk stratifying patients with COVID-19.
Summary
Quantitative burden of consolidation or ground-glass opacities on chest CT predicts clinical deterioration or death in COVID-19 pneumonia.
Key Points
■ An increasing quantitative burden of consolidation or increasing attenuation of ground glass opacities on chest CT independently predict risk of clinical deterioration or death in COVID-19 pneumonia.
■ A burden of consolidation of greater than or equal to 1.8% or ground glass opacities of greater than or equal to 13.5% confers an approximately five-fold greater risk of adverse outcomes.
■ CT-derived quantitative lung measures have incremental prognostic value over and above other clinical parameters.
INTRODUCTION
Coronavirus disease 2019 (COVID-19), caused by severe acute respiratory syndrome coronavirus 2 (SARS-CoV-2), is an unprecedented global health crisis, with over 29.7 million confirmed cases worldwide as of September 17, 2020 (1). The most critical complication is acute respiratory failure requiring invasive mechanical ventilation, occurring in up to 17% of patients (2,3) which is associated with a high rate of in-hospital mortality (4,5). While the reverse transcription polymerase chain reaction (RT-PCR) assay is considered the reference standard for diagnosing COVID-19 infection (6), chest CT has greater sensitivity for early disease detection (7). This is particularly useful in patients in whom initial RT-PCR testing is negative and a high clinical suspicion remains (8). Furthermore, chest CT findings can indicate disease stage (9-11) and predict adverse outcomes (12,13) in COVID-19 pneumonia.
Characteristic CT abnormalities are bilateral patchy ground glass opacities (GGO) with or without consolidation in a peripheral, posterior, and diffuse or lower lung zone distribution (9-11). Increasing lung consolidation is typically observed later in the disease course (10,11) and is associated with critical illness (13,14). Studies have demonstrated that the extent of diseased lungs in COVID-19 pneumonia assessed by visual scoring correlates with clinical disease severity (15,16). Further, a reduction in well-aerated lung volume quantified using software has been shown to predict adverse outcomes (12). However, to the best of our knowledge, no international studies have examined the prognostic value of the quantitative burden of COVID-19 pneumonia by its lesion components. In this post-hoc analysis of a prospective, international, multicenter registry, we sought to examine the independent and incremental value of CT-derived quantitative burden and attenuation of diseased lung (GGO or consolidation) for the prediction of clinical deterioration or death in COVID-19 pneumonia.
MATERIALS AND METHODS
Study Design
This retrospective analysis was conducted with the approval of local institutional review boards (Cedars-Sinai Medical Center IRB# study 617) and written informed consent was waived for fully anonymized data analysis.
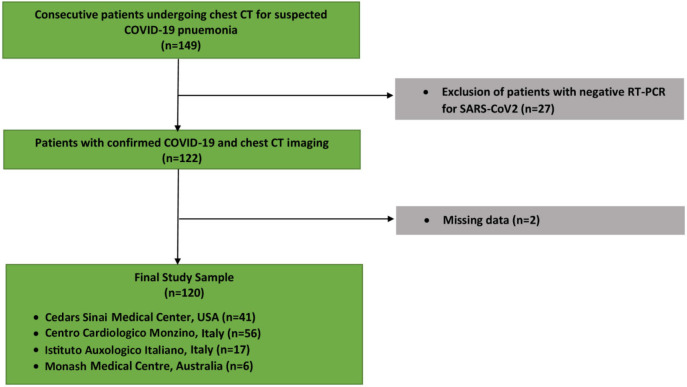
This prospective, international, multicenter registry included patients from: North America (Cedars Sinai Medical Center, Los Angeles, USA [n = 41]), Europe (Centro Cardiologico Monzino [n = 56], and Istituto Auxologico Italiano [n = 17 both Milan, Italy), and Australia (Monash Medical Centre, Victoria, Australia [n = 6]) enrolled consecutive patients who underwent chest CT and had a positive RT-PCR test result for SARS-CoV-2 during their index admission between January 10 and May 6, 2020 (Figure 1). For patients with serial chest CT imaging, we included only the results of their initial scan. A rapid (results in minutes to hours) RT-PCR test was not available at any of the four institutions during this period, and the two Italian centers had resource constraints necessitating urgent patient triage. Hence, the primary indication for initial chest CT in all centers was a high clinical suspicion for COVID-19 in the setting of a high pretest probability (a high community disease burden in Italy) or comorbidities associated with severe illness from COVID-19 (United States and Australian centers). The CT images from each patient and the clinical database were fully anonymized and transferred to Cedars-Sinai Medical Center for core lab analysis.
Figure 1:
Study flowchart of included patients.
Scan Protocol and Image Reconstruction
Chest CT scans were performed with different multi-slice CT systems: Aquilion ONE (Toshiba Medical Systems, Otawara, Japan); GE Revolution, GE Discovery CT750 HD, or LightSpeed VCT (GE Healthcare, Milwaukee, WI, USA); and Brilliance iCT (Philips Healthcare, Cleveland, OH, USA). Parameters used for scans without intravenous contrast included a peak x-ray tube voltage of 120 kV, automatic tube current modulation (300-500 mAs), and slice thickness of 0.625 to 1.25 mm. The protocol for contrast-enhanced included a peak x-ray tube voltage of 120 kV, automatic tube current modulation (500-650 mAs), and slice thickness of 0.625 to 1.0 mm. A total of 80–100 ml iodinated contrast material (Iomeron 400, Bracco Imaging SpA, Milan, Italy; or Ominpaque 350, GE Healthcare, United States) was injected intravenously at a rate of 5 ml/s and followed by 20-30ml of saline chaser at flow are of 4-5 ml/s. Images were reconstructed using standard lung filters specific to each CT vendor. All scans were obtained in the supine position during inspiratory breath-hold.
CT Image Analysis
Images were analyzed at the Cedars-Sinai Medical Center core laboratory by two physicians (K.G. and A.L.) with 3 and 8 years of experience in chest CT, respectively, and who were blinded to clinical data. A standard lung window (width of 1500 Hounsfield units [HU] and level of −400 HU) was used. Lung abnormalities were quantified using semi-automated research software (FusionQuant Lung v1.0, Cedars-Sinai Medical Center, Los Angeles, CA, USA). First, both lungs were segmented by a deep learning model based on U-Net architecture (17). The acquired pulmonary mask and a second deep learning model trained with the Lung Tissue Research Consortium dataset (18) were then used to compute lobe segmentations, with manual adjustments made by the reader as required. The right lung was divided into upper, middle, and lower lobes with respect to the horizontal and oblique fissures; while the left lung was separated into upper and lower lobes by the oblique fissure.
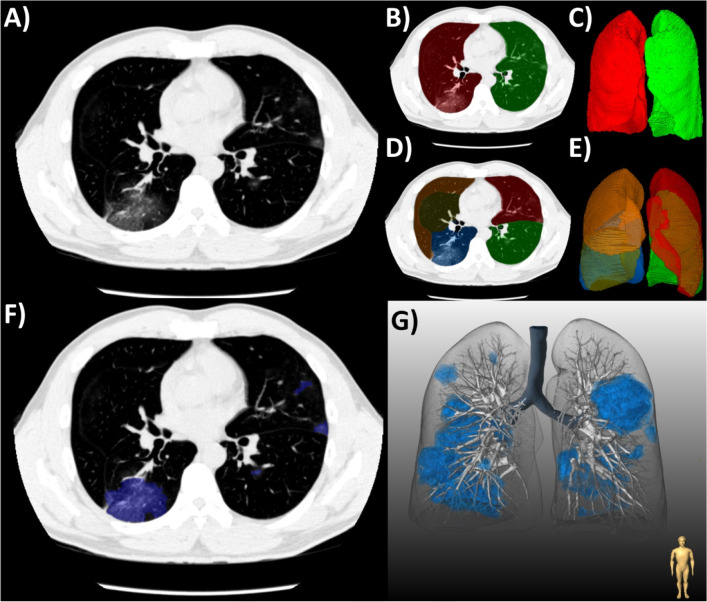
Lung abnormalities associated with COVID-19 pneumonia were then segmented using a semi-automated brush-like tool; the boundaries of which were delimited by a region-growing algorithm. Adaptive thresholds were used, defined by a fixed window around the attenuation of the pixel clicked by the operator. Lesion segmentations were labeled according to their components: GGO, consolidation, or pleural effusion using the Fleischner Society lexicon (19) (Figure 2). Chronic lung abnormalities, such as emphysema or fibrosis, were excluded from segmentation, based on correlation with previous imaging and/or a consensus reading. GGOs were defined as hazy opacities that did not obscure the underlying bronchial structures or pulmonary vessels; consolidation as opacification obscuring the underlying bronchial structures or pulmonary vessels; and pleural effusion as a fluid collection in the pleural cavity. Volumes of lesion components and their respective burdens ([total lesion volume/total lung volume] x 100%) were automatically calculated by the software. The attenuation of lesion components was defined as the mean attenuation in HU of the total lesion volume. The average time taken for full lung and lesion segmentation ranged from 10-20 minutes depending on patient anatomy and extent of pneumonia. The axial distribution of lung abnormalities was visually classified as: peripheral (predominantly outer one-third of the lung), central (predominantly inner two-thirds of the lung), or diffuse (no clear distribution pattern) (12). The presence of any breathing artifact was also noted. Each scan was reviewed slice-by-slice by the expert readers to ensure accurate segmentation of COVID-19 pneumonia and exclude false positive opacities. Difficult cases of visual or quantitative analysis were resolved by consensus.
Figure 2:
(a) Workflow for the quantification of COVID-19 pneumonia on chest CT in a patient with typical ground-glass opacities. (b-c) First, both lungs and (d-e) their respective lobes were automatically segmented by a deep-learning algorithm. Second, semi-automated segmentation of lesions was performed using (f) axial slices and shown with (g) three-dimensional rendering.
Outcomes and Definitions
The primary outcome was a composite of clinical deterioration (intensive care unit admission, invasive mechanical ventilation, or vasopressor therapy) or death. The time to first occurrence of any one of the components was documented. Chronic lung disease included asthma, chronic obstructive pulmonary disease, and/or obstructive sleep apnea. Chronic kidney disease was defined as estimated glomerular filtration rate of less than 60 ml/min/1.73m2. Immunodeficiency was defined as active cancer treated with chemotherapy or human immunodeficiency virus infection. Patient symptoms were self-reported upon hospital admission. Serum laboratory values were obtained at hospital admission.
Statistical Analysis
Data were tested for normality using the Shapiro–Wilk test. Continuous variables are expressed as mean ± standard deviation or median (interquartile range [IQR]), as appropriate. Categorical variables are presented as absolute numbers (percentage). Continuous variables were compared using the Student’s t-test or nonparametric Mann-Whitney U-test, as appropriate. Categorical variables were compared using a Chi-square test. Univariable logistic regression analysis was performed to evaluate the association of individual clinical factors and CT measures with the primary outcome. Based on these results and prognostic variables established by prior studies (3,20,21), the following clinical predictors were entered into backward stepwise multivariable logistic regression analysis: age, sex, diabetes mellitus, hypertension, smoking history, chronic lung disease, history of heart failure, history of coronary artery disease, chronic kidney disease, and serum C-reactive protein level (Model 1). To this, we added the following CT parameters based on univariable analysis and their clinical applicability: burden (%) and mean attenuation (HU) of GGO and consolidation (Model 2). Lesion burden and C-reactive protein were not normally distributed and hence normalized with logarithmic adjustment; base-2 log transformation was used as this represented doubling of the variable. The performance of the two models was assessed using receiver operating characteristic analysis, and the area under the curve values were compared using the DeLong test. We selected the optimal cutoff values for quantitative burden of GGO and consolidation by identifying the receiver operating characteristic values that maximized Youden’s J statistic (sensitivity + specificity - 1). A two-sided P-value < .05 was considered statistically significant. All analyses were performed using Stata 14.0 (StataCorp, College Station, TX, USA).
RESULTS
Patient Characteristics
The final study population comprised 120 patients (mean age 64 ± 16 years, 78 men) with laboratory-confirmed COVID-19 who underwent chest CT during their admission. The primary outcome occurred in 39 (32.5%) patients: 30 (25.0%) were admitted to an intensive care unit, 15 (12.5%) required mechanical ventilation, 17 (14.2%) received vasopressors, and 15 (12.5%) died. The median time from self-reported onset of symptoms to chest CT was 6 days (IQR, 4-8 days), and the median time from chest CT to the occurrence of the primary outcome was 3 days (IQR, 1-12 days). The remaining patients (n = 81; 67.5%) did not require critical care or had been discharged alive at the time of data collection.
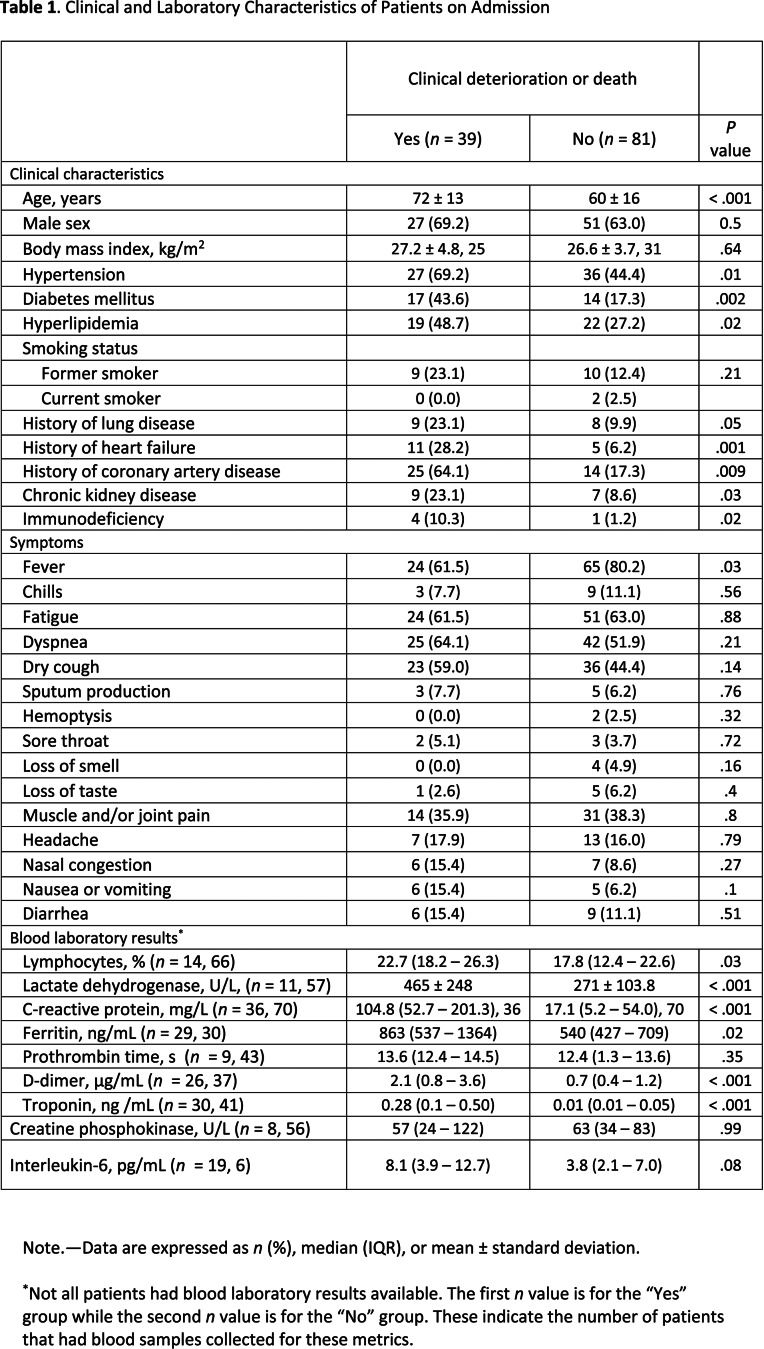
Patients who experienced deterioration or death were older and had a greater number of comorbidities compared to those who did not experience deterioration or death (72 ± 13 vs 60 ± 16 years, P < .001) (Table 1). Presenting symptoms were similar between the two groups. Serum inflammatory markers were increased in patients with versus those without the primary outcome (Table 1).
Table 1.
Clinical and Laboratory Characteristics of Patients on Admission
Chest CT Findings
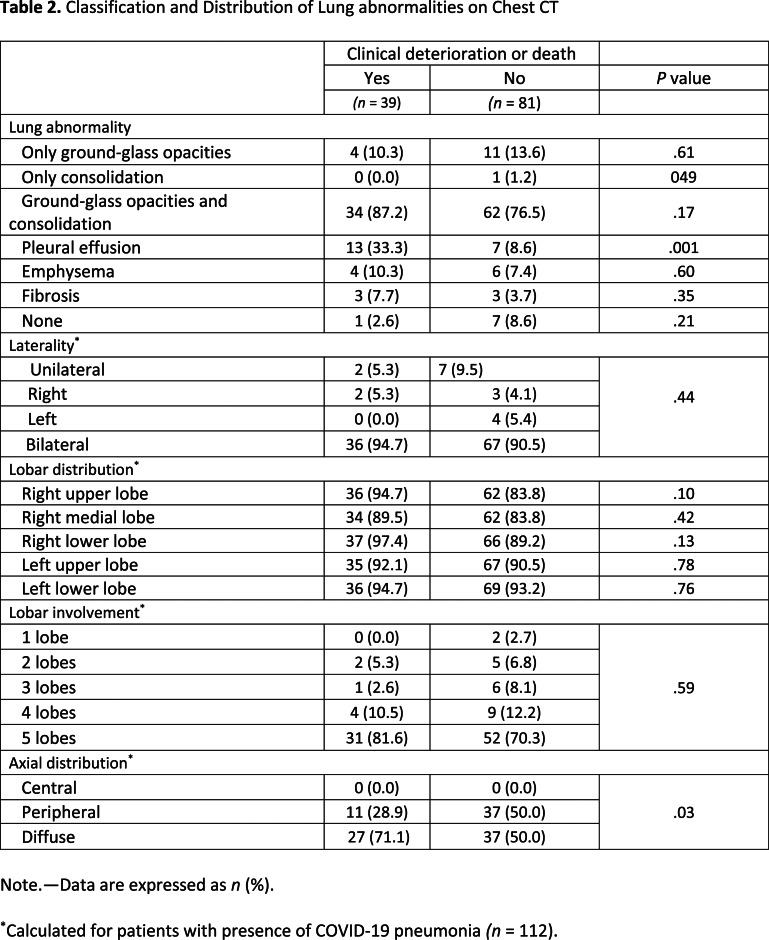
The median time from chest CT to positive RT-PCR testing was 0 (IQR, 0-3) days. A total of 93 (77.5%) patients underwent noncontrast chest CT, while the remaining 27 (22.5%) underwent CT angiography for exclusion of pulmonary embolism. Breathing artifacts were observed in 25 (20.8%) patients. The prevalence of lung abnormalities was comparable between the two groups, apart from pleural effusion being more common in patients with versus without deterioration or death (33.3% vs 8.6%, P = .001) (Table 2). The extent of COVID-19 pneumonia was predominantly bilateral and involving at least three lung lobes in both groups. Patients that underwent deterioration or death more frequently had a diffuse axial distribution of lung abnormalities (71.1% vs 50.0%, P = .03) compared to those without deterioration or death.
Table 2.
Classification and Distribution of Lung abnormalities on Chest CT
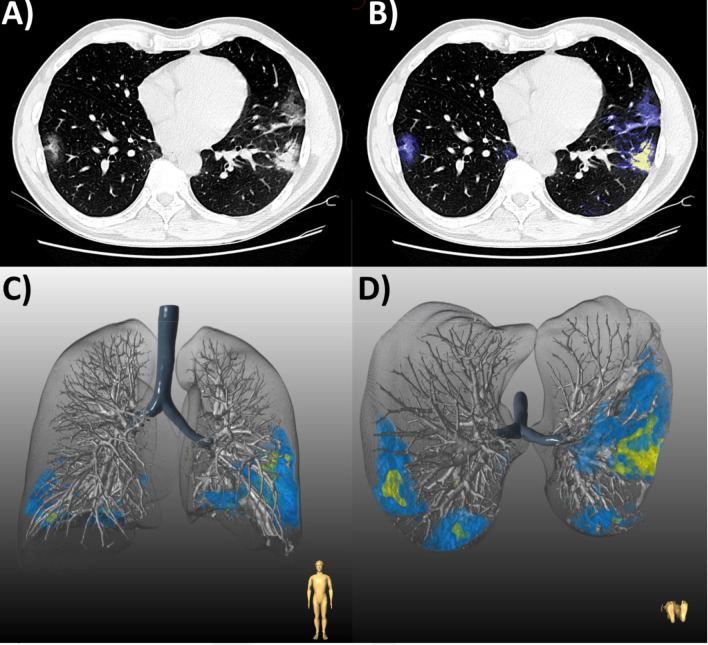
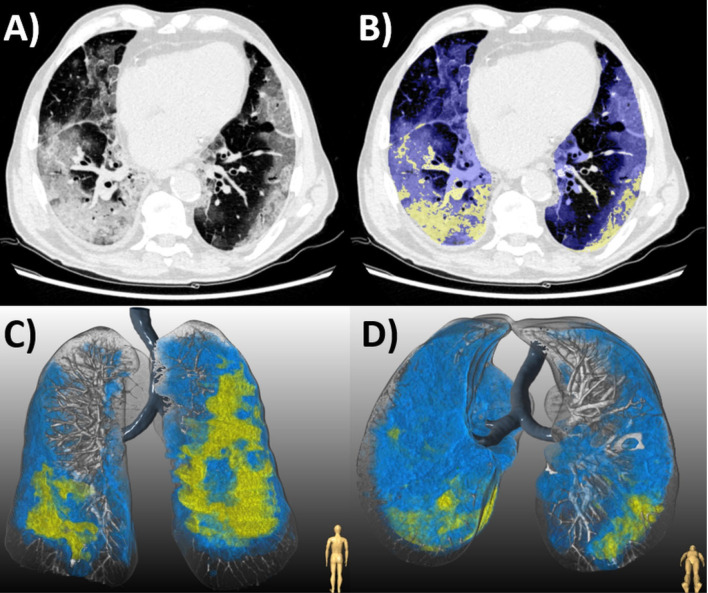
Quantitative lung features on CT are summarized in Table 3 and Figure 3. Patients with deterioration or death had a higher total burden of COVID-19 pneumonia compared to patients that did not experience deterioration or death (25.9% [IQR, 11.9–49.7%] vs 6.5% [IQR, 1.5–11.9%]; P < .001). With respect to lesion components, patients who deteriorated or died had a near three-fold greater GGO burden (14.2% [IQR, 4.3–35.6%] vs 5.8% [IQR, 1.1–11.0%]) and 15-fold greater consolidation burden (2.8% [IQR, 0.3–11.9%] vs 0.2% [IQR, 0.0–1.1%]; both P < .001) compared to patients who did not require critical care or were discharged alive. The mean attenuation of GGO was higher in patients that experienced deterioration or death than those that did not (-437.7 ± 120.2 HU vs -510.3 ± 126.9 HU, P = .004). Figures 4 and 5 show representative cases of CT findings in each of the outcome groups.
Table 3.
Quantitative Measures of Lung Lesions on Chest CT in COVID-19 Pneumonia.
Figure 3:
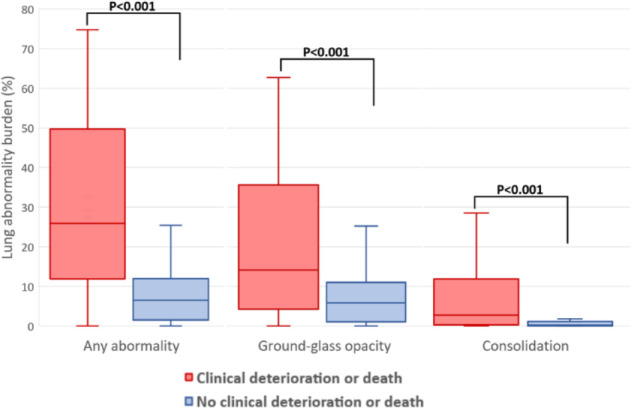
Burden of lung abnormalities on CT in patients with versus without clinical deterioration or death. Box plots demonstrate the median, interquartile range 25th-75th, and minimum and maximum values.
Figure 4.
(a) Chest CT of a 48-year-old man with COVID-19 pneumonia who was discharged following an uncomplicated 6-day hospital admission. (b) Axial slice demonstrates bilateral peripheral ground glass opacities (GGO, blue) with patchy consolidation (yellow). Lesion quantification revealed a GGO burden of 5.1% and consolidation burden of 0.7%. Three-dimensional lung renderings depict the distribution of disease in (c) coronal and (d) axial planes.
Figure 5.
(a) Chest CT of an 87-year-old man with COVID-19 pneumonia who died 10 days later. (b) Axial slice shows bilateral diffuse ground glass opacities (GGO, blue) and consolidation (yellow). Lesion quantification revealed a GGO burden of 44.0% and consolidation burden of 8.0%. Three-dimensional renderings depict the distribution of disease in (c) coronal and (d) axial planes.
Predictors of Clinical Deterioration or Death
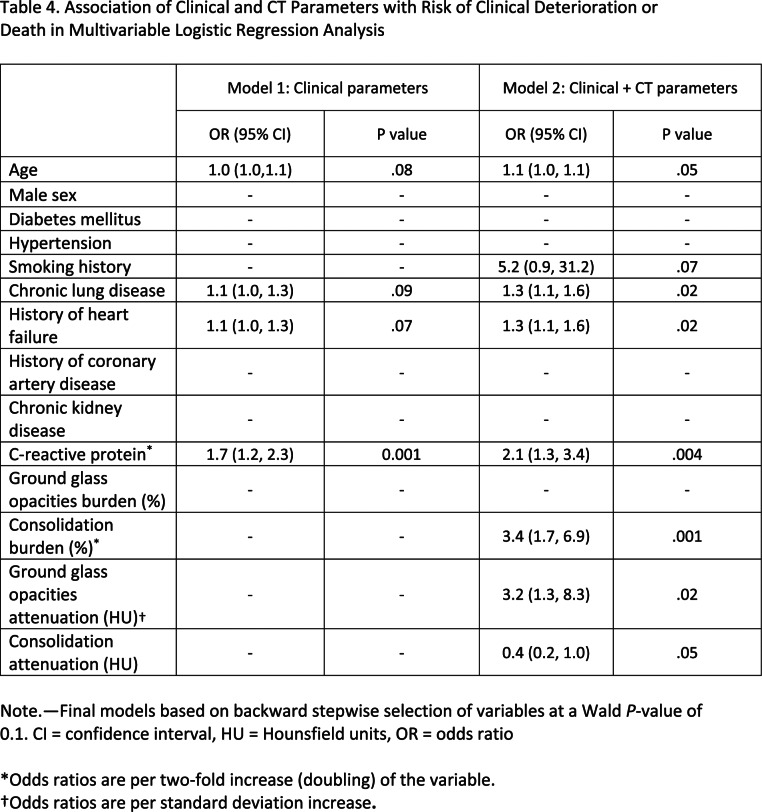
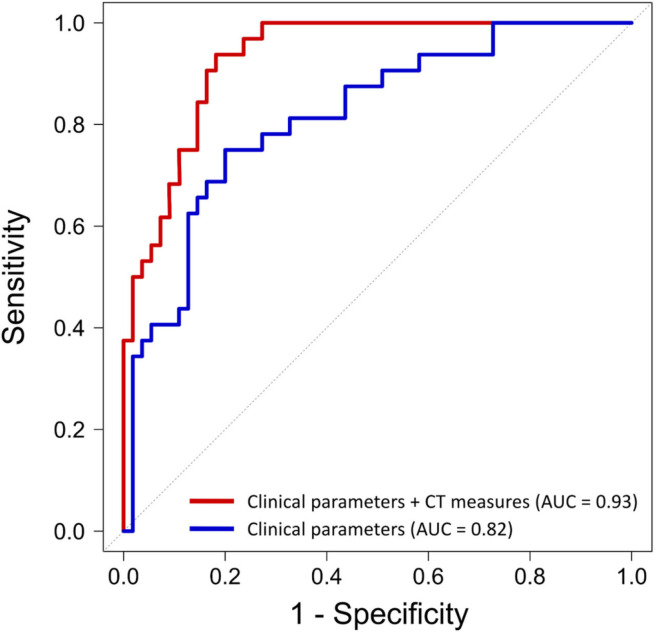
The results of the univariable logistic regression analysis are summarized in Table E1 (supplement). In multivariable analysis of clinical parameters, serum C-reactive protein was the only independent predictor of deterioration or death (OR, 2.1; 95% CI: 1.3, 3.4, P = .001; Table 4, Model 1). In multivariable analysis of clinical and quantitative CT parameters, burden of consolidation (OR, 3.4; 95% CI: 1.7, 6.9; P = .001) and attenuation of GGO (OR, 3.2; 95% CI: 1.3, 8.3 per one standard deviation increase; P = .02 were independent predictors of deterioration and death, as was C-reactive protein, history of heart failure, and chronic lung disease (Table 4, Model 2). Quantitative CT measures added incremental value in risk prediction over and above the model with clinical parameters (area under the curve 0.93 vs 0.82, P = .006; Figure 6). The optimal cutoff values for COVID-19 pneumonia burden as determined by Youden’s index were GGO of greater than or equal to 13.5% and consolidation of greater than or equal to 1.8%, above which there was a steep increase in the risk of deterioration and death with OR of 5.1 (95% CI: 1.5, 3.6; P = .008) and an OR of 4.8 (95% CI: 1.5, 10.2, P = .007) respectively, adjusted for clinical parameters.
Table 4.
Association of Clinical and CT Parameters with Risk of Clinical Deterioration or Death in Multivariable Logistic Regression Analysis
Figure 6.
Performance of clinical and CT parameters for the prediction of clinical deterioration or death. Quantitative CT measures added incremental predictive value beyond a model containing only clinical parameters (area under the curve, 0.93 vs 0.82, P = .006).
DISCUSSION
COVID-19 pneumonia is associated with substantial morbidity and mortality (1,2) and has overwhelmed healthcare systems worldwide (22,23). The daily number of new COVID-19 cases globally reached a record high on June 7 2020 (1) and there is also the looming threat of recurrent post-pandemic outbreaks (24). Early risk stratification would assist medical staff in triaging infected patients and allocating limited healthcare resources. In this international multicenter study of patients with COVID-19, we found (a) an increasing quantitative burden of consolidation or increasing attenuation of GGO on chest CT independently predicts risk of clinical deterioration or death; (b) burden of consolidation of greater than or equal to 1.8% or GGO of greater than or equal to 13.5% confers an approximately five-fold greater risk of adverse outcomes; (c) CT-derived quantitative lung measures have incremental prognostic value over and above clinical parameters.
The major histopathological finding in COVID-19 pneumonia is diffuse alveolar damage, characterized by inflammatory infiltrates and intra-alveolar edema and exudates(25,26). GGO on CT are thought to represent an early exudative phase of this disease, progressing to consolidation with intra-alveolar organization, fibroblastic proliferation, and alveolar collapse (25). Accordingly, chest CT within the first five days of symptom onset typically demonstrates a GGO-predominant pattern, followed by increasing consolidative changes for up to 14 days (9-11,27). Hence, consolidation represents the peak stage of COVID-19 pneumonia, and its presence corresponds to the phase of infection when patients are most critically ill (3). As demonstrated by the present analysis and prior investigators (13,14), consolidation is more common in patients who experience respiratory failure, intensive care unit admission, or death compared to those with an uncomplicated hospital course. Further, we showed an increasing burden of consolidation to independently predict adverse outcomes; the same association was not observed for burden of GGO. An increasing attenuation of GGO to less negative attenuation values in the lung parenchyma had prognostic importance; this likely reflects the underlying pathophysiology of progressive alveolar filling and loss of lung volume in the evolution of the pneumonia to consolidation.
Semi-quantitative scoring of the extent of COVID-19 pneumonia has been shown to associate with duration of infection (9-11) and clinical disease severity (15,16). However, these metrics are based on visual assessment and do not characterize specific lung abnormalities associated with COVID-19. More recently, Colombi et al (12) demonstrated that software-based quantification of well-aerated lung volume using HU thresholds can be used to predict the risk of intensive care unit admission or in-hospital mortality. In a Chinese multicenter study, Yu et al (13) quantified the lesion volume percentage in each lung lobe using a deep learning algorithm. They reported larger consolidation lesions, but not larger GGO lesions, to associate with increased risk of adverse outcomes. However, their lesion measurements did not exclude underlying lung abnormalities such as emphysema or fibrosis, and their prediction models were not adjusted for clinical variables. By contrast, the semi-automated method used in this analysis specifically quantified lung disease burden due to COVID-19 pneumonia, and we demonstrated the predictive value of consolidation burden to be independent of clinical risk factors. Ours was an international multicenter study, inclusive of institutions in two countries worst afflicted by COVID-19: the United States, with the most cases worldwide; and Italy, which was devastated by rapid contagion early in the global outbreak (1).
It is established that the presence and number of comorbidities predict clinical outcomes in patients with COVID-19 (20). Specifically, older age, chronic cardiac or pulmonary disease, hypertension, diabetes, and chronic kidney disease all confer an increased risk of in-hospital mortality (3,20,21). Elevated serum C-reactive protein levels on admission have also been shown to associate with a greater risk of worse clinical course (28,29). While chest CT is not routinely used as a first-line investigation to diagnose COVID-19, it has an auxiliary role to RT-PCR testing and can also aid in subsequent management of infected patients (30,31). A systematic review of 16 COVID-19 risk prediction models showed age and CT features to be the most frequently reported predictors of adverse in-hospital outcomes (20). However, few studies have combined clinical variables with chest CT for prognostication in COVID-19 pneumonia (12,32). Here, we demonstrate that a model integrating clinical parameters and CT-derived quantitative measures outperforms a model with clinical parameters alone in predicting clinical deterioration or death. Further, consolidation burden and GGO attenuation on CT were the strongest predictors of risk when adjusted for age, comorbidities, and C-reactive protein.
We determined optimal cutoffs for percentage of consolidation or GGO above which there was a steep increase in the risk of clinical deterioration or death. These thresholds have the potential to aid rapid risk stratification of patients with COVID-19 who undergo chest CT. Studies have shown good agreement between visual and software-based quantification of percentage lung involvement on CT in COVID-19 pneumonia (12,33). Further, excellent inter-rater agreement among radiologists for visually-estimated extent of consolidation or GGO has been demonstrated in studies of patients with chronic lung disease (34,35). These reported agreement values suggest that a burden of GGO of greater than or equal to 13.5% or consolidation of greater than or equal to 1.8% on CT could be reliably estimated by clinicians’ visual assessment in real time. Moreover, these CT parameters could be used as candidate predictors for new clinical risk prediction scores which are rapidly entering the literature(20). Combining such imaging features with clinical variables may in the future identify patients at high risk who would benefit from more aggressive treatment and closer monitoring. It should be noted that most patients in our study had a mixed pattern of COVID-19 pneumonia with both GGO and consolidation, and further studies are needed to determine prognostic cutoff values for burden of GGO and consolidation at different stages of COVID-19 pneumonia.
Our study has several limitations. Different patient profiles and treatment protocols between countries may have resulted in heterogeneity in COVID-19 pneumonia severity or in-hospital outcomes. Furthermore, chest CT indications and acquisition protocols were not standardized across centers. Data on patients’ respiratory status at the time of intensive care unit admission was not uniformly available, however, we included intubation and invasive ventilation as a hard endpoint. We did not evaluate follow-up CT findings since they were not available for all patients. The effect of treatment on outcomes was not examined; however, supportive care remains the mainstay of therapy in COVID-19 and few patients in our study received targeted interventions. Finally, serum levels of D-dimer, interleukin-6, lactate dehydrogenase, and troponin were not uniformly available and thus not included in our risk prediction models.
Quantitative burden of consolidation or ground glass opacities on chest CT independently predicts clinical deterioration or death in COVID-19 pneumonia. CT-derived quantitative lung measures have incremental prognostic value beyond clinical parameters, and may be useful for clinical risk stratification in patients with COVID-19.
Acknowledgments
Acknowledgments
Funded by COVID-19 supplementary funding, Cedars-Sinai Medical Center, and the National Heart, Lung and Blood Institute [1R01HL133616].
K.G. and A.L. contributed equally
Abbreviations:
- COVID-19
- coronavirus disease 2019
- GGO
- ground glass opacities
- RT-PCR
- reverse transcriptase polymerase chain reaction
- SARS-CoV-2
- severe acute respiratory syndrome coronavirus 2
REFERENCES
- 1.World Health Organization COVID-19 Situation Report - 139. Retreived 17 September 2020<https://www.who.int/emergencies/diseases/novel-coronavirus-2019/situation-reports.
- 2.Wu Z, McGoogan JM. Characteristics of and Important Lessons From the Coronavirus Disease 2019 (COVID-19) Outbreak in China: Summary of a Report of 72 314 Cases From the Chinese Center for Disease Control and Prevention. JAMA 2020;323:1239-1242. [DOI] [PubMed] [Google Scholar]
- 3.Zhou F, Yu T, Du R et al. Clinical course and risk factors for mortality of adult inpatients with COVID-19 in Wuhan, China: a retrospective cohort study. The Lancet 2020;395:1054-1062. [DOI] [PMC free article] [PubMed] [Google Scholar]
- 4.Grasselli G, Zangrillo A, Zanella A et al. Baseline Characteristics and Outcomes of 1591 Patients Infected With SARS-CoV-2 Admitted to ICUs of the Lombardy Region, Italy. JAMA 2020;323:1574-1581. [DOI] [PMC free article] [PubMed] [Google Scholar]
- 5.Richardson S, Hirsch JS, Narasimhan M et al. Presenting Characteristics, Comorbidities, and Outcomes Among 5700 Patients Hospitalized With COVID-19 in the New York City Area. JAMA 2020;323:2052-2059. [DOI] [PMC free article] [PubMed] [Google Scholar]
- 6.Corman VM, Landt O, Kaiser M et al. Detection of 2019 novel coronavirus (2019-nCoV) by real-time RT-PCR. Euro Surveill 2020;25:2000045. [DOI] [PMC free article] [PubMed] [Google Scholar]
- 7.Fang Y, Zhang H, Xie J et al. Sensitivity of Chest CT for COVID-19: Comparison to RT-PCR. Radiology 2020:200432. [DOI] [PMC free article] [PubMed] [Google Scholar]
- 8.Ai T, Yang Z, Hou H et al. Correlation of Chest CT and RT-PCR Testing in Coronavirus Disease 2019 (COVID-19) in China: A Report of 1014 Cases. Radiology 2020:200642. [DOI] [PMC free article] [PubMed] [Google Scholar]
- 9.Wang Y, Dong C, Hu Y et al. Temporal Changes of CT Findings in 90 Patients with COVID-19 Pneumonia: A Longitudinal Study. Radiology 2020:200843. [DOI] [PMC free article] [PubMed] [Google Scholar]
- 10.Pan F, Ye T, Sun P et al. Time Course of Lung Changes at Chest CT during Recovery from Coronavirus Disease 2019 (COVID-19). Radiology 2020;295:715-721. [DOI] [PMC free article] [PubMed] [Google Scholar]
- 11.Bernheim A, Mei X, Huang M et al. Chest CT Findings in Coronavirus Disease-19 (COVID-19): Relationship to Duration of Infection. Radiology 2020;295:200463. [DOI] [PMC free article] [PubMed] [Google Scholar]
- 12.Colombi D, Bodini FC, Petrini M et al. Well-aerated Lung on Admitting Chest CT to Predict Adverse Outcome in COVID-19 Pneumonia. Radiology 2020:201433. [DOI] [PMC free article] [PubMed] [Google Scholar]
- 13.Yu Q, Wang Y, Huang S et al. Multicenter cohort study demonstrates more consolidation in upper lungs on initial CT increases the risk of adverse clinical outcome in COVID-19 patients. Theranostics 2020;10:5641-5648. [DOI] [PMC free article] [PubMed] [Google Scholar]
- 14.Tabatabaei SMH, Talari H, Moghaddas F, Rajebi H. Computed Tomographic Features and Short-term Prognosis of Coronavirus Disease 2019 (COVID-19) Pneumonia: A Single-Center Study from Kashan, Iran. Radiol: Cardiothorac Imaging 2020;2:e200130. [DOI] [PMC free article] [PubMed] [Google Scholar]
- 15.Yang R, Li X, Liu H et al. Chest CT Severity Score: An Imaging Tool for Assessing Severe COVID-19. Radiol: Cardiothorac Imaging 2020;2:e200047 [DOI] [PMC free article] [PubMed] [Google Scholar]
- 16.Li K, Fang Y, Li W et al. CT image visual quantitative evaluation and clinical classification of coronavirus disease (COVID-19). European Radiology 2020. [DOI] [PMC free article] [PubMed] [Google Scholar]
- 17.Hofmanninger J, Prayer F, Pan J, Rohrich S, Prosch H, Langs G. Automatic lung segmentation in routine imaging is a data diversity problem, not a methodology problem, 2020. [DOI] [PMC free article] [PubMed] [Google Scholar]
- 18.Negahdar M, Beymer D. Lung tissue characterization for emphysema differential diagnosis using deep convolutional neural networks: SPIE, 2019. [Google Scholar]
- 19.Hansell DM, Bankier AA, MacMahon H, McLoud TC, Müller NL, Remy J. Fleischner Society: glossary of terms for thoracic imaging. Radiology 2008;246:697-722. [DOI] [PubMed] [Google Scholar]
- 20.Wynants L, Van Calster B, Collins GS et al. Prediction models for diagnosis and prognosis of covid-19: systematic review and critical appraisal. BMJ 2020;369:m1328. [DOI] [PMC free article] [PubMed] [Google Scholar]
- 21.Cummings MJ, Baldwin MR, Abrams D et al. Epidemiology, clinical course, and outcomes of critically ill adults with COVID-19 in New York City: a prospective cohort study. The Lancet 2020;395:1763-1770. [DOI] [PMC free article] [PubMed] [Google Scholar]
- 22.Ranney ML, Griffeth V, Jha AK. Critical Supply Shortages — The Need for Ventilators and Personal Protective Equipment during the Covid-19 Pandemic. New England Journal of Medicine 2020;382:e41. [DOI] [PubMed] [Google Scholar]
- 23.Rosenbaum L. Facing Covid-19 in Italy — Ethics, Logistics, and Therapeutics on the Epidemic’s Front Line. New England Journal of Medicine 2020;382:1873-1875. [DOI] [PubMed] [Google Scholar]
- 24.Kissler SM, Tedijanto C, Goldstein E, Grad YH, Lipsitch M. Projecting the transmission dynamics of SARS-CoV-2 through the postpandemic period. Science 2020;368:860-868. [DOI] [PMC free article] [PubMed] [Google Scholar]
- 25.Tian S, Xiong Y, Liu H et al. Pathological study of the 2019 novel coronavirus disease (COVID-19) through postmortem core biopsies. Modern Pathology 2020. [DOI] [PMC free article] [PubMed] [Google Scholar]
- 26.Schaller T, Hirschbühl K, Burkhardt K et al. Postmortem Examination of Patients With COVID-19. JAMA 2020. [DOI] [PMC free article] [PubMed] [Google Scholar]
- 27.Shi H, Han X, Jiang N et al. Radiological findings from 81 patients with COVID-19 pneumonia in Wuhan, China: a descriptive study. The Lancet Infectious Diseases 2020;20:425-434. [DOI] [PMC free article] [PubMed] [Google Scholar]
- 28.Wang G, Wu C, Zhang Q et al. C-Reactive Protein Level May Predict the Risk of COVID-19 Aggravation. Open Forum Infectious Diseases 2020;7. [DOI] [PMC free article] [PubMed] [Google Scholar]
- 29.Luo X, Zhou W, Yan X et al. Prognostic value of C-reactive protein in patients with COVID-19. medRxiv 2020:2020.03.21.20040360. [Google Scholar]
- 30.Simpson S, Kay FU, Abbara S et al. Radiological Society of North America Expert Consensus Statement on Reporting Chest CT Findings Related to COVID-19. Endorsed by the Society of Thoracic Radiology, the American College of Radiology, and RSNA. Radiol: Cardiothoracic Imaging 2020;2:e200152. [DOI] [PMC free article] [PubMed] [Google Scholar]
- 31.Li Y, Xia L. Coronavirus Disease 2019 (COVID-19): Role of Chest CT in Diagnosis and Management. American Journal of Roentgenology 2020;214:1280-1286. [DOI] [PubMed] [Google Scholar]
- 32.Guo L, Wei D, Zhang X et al. Clinical Features Predicting Mortality Risk in Patients With Viral Pneumonia: The MuLBSTA Score. Front Microbiol 2019;10:2752-2752. [DOI] [PMC free article] [PubMed] [Google Scholar]
- 33.Shen C, Yu N, Cai S et al. Quantitative computed tomography analysis for stratifying the severity of Coronavirus Disease 2019. Journal of Pharmaceutical Analysis 2020;10:123-129. [DOI] [PMC free article] [PubMed] [Google Scholar]
- 34.Kuriyama K, Seto M, Kasugai T et al. Ground-glass opacity on thin-section CT: value in differentiating subtypes of adenocarcinoma of the lung. AJR Am J Roentgenol 1999;173:465-9. [DOI] [PubMed] [Google Scholar]
- 35.Jacob J, Bartholmai BJ, Rajagopalan S et al. Automated Quantitative Computed Tomography Versus Visual Computed Tomography Scoring in Idiopathic Pulmonary Fibrosis: Validation Against Pulmonary Function. J Thorac Imaging 2016;31:304-11. [DOI] [PubMed] [Google Scholar]


