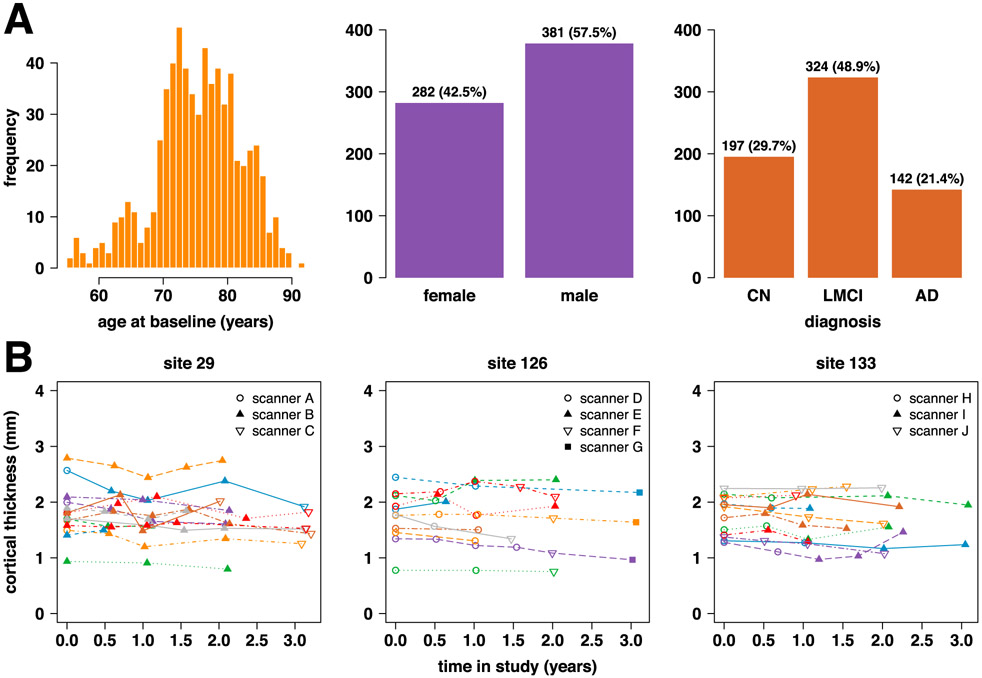
Fig. 1.
(A) Characteristics of n = 663 ADNI-1 participants. (B) Example trajectories for left superior frontal cortical thickness at 3 ADNI sites. Each line represents the trajectory for one participant at the given site, and each data point represents the cortical thickness in mm derived from the given scan using the ANTs Longitudinal-SST pipeline.

