Fig. 2.
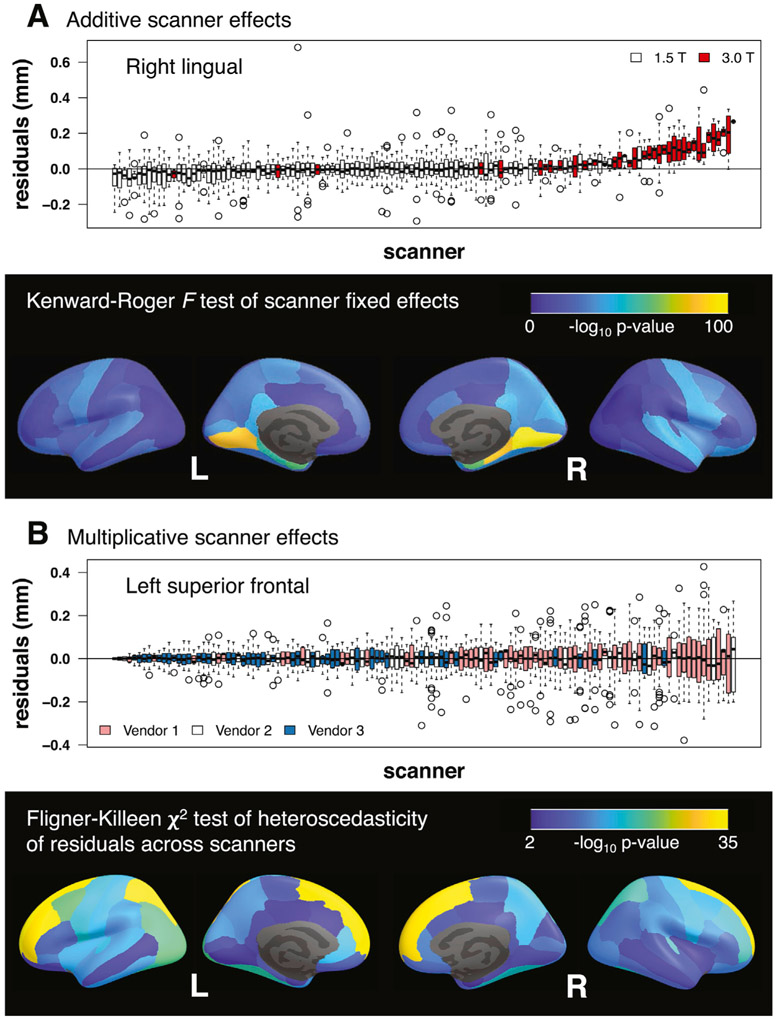
(A) Additive scanner effects. Boxplots show distributions of residuals across scanners after fitting a model with baseline age, sex, diagnosis, time, and diagnosis × time fixed effects and a subject-specific random intercept. Right lingual cortex was the region with the largest additive scanner effects according to the Kenward-Roger F-test; parahippocampal and entorhinal cortical regions also showed large effects. 3.0 T scanners tended to produce larger estimates of cortical thickness than 1.5 T scanners. (B) Multiplicative scanner effects. Boxplots show distributions of residuals across scanners after fitting a model with baseline age, sex, diagnosis, time, scanner, and diagnosis × time fixed effects and a subject-specific random intercept. Left superior frontal cortex was the region with the largest multiplicative scanner effects according to the Fligner-Killeen χ2-test. Vendor 1 scanners tended to have larger, while vendor 3 scanners had smaller, residual variability.

