The successful structure determination of a triclinic form of Dps from Escherichia coli using multi-crystal data-collection techniques is described.
Keywords: protein crystallography, muti-crystal data collection, clustering analysis
Abstract
Multi-crystal data collection using synchrotron radiation was successfully applied to determine the three-dimensional structure of a triclinic crystal form of Dps from Escherichia coli at 2.0 Å resolution. The final data set was obtained by combining 261 partial diffraction data sets measured from crystals with an average size of approximately 5 µm. The most important features of diffraction data measurement and processing for low-symmetry crystals are discussed.
1. Introduction
The main problem when using X-ray crystallography to determine the crystal structures of biological molecules is the need to grow crystals of adequate quality and size. On exposure to X-rays the crystal order breaks down owing to radiation damage (Garman & Weik, 2017 ▸), and when using a single sample the completeness of the diffraction information measured at the maximum resolution obtainable from the sample depends primarily on the size of the crystal (Bourenkov & Popov, 2010 ▸). In practice, for crystals smaller than 20–30 µm a complete data set is therefore often only obtained by combining partial data sets measured from several crystals, with the required number of partial sets required increasing as the available crystal size decreases.
Measuring data from weakly diffracting crystals of a few micrometres in their largest dimension is a difficult task, which has only become possible in recent years owing to progress in the two-dimensional detection of X-ray diffraction patterns, the availability of dedicated synchrotron-radiation sources combined with X-ray micro-collimation, and the constant improvement of diffractometers and data-processing methods (Mueller-Dieckmann et al., 2015 ▸; Förster & Schulze-Briese, 2019 ▸). One of the possible approaches for multi-crystal data collection (serial crystallography) is the Mesh&Collect pipeline developed at the ESRF (Zander et al., 2015 ▸). Here, microcrystals are presented to the beam on a cryocooled sample holder which is scanned through the X-ray beam. This produces a map of crystal positions, which is then used as a basis for the collection of partial data sets (usually 5–15° total rotation range), which are processed using standard programs such as XDS (Kabsch, 2010 ▸) or DIALS (Winter et al., 2018 ▸) and merged to produce a final complete data set for downstream structure solution and refinement. To achieve the best results, hierarchical cluster analysis (Santoni et al., 2017 ▸) or genetic algorithms (Zander et al., 2016 ▸) can be applied to select the most suitable subset of partial data sets for merging.
Methodology such as Mesh&Collect clearly expands the scope of macromolecular crystallography. However, to date, the exploitation of Mesh&Collect has been limited to a relatively small number of examples (Engilberge et al., 2019 ▸; Hutin et al., 2019 ▸), probably owing to its relative novelty and a lack of awareness in the general macromolecular crystallography community. To help to increase the use of Mesh&Collect as a routine tool for microcrystal-based macromolecular crystallography at synchrotron sources, we present the successful use of the pipeline to solve the crystal structure of the oligomeric nucleoid-associated protein Dps (DNA-binding protein from starved cells) from Escherichia coli. Despite the low symmetry of the crystals (space group P1) and their relatively large unit-cell parameters, the structure was solved to 2.0 Å resolution using a final data set compiled of 261 partial diffraction data sets measured from crystals with a largest dimension of between 3 and 7 µm.
2. Sample
2.1. Description of the Dps protein
The four-helix bundle oligomeric nucleoid-associated protein Dps (a bacterioferritin family protein) from E. coli was discovered in 1992 (Almirón et al., 1992 ▸). Dps adopts a spherical, dodecameric quaternary structure of ∼90 Å in diameter with a hollow core of ∼45 Å in diameter (Grant et al., 1998 ▸). Dps helps to protect cells from oxidative stress, sequestering potentially dangerous Fe2+ ions and providing an in cellulo process of nucleoid crystallization (Almirón et al., 1992 ▸). Dps is a secondary nucleoid component during the log phase; however, its concentration drastically increases by up to 300-fold until Dps become a prevailing nucleoid-associated protein (∼180 000 molecules per cell; Azam & Ishihama, 1999 ▸) during the stationary phase. A large amount of Dps protein is essential for the cell to provide nucleoid biocrystallization, a special stabilization process during which the nucleoid forms a compact and incredibly stable complex with Dps. Despite extensive research (Frenkiel-Krispin et al., 2001 ▸), the three-dimensional structure and process of formation of Dps dodecamer–DNA complexes has remained unclear. It is known that the N-terminal regions of Dps play an important role in binding processes (Haikarainen & Papageorgiou, 2010 ▸). However, the dynamics of the N-terminal regions of Dps during the formation of a bond between Dps dodecamers and DNA is unknown.
2.2. Expression of Dps
E. coli BL21-Gold (DE3) cells were transformed with a pET vector containing the Dps gene [UniProtKB P0ABT2 (DPS_ECOLI)] without tags. After transformation, one colony was inoculated from the plate into 200 ml LB medium containing 150 mg l−1 ampicillin. The bacterial culture was incubated overnight (16–18 h) at 30°C with shaking at 200–250 rev min−1. 3 l LB medium containing 150 mg l−1 ampicillin and 200 ml of the overnight culture was inoculated into a Brunswick BioFlo 110 bioreactor (Fisher Scientific, San Diego, California, USA). The culture was grown at 37°C with shaking to an OD600 of approximately 0.8. Induction of Dps expression was then performed by adding isopropyl β-d-1-thiogalactopyranoside to a concentration of 0.5 mM and the culture was incubated at 37°C for 4 h.
2.3. Purification of Dps
The harvested cells were centrifuged at 5000g for 15 min and the cell pellet was resuspended in 500 ml 10 mM Tris–HCl pH 6 and centrifuged at 5000g for 15 min. A mixture of protease inhibitors was added to the cell suspension to prevent the degradation of overexpressed Dps. The cells were lysed at 20.6 MPa using a French press (Thermo Electron, Waltham, Massachusetts, USA). The lysate was centrifuged at 15 000g for 30 min at 4°C and the precipitate was stored. The pellet was resuspended in 100 ml 20 mM Tris–HCl, 0.5 M NaCl pH 7.5 and dialyzed into 2 l 20 mM Tris–HCl, 100 mM NaCl pH 7.5. The solution was centrifuged at 15 000g for 30 min at 4°C and the supernatant was saved. The resulting solution was loaded onto a chromatographic column packed with 20 ml DEAE Sepharose FF sorbent (GE Healthcare, Marlborough, Massachusetts, USA) and equilibrated with 20 mM Tris–HCl, 100 mM NaCl pH 7.5. The flowthrough fractions of proteins that did not bind to the column were collected. These fractions contained the majority of the Dps protein free from bound DNA (Karas et al., 2013 ▸). The flow rate of the buffer was 2 ml min−1, and monitoring and collection of the fractions were carried out by measurement of the A 280 using an ÄKTA FPLC chromatography system (GE Healthcare).
2.4. Analysis of Dps
The presence of Dps in the collected fractions was determined by Laemmli SDS–PAGE. A Coomassie G-250-stained gel revealed only one band, with a molecular weight of approximately 19 kDa. The collected fractions were tested for DNA contamination by measuring OD260/OD280; this ratio is usually about 0.7. The purest Dps fractions were pooled. An Amicon ultrafiltration unit with a 10 000 molecular-weight cutoff was used to concentrate Dps and exchange the buffer to 50 mM Tris–HCl pH 8, 50 mM NaCl, 0.5 mM EDTA. The purified Dps was aliquoted and stored at 20°C.
2.5. Crystallization of Dps
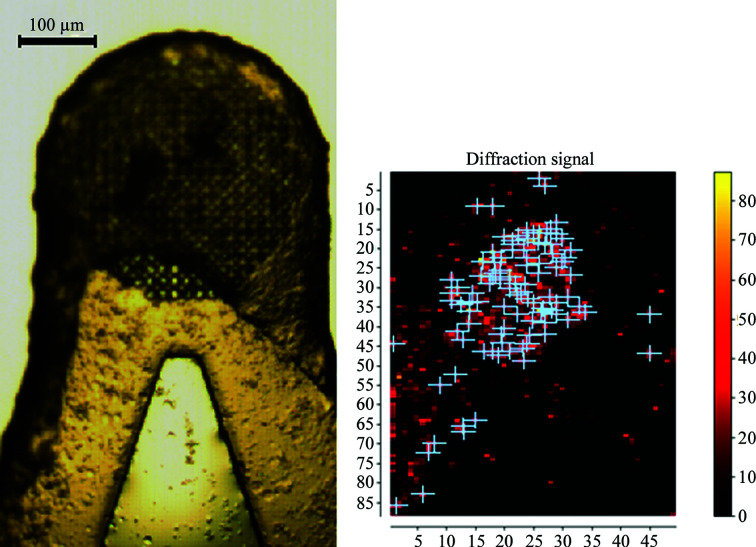
Although Dps interacts with DNA, it remains unclear how this interaction is mediated. It has nevertheless been postulated that as the structure of Dps does not contain the classic motifs for DNA binding, the Dps–DNA interaction is based on the formation of electrostatic bonds between the negatively charged DNA surface and the positively charged amino-acid residues localized at the N-terminus of the Dps monomers (Chiancone & Ceci, 2010 ▸). In the present work, we attempted to shed more light on this process by crystallizing a DNA–Dps complex. Here, a plasmid DNA (circular vector, pBluescript SK+/BamHI, Qiagen Plasmid Maxi Kit, 2958 bp) was purified using a previously described protocol (Marko et al., 1982 ▸) and crystallization hanging drops were prepared at 291 K by mixing concentrated Dps stock solution (3.1 mg ml−1) and DNA solution (1.04 mg ml−1) in a 6:1 mass ratio and then diluting the resulting solution with 1 M ammonium sulfate in a 1:1 volume ratio. The drops were incubated at 18°C for six months, resulting in the production of a dense layer of crystals of 3–7 µm in diameter (Fig. 1 ▸).
Figure 1.
View of the sample holder with the Dps crystals through an optical microscope (left) and the corresponding diffraction heatmap drawn by DOZOR (right).
3. Structure solution
3.1. Data collection
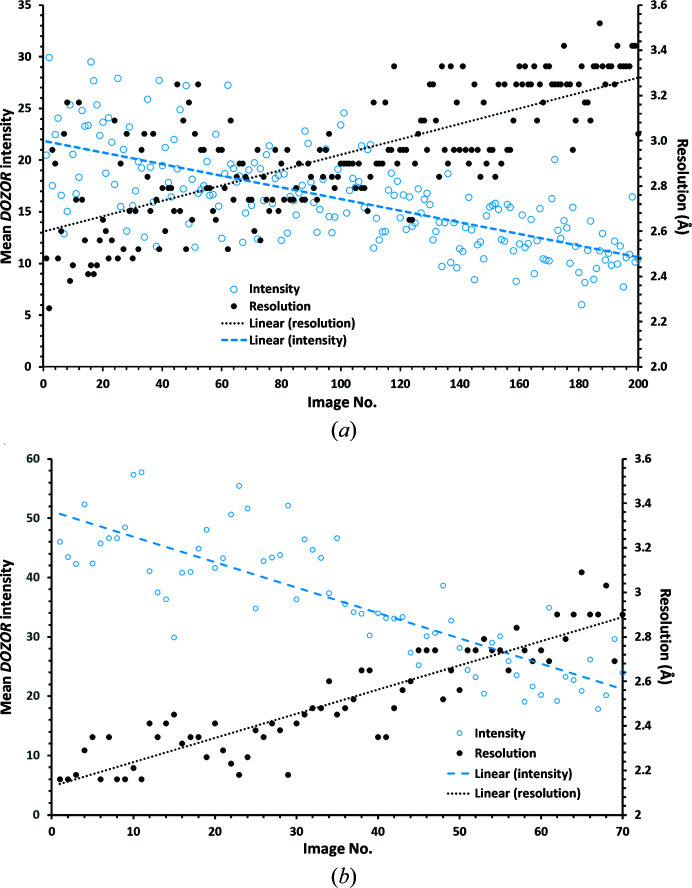
Initial diffraction measurements from crystals mounted directly from the crystallization drop were carried out 100 K with X-rays of wavelength 0.972 Å on ESRF beamline ID23-1 (Nurizzo et al., 2006 ▸) using a collimated X-ray beam of 10 µm in diameter and a PILATUS 6M detector, and allowed an initial estimate of the quality of the crystals obtained and the collection of a few partial data sets (see below). Optimized measurements using the modified Mesh&Collect pipeline MeshBest (Melnikov et al., 2018 ▸) were then carried out at a wavelength of 0.873 Å on ESRF beamline ID23-2 (Flot et al., 2010 ▸) using a focused X-ray beam with dimensions of 10 × 4 µm (horizontal × vertical) and a PILATUS3 X 2M hybrid pixel detector. Here, the sample holder containing the crystals was first rastered through the X-ray beam and, following the production of a MeshBest crystal map, partial data sets comprising between 7° and 20° of contiguous oscillation data in increments of 0.1° were collected with the detector positioned to provide a resolution limit d min of 2.0 Å (see Table 1 ▸). A total of 404 partial data sets, each with a total exposure time corresponding to an absorbed radiation dose per crystal of around 10 MGy (RADDOSE; Paithankar & Garman, 2010 ▸), were collected (29 on beamline ID23-1 and 375 on beamline ID23-2) from crystals mounted on six sample holders (Table 1 ▸). For each crystal, the optimum exposure time and total rotation range for data collection were estimated using the results of a rapid processing of successive diffraction patterns from individual crystals using DOZOR (Zander et al., 2015 ▸). Fig. 2 ▸ shows typical examples of the behavior of mean diffraction intensity and resolution versus image number for the partial data sets that were collected. As can be seen, the mean diffraction intensity does not reach half of its initial value, suggesting that the absorbed dose for each crystal does not exceed normally accepted values (Owen et al., 2006 ▸).
Table 1. Summary of Mesh&Collect data collection.
| Loop | 1 | 2 | 3 | 4 | 5 | 6 | Total |
|---|---|---|---|---|---|---|---|
| Beamline | ID23-2 | ID23-2 | ID23-1 | ID23-2 | ID23-2 | ID23-2 | |
| Flux (photons s−1) | 1.8 × 10¹¹ | 1.8 × 10¹¹ | 5.5 × 10¹¹ | 5.0 × 10¹¹ | 5.1 × 10¹¹ | 5.2 × 10¹¹ | |
| Oscillation per image (°) | 0.1 | 0.1 | 0.1 | 0.1 | 0.1 | 0.1 | |
| Exposure time (s) | 0.25 | 0.15 | 0.1 | 0.1 | 0.05 | 0.04 | |
| Dose per crystal (MGy) | 9.0 | 5.4 | 10.0 | 14.0 | 11.0 | 12.0 | |
| Total rotation range (°) | 7 | 7 | 10 | 10 | 15 | 20 | |
| Partial data sets collected | 93 | 100 | 29 | 35 | 79 | 68 | 404 |
| Partial data sets processed | 88 | 96 | 25 | 35 | 70 | 60 | 374 |
| Partial data sets included in final data set | 74 (80%) | 77 (77%) | 12 (41%) | 24 (69%) | 37 (46%) | 37 (54%) | 261 (65%) |
| Merging all partial data sets from loop | |||||||
| Completeness (%) | 64.1 | 66.8 | 50.6 | 70.6 | 92.0 | 85.9 | 98.6 |
| Multiplicity | 6.1 | 7.1 | 1.7 | 2.7 | 5.2 | 5.1 | 15.9 |
| 〈I/σ(I)〉 | 2.44 | 3.77 | 1.01 | 1.75 | 2.68 | 2.54 | 4.92 |
| Resolution at which 〈I/σ(I)〉 = 1 (Å) | 2.2 | 2.03 | 2.8 | 2.3 | 2.05 | 2.05 | 2.0 |
Figure 2.
Examples of the crystals from loop 6 (a) and loop 1 (b): mean diffraction intensity and resolution estimated by DOZOR versus image number.
3.2. Data processing
The processing of the partial data sets collected using the Mesh&Collect pipeline can sometimes be complicated by the fact that reflections can be weak for microcrystals and that indexing diffraction patterns based on a small wedge of data can produce artifacts. This is particularly true for low-symmetry crystals with unknown unit-cell parameters and space group. Here, automatic data processing (Kabsch, 2010 ▸) ran successfully for only 71 of the 404 partial data sets that were collected. However, this suggested six possible space groups for the various data sets analyzed, three of which have different unit-cell parameters (see Table 2 ▸). To try to definitively assign the unit cell and space group, all of the partial data sets were then reprocessed manually with XDS (Kabsch, 2010 ▸) using all nine of the possible variants found in the preliminary analysis. This analysis allowed the exclusion of the higher symmetry space groups (H3, H32, F23 and I222), where automatic indexing is most probably misled by the presence of ice on the sample and very sparse diffraction; the high symmetry of these space groups allows the quality of each partial data set to be assessed by comparing reflections with similar indices. For more than 60% of single-crystal data sets processed in each of the six variants of the four high-symmetry space groups, the CC1/2 value was around 10% at a resolution of around 4 Å. The three most plausible space groups were monoclinic C2 with unit-cell parameters a = 153.8, b = 92.5, c = 91.9 Å, β = 123.6°; monoclinic C2 with unit-cell parameters a = 147.7, b = 90.5, c = 156.4 Å, β = 109.7°; and triclinic P1 with unit-cell parameters a = 88.6, b = 90.2, c = 157.31 Å, α = 92.2, β = 105.0, γ = 117.9°. As the wedges were collected over small angular ranges, the unit-cell parameters were difficult to estimate; each variant of the space group with quite similar parameters was processed twice with different indexing. Processing in XDS using these five options was successful for close to 90% of the 404 partial data sets (374 for P1, 372 and 370 for C121). Subsequent analysis using othercell from the CCP4 suite (Winter et al., 2018 ▸) showed that the P1 cell could be an alternative indexing of the second variant of the C2 cell. The definitive assignment of unit-cell parameters and space group was then based on a comparison of the merging results, in the five possible unit cells, of the 24 strongest data sets collected from sample holder 5 (Table 1 ▸). As can be seen from Table 3 ▸, the correct choice of unit cell is clearly the lower symmetry P1 (a < b) variant, the unit cell of which has significantly different unit-cell dimensions and angles to those observed previously for the crystal structure of Dps from E. coli in a P1 unit cell (PDB entry 1jts; J. Luo, D. Liu, M. A. White & R. O. Fox, unpublished work).
Table 2. Space groups and the corresponding unit-cell parameters suggested by automatic data processing.
| Unit-cell parameters | |||||||
|---|---|---|---|---|---|---|---|
| Space group | a (Å) | b (Å) | c (Å) | α (°) | β (°) | γ (°) | Occurrence |
| P1 | 88.6 | 90.2 | 157.3 | 92.2 | 105.0 | 117.9 | 9 |
| C121 | 153.8 | 92.5 | 91.9 | 90.0 | 123.6 | 90.0 | 9 |
| C121 | 147.7 | 90.5 | 156.4 | 90.0 | 109.7 | 90.0 | 20 |
| H3 | 89.9 | 89.9 | 204.7 | 90.0 | 90.0 | 120.0 | 17 |
| H3 | 96.9 | 96.9 | 240.4 | 90.0 | 90.0 | 120.0 | 3 |
| H32 | 91.8 | 91.8 | 214.2 | 90.0 | 90.0 | 120.0 | 6 |
| H32 | 90.0 | 90.0 | 465.3 | 90.0 | 90.0 | 120.0 | 3 |
| F23 | 136.3 | 136.3 | 136.3 | 90.0 | 90.0 | 90.0 | 2 |
| I222 | 81.5 | 86.1 | 122.6 | 90.0 | 90.0 | 90.0 | 2 |
Table 3. Statistics for 24 partial data sets in variants of two space groups merged by XSCALE .
| Resolution (Å) | Completeness (%) | R factor (%) | 〈I/σ(I)〉 | CC1/2 (%) |
|---|---|---|---|---|
| P1: a = 88.6, b = 90.2, c = 157.3 Å, α = 92.2, β = 105.0, γ = 117.9° | ||||
| 8.00 | 79.5 | 15.1 | 7.01 | 97.7 |
| 4.00 | 87.5 | 28.1 | 5.92 | 88.5 |
| 2.05 | 88.7 | 197.5 | 0.77 | 18.9 |
| P1: a = 90.2, b = 88.6, c = 157.3 Å, α = 92.2, β = 105.0, γ = 117.9° | ||||
| 8.00 | 81.8 | 41.2 | 6.28 | 78.5 |
| 4.00 | 89.6 | 44.7 | 5.30 | 53.8 |
| 2.05 | 86.0 | 219.1 | 0.72 | 15.7 |
| C121: a = 153.8, b = 92.5, c = 91.9 Å, α = 90.0, β = 123.6, γ = 90.0° | ||||
| 8.00 | 92.5 | 80.6 | 1.98 | 22.5 |
| 4.00 | 97.2 | 84.3 | 1.79 | 22.5 |
| 2.90 | 97.8 | 127.6 | 1.00 | 2.7 |
| C121: a = 153.8, b = 91.9, c = 92.5 Å, α = 90.0, β = 123.6, γ = 90.0° | ||||
| 8.00 | 94.0 | 73.3 | 2.64 | 24.8 |
| 4.00 | 98.9 | 83.0 | 2.23 | 9.5 |
| 2.70 | 99.1 | 183.7 | 0.95 | 9.9 |
| C121: a = 149.014, b = 90.378, c = 157.750 Å, α = 90.0, β = 110.929, γ = 90.0° | ||||
| 8.00 | 95.1 | 81.3 | 2.23 | 38.4 |
| 4.00 | 98.4 | 77.5 | 2.38 | 27.9 |
| 2.70 | 98.6 | 132.2 | 1.11 | 16.5 |
3.3. Data merging
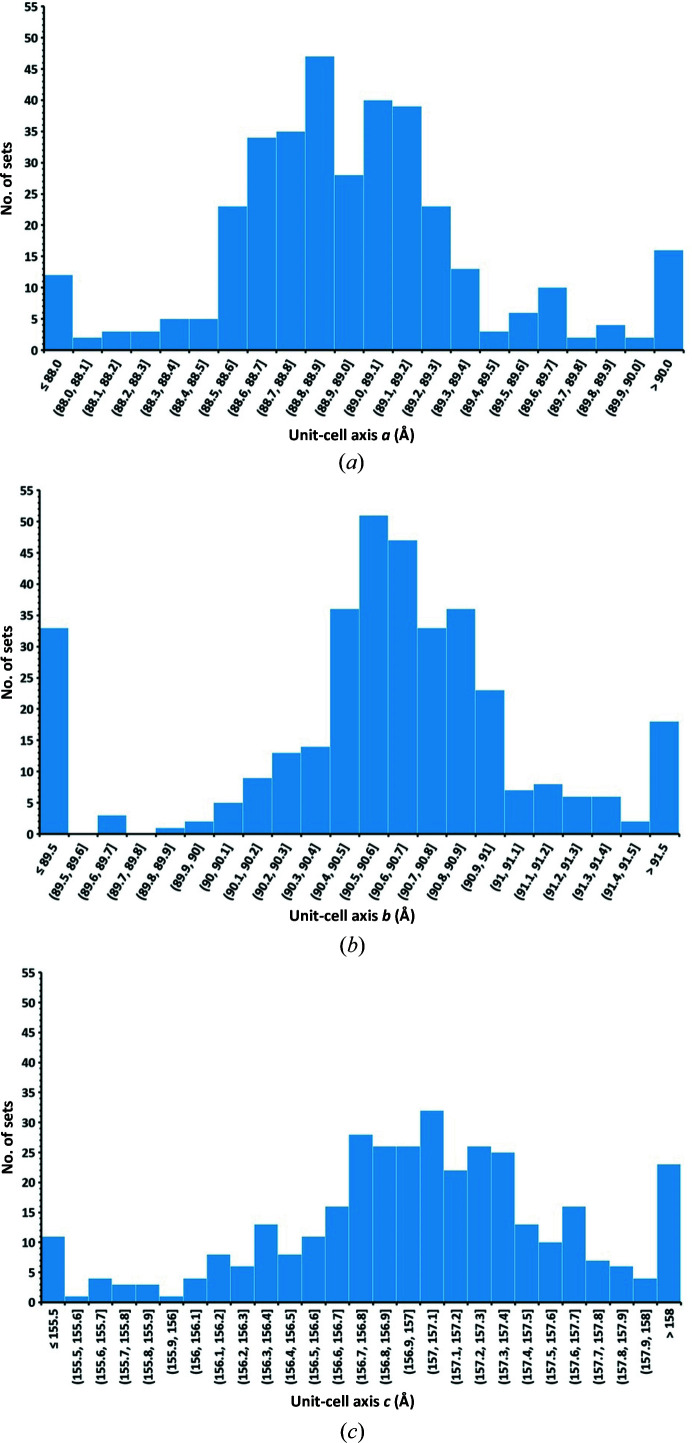
The next challenge that we faced was to choose which of the 404 partial data sets should best be merged to produce the final data set for structure solution and refinement. We used a hierarchical custer analysis (HCA) (Giordano et al., 2012 ▸) as implemented in the program ccCluster (Santoni et al., 2017 ▸) as a method of grouping the best set of partial data sets. This is particularly difficult for low-symmetry crystals as the distance definitions required for HCA are not precise. Comparing unit-cell parameters requires a precise determination of the three lattice parameters, which can be affected by indexing errors when working with a small rotation wedge. Partial data sets have low completeness and, for data collected from crystals in random orientations, the low number of common reflections in different partial data sets makes it difficult to assess (non-)isomorphism. We tried both methods, but while the comparison of intensities allowed the structure of the protein to be solved, as presented below, clustering based on the unit cell only allowed the removal of clear outliers but did not allow an exploitable data set to be obtained. The spread of unit-cell parameters shown in Fig. 3 ▸ gives an idea of the differences between the collected data sets.
Figure 3.
Linear lattice-parameter distribution for all 374 single-crystal data sets processed in the final space group P1. a mean = 89.0 ± 0.9 Å, b mean = 90.6 ± 1.1 Å, c mean= 157.1 ± 1.5 Å.
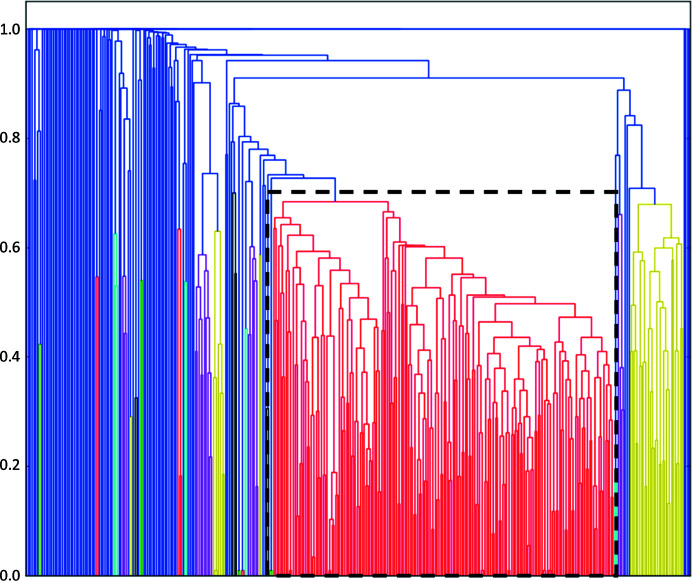
The results of the intensity-based analysis are shown in Fig. 4 ▸, with ccCluster suggesting the merging of a cluster containing 255 data sets. As discussed above, some partial data sets have no, or very few, common reflections with other partial data sets and were thus impossible to compare using HCA methods. Once a convincing cluster solution was found, we manually added some of these data sets back into it. In this way, after manual analysis, we managed to find a group of six more partial data sets for inclusion in the final data set (see Table 4 ▸ for the final statistics). The final merging of 261 partial data sets was performed by XSCALE (Kabsch, 2010 ▸).
Figure 4.
The dendrogram based on 374 single-crystal sets, colored according to the chosen clustering threshold of 0.65. The red cluster used to solve the structure is enclosed by the dashed rectangle. It contains 255 partial data sets collected with different oscillation ranges.
Table 4. Data and refinement statistics for the final structure of Dps.
Values in parentheses are for the highest resolution shell.
| Space group | P1 |
| a, b, c (Å) | 88.58, 90.17, 157.31 |
| α, β, γ (°) | 92.18, 104.99, 117.85 |
| Final compiled data set | |
| Resolution range (Å) | 50.0–2.0 (2.2–2.0) |
| Total No. of reflections | 5664896 |
| No. of unique reflections | 272262 |
| Completeness (%) | 98.6 |
| Multiplicity | 20.8 (19.1) |
| Half-set correlation CC1/2 | 93.8 (39.0) |
| 〈I/σ(I)〉 | 4.9 (1.7) |
| B factor, Wilson plot (Å2) | 14.5 |
| R p.i.m. | 0.184 (0.867) |
| Structure refinement | |
| No. of reflections, working set | 259017 (19152) |
| No. of reflections, test set | 13287 (925) |
| Final R factor | 0.210 |
| Final R free | 0.259 |
| No. of atoms (protein) | 29558 |
| No. of water molecules | 3555 |
| No. of sulfate ions | 50 |
| 〈B〉 from atomic model (Å2) | |
| Overall | 19.0 |
| Protein | 18.4 |
| Ions | 38.3 |
| Waters | 26.5 |
| R.m.s.d., bond lengths (Å) | 0.009 |
| R.m.s.d., angles (°) | 1.58 |
| Ramachandran plot analysis | |
| Most favored regions (%) | 98.5 |
| Allowed regions (%) | 1.5 |
3.4. Structure solution and refinement
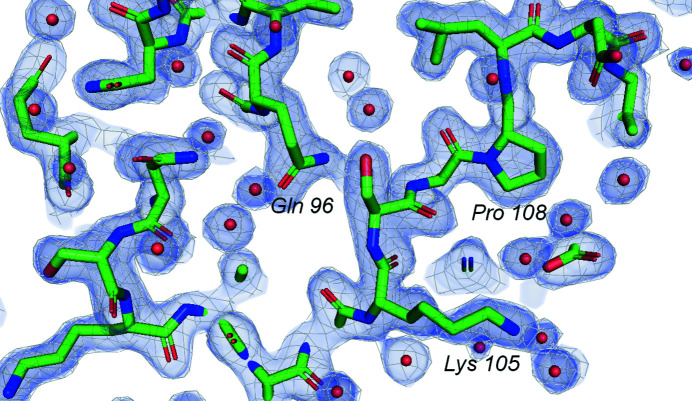
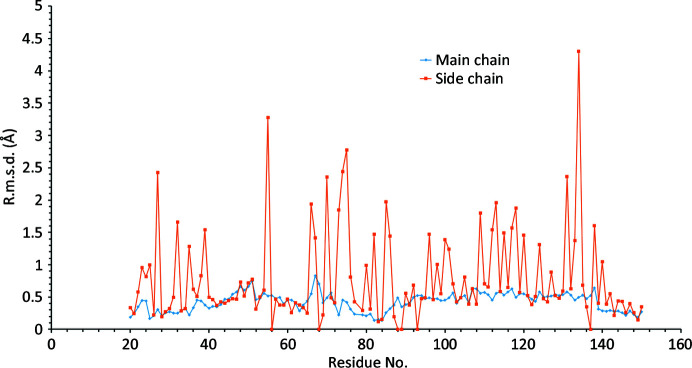
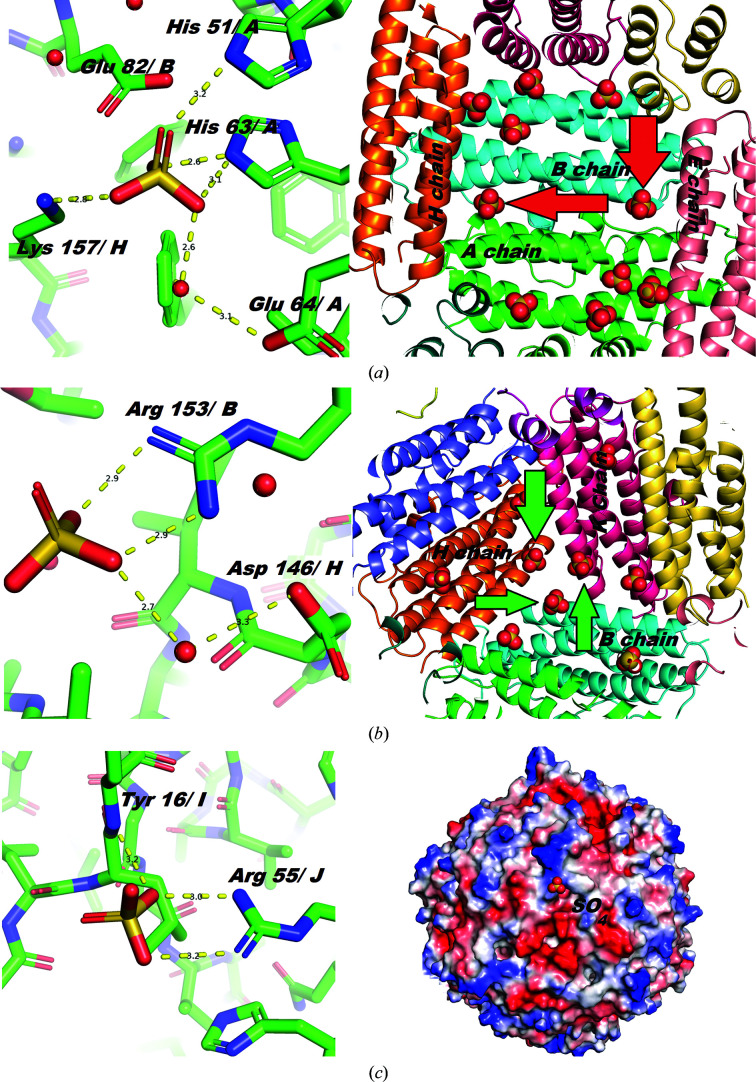
The structure of Dps was successfully determined and refined based on the merged multi-crystal data set. The phase problem was solved by molecular replacement using MOLREP (Vagin & Teplyakov, 2010 ▸) using the previously determined dodecameric structure of Dps from E. coli (PDB code 1dps; Grant et al., 1998 ▸) as a search model. Structure refinement was carried out using REFMAC5 (Murshudov et al., 2011 ▸); Coot (Emsley et al., 2010 ▸) was used for visual inspection, manual model rebuilding and checking geometry. Unfortunately, no sign of DNA was found, with all strong electron-density peaks in the unit cell being interpreted as two Dps dodecamers and low-molecular-weight ligands. Statistics relating to the final model obtained are reported in Table 4 ▸. The coordinates have been deposited in the Protein Data Bank as entry 6qvx. Fig. 5 ▸ shows an example of the final electron density. Least-squares fitting of the observed structure with the previously determined dodecameric structure of Dps (PDB entry 1dps; Grant et al., 1998 ▸) revealed no special features or critical deviations. The r.m.s.d. values of all of the atoms of residues 20–150 of chain A, obtained by superposing the first 12 molecules of the structure with PDB code 6qvx on PDB entry 1dps using LSQKAB (Kabsch, 1976 ▸), are depicted in Fig. 6 ▸. The average and maximum main-chain r.m.s.d. values are 0.388 and 0.904 Å, respectively, and are a consequence of different crystal packings in the compared structures. The average r.m.s.d. value for side-chain atoms is around 0.7 Å. All residues with an r.m.s.d. of greater than 2 Å have a large number of degrees of freedom (Lys, Arg or Asp). All of the solvent molecules in the structure were modeled as water, with the exception of 24 sulfate ions bound to the inner surface of the dodecamer and one ion on the outer surface. There are two types of sulfate bonding inside the dodecamer. The first (Fig. 7 ▸ a) is produced by His63 and His51 from one monomer and Lys157 from a perpendicular monomer. Each of the six inner faces of the dodecamer contains two sulfate ions of this type. The second type (Fig. 7 ▸ b) is located around the Fe2+ channel (Grant et al., 1998 ▸) formed by three Dps monomers (ferritin-like) and is made by Arg153 of each monomer. There are four Fe2+ channels inside the Dps dodecamer, and three sulfate ions per channel. The ion on the outer surface is located near another trimeric interaction (Fig. 7 ▸ c) and is bound by Arg55. Despite the presence of four trimeric interactions of this type, only one is engaged in binding a sulfate ion, while the other three produced dodecamer–dodecamer interactions. Sulfate is introduced during crystallization and its incorporation into the structure is likely to be a crystallization artifact.
Figure 5.
Electron-density map [2F o − F c, 0.55 e Å−3 (1.51 r.m.s.d.) level] on the outer surface of the Dps dodecamer.
Figure 6.
R.m.s.d. values for all atoms of residues 20–150 of chain A obtained by superposing the first 12 molecules of the structure with PDB code 6qvx on that with PDB code 1dps by the least-squares method.
Figure 7.
Three types of sulfate-ion binding. (a) The residues involved in binding: His51A, His61A and Lys157H (left). To show how the inner surface of the Dps hollow core is decorated with sulfates (right), the ions corresponding to the first binding type are marked with red arrows (12 ions per dodecamer). (b) Sulfates bound by Arg153 near the ferritin-like trimeric interaction (12 ions per dodecamer). To show how the inner surface of the Dps hollow core is decorated with sulfates (right), ions corresponding to the second binding type are marked with green arrows. (c) Sulfate bound by Arg55 near another (Dps-like) trimeric interaction on the outer surface of the dodecamer. The image on the right shows the protein surface potential of the outer surface sulfate-bonding region; the electrostatic potential was calculated using APBS (Baker et al., 2001 ▸) and was drawn using PyMOL (http://www.pymol.org). Negative charges are colored red and positive charges are colored blue.
4. Discussion
Although this work did not succeed in its initial aim (i.e. the determination of the crystal structure of a DNA–Dps complex), the successful solution of the crystal structure of Dps from E. coli in a P1 unit cell nevertheless confirms the applicability of the Mesh&Collect pipeline to multi-crystal data collection and structure solution exploiting small (∼5 µm in the largest dimension) crystals with a unit cell of very low symmetry.
In the work described here, Mesh&Collect was used to collect 404 partial data sets from crystals mounted in six different loops. More than 90% of the data sets were processed either automatically or manually, but only ∼65% were included in the final composite data set (Table 1 ▸).
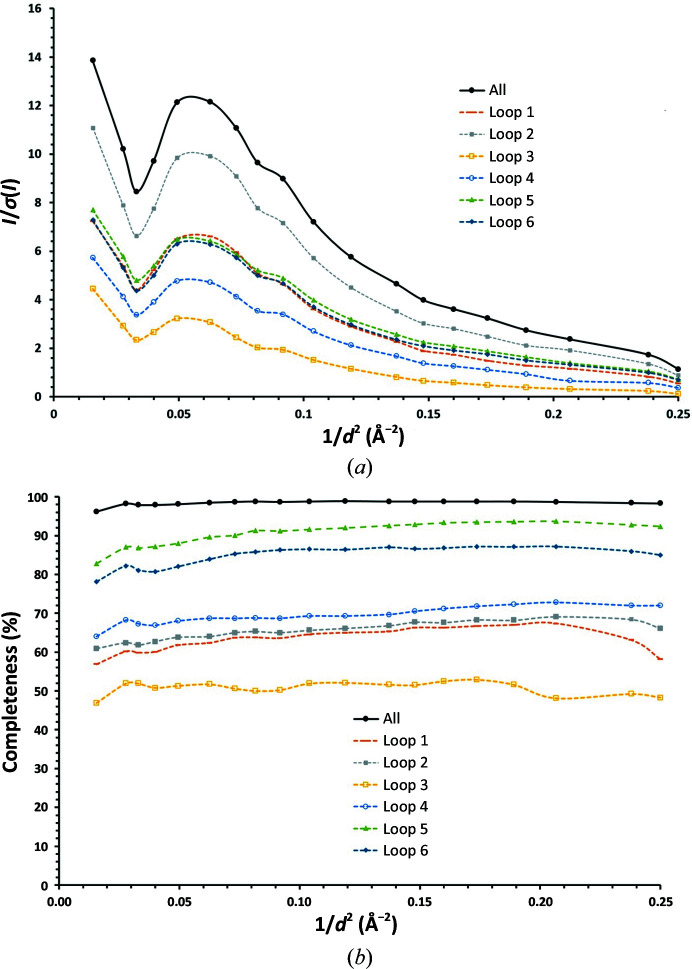
Considering each of the individual loops, the loop with the lowest proportion of partial data sets included in the final data set was loop 3, with only 12 of 25 partial data sets (41%) contributing. This can be explained by the fact that the diffraction data collected from the crystals contained in this loop are clearly of poorer quality than for the other five loops (Table 1 ▸, Fig. 8 ▸). This observation is probably owing to the fact that the X-ray beam size used (10 µm in diameter) is larger than the average crystal size, leading to suboptimal signal-to-noise ratios and highlighting the importance of appropriate beam-parameter selection when dealing with very small crystals. However, for loops 5 and 6 only a relatively low ratio of partial data sets contributed to the final data set (46% and 54%, respectively), suggesting that other factors, such as non-isomorphism, are also at play. Moreover, for loop 6 the diffraction images at both the start and the end of the total rotation range (±10°) for each partial data set showed weaker diffraction than the rest of the images collected. This was not seen for the partial data sets collected from crystals in the other loops and indicates that the 20° total rotation range for the collection of partial data sets from crystals on this loop was too large to maintain the crystal position at the intersection and that the location of the crystals with the two-dimensional raster scan in Mesh&Collect does not allow the proper centering of a crystal in the X-ray beam. However, collecting Mesh&Collect partial data sets with a large total rotation range per crystal (i.e. loops 5 and 6) was important for the final determination of the unit cell and space group for these low-symmetry crystals, and this could be seen as a useful strategy for Mesh&Collect experiments from low-symmetry crystals.
Figure 8.
Signal-to-noise ratio (a) and completeness (b) versus resolution for the final data set and for data sets merged from the crystals from individual loops.
Complicated experiments such as this are also good candidates for analysis using genetic algorithms (GAs; Zander et al., 2016 ▸). In our case, however, a GA was not able to provide any improvement over cluster analysis. The results showed that we could obtain a data set with 100% completeness, but this was detrimental to the quality and the exploitability of the data. Correlation coefficients and R merge values were poor in all cases and the resolution was thus lower than for HCA. A deeper investigation of scoring-function weights may have been more successful, since the algorithms tend to favor completeness over quality in these borderline cases, thus introducing extremely weak and noisy partial data sets that affect the overall quality of the final merged results. In this case, therefore, HCA was found to be a fast and efficient way to provide a data set of good quality from many weakly diffracting crystals.
Based on our limited experience of using the Mesh&Collect pipeline for crystals with low symmetry, we would like to note the tendency to improve both the volume of useful data and their quality when using sufficiently large scanning intervals. The disadvantage of the method is the inability to determine the position of the crystals in the direction of the X-ray beam, which limits the choice of survey strategy. The choice of optimal exposure depends on the radiation sensitivity of the samples and should be related to determination of the rotation interval. If there are a large number of crystals of the same quality, preliminary test estimates of the impact of the survey parameters on the data quality may significantly improve the results in structural research.
Supplementary Material
PDB reference: Dps, 6qvx
Acknowledgments
The authors thank the ESRF structural biology group leader Gordon Leonard for helpful suggestions and the European Synchrotron Radiation Facility for providing the possibility of conducting experiments and the treatment of data.
Funding Statement
This work was funded by Russian Academy of Sciences grant 082-2014-0001.
References
- Almirón, M., Link, A., Furlong, D. & Kolter, R. (1992). Genes Dev. 6, 2646–2654. [DOI] [PubMed]
- Azam, T. A. & Ishihama, A. (1999). J. Biol. Chem. 274, 33105–33113. [DOI] [PubMed]
- Baker, N. A., Sept, D., Joseph, S., Holst, M. J. & McCammon, J. A. (2001). Proc. Natl Acad. Sci. USA, 98, 10037–10041. [DOI] [PMC free article] [PubMed]
- Bourenkov, G. P. & Popov, A. N. (2010). Acta Cyst. D66, 409–419. [DOI] [PMC free article] [PubMed]
- Chiancone, E. & Ceci, P. (2010). Front. Biosci. 15, 122–131. [DOI] [PubMed]
- Emsley, P., Lohkamp, B., Scott, W. G. & Cowtan, K. (2010). Acta Cryst. D66, 486–501. [DOI] [PMC free article] [PubMed]
- Engilberge, S., Wagner, T., Santoni, G., Breyton, C., Shima, S., Franzetti, B., Riobé, F., Maury, O. & Girard, E. (2019). J. Appl. Cryst. 52, 722–731. [DOI] [PMC free article] [PubMed]
- Flot, D., Mairs, T., Giraud, T., Guijarro, M., Lesourd, M., Rey, V., van Brussel, D., Morawe, C., Borel, C., Hignette, O., Chavanne, J., Nurizzo, D., McSweeney, S. & Mitchell, E. (2010). J. Synchrotron Rad. 17, 107–118. [DOI] [PMC free article] [PubMed]
- Förster, A. & Schulze-Briese, C. (2019). Struct. Dyn. 6, 064302. [DOI] [PMC free article] [PubMed]
- Frenkiel-Krispin, D., Levin-Zaidman, S., Shimoni, E., Wolf, S. G., Wachtel, E. J., Arad, T., Finkel, S. E., Kolter, R. & Minsky, A. (2001). EMBO J. 20, 1184–1191. [DOI] [PMC free article] [PubMed]
- Garman, E. F. & Weik, M. (2017). Methods Mol. Biol. 1607, 467–489. [DOI] [PubMed]
- Giordano, R., Leal, R. M. F., Bourenkov, G. P., McSweeney, S. & Popov, A. N. (2012). Acta Cryst. D68, 649–658. [DOI] [PubMed]
- Grant, R. A., Filman, D. J., Finkel, S. E., Kolter, R. & Hogle, J. M. (1998). Nat. Struct. Mol. Biol. 5, 294–303. [DOI] [PubMed]
- Haikarainen, T. & Papageorgiou, A. C. (2010). Cell. Mol. Life Sci. 67, 341–351. [DOI] [PMC free article] [PubMed]
- Hutin, S., Santoni, G., Zander, U., Foos, N., Aumonier, S., Gotthard, G., Royant, A., Mueller-Dieckmann, C. & Leonard, G. (2019). J. Vis. Exp., e58594. [DOI] [PubMed]
- Kabsch, W. (1976). Acta Cryst. A32, 922–923.
- Kabsch, W. (2010). Acta Cryst. D66, 125–132. [DOI] [PMC free article] [PubMed]
- Karas, V. O., Westerlaken, I. & Meyer, A. S. (2013). J. Vis. Exp., e50390. [DOI] [PMC free article] [PubMed]
- Marko, M. A., Chipperfield, R. & Birnboim, H. C. (1982). Anal. Biochem. 121, 382–387. [DOI] [PubMed]
- Melnikov, I., Svensson, O., Bourenkov, G., Leonard, G. & Popov, A. (2018). Acta Cryst. D74, 355–365. [DOI] [PMC free article] [PubMed]
- Mueller-Dieckmann, C., Bowler, M. W., Carpentier, P., Flot, D., McCarthy, A. A., Nanao, M. H., Nurizzo, D., Pernot, P., Popov, A., Round, A., Royant, A., de Sanctis, D., von Stetten, D. & Leonard, G. A. (2015). Eur. Phys. J. Plus, 130, 70.
- Murshudov, G. N., Skubák, P., Lebedev, A. A., Pannu, N. S., Steiner, R. A., Nicholls, R. A., Winn, M. D., Long, F. & Vagin, A. A. (2011). Acta Cryst. D67, 355–367. [DOI] [PMC free article] [PubMed]
- Nurizzo, D., Mairs, T., Guijarro, M., Rey, V., Meyer, J., Fajardo, P., Chavanne, J., Biasci, J.-C., McSweeney, S. & Mitchell, E. (2006). J. Synchrotron Rad. 13, 227–238. [DOI] [PubMed]
- Owen, R. L., Rudino-Pinera, E. & Garman, E. F. (2006). Proc. Natl Acad. Sci. USA, 103, 4912–4917. [DOI] [PMC free article] [PubMed]
- Paithankar, K. S. & Garman, E. F. (2010). Acta Cryst. D66, 381–388. [DOI] [PMC free article] [PubMed]
- Santoni, G., Zander, U., Mueller-Dieckmann, C., Leonard, G. & Popov, A. (2017). J. Appl. Cryst. 50, 1844–1851. [DOI] [PMC free article] [PubMed]
- Vagin, A. & Teplyakov, A. (2010). Acta Cryst. D66, 22–25. [DOI] [PubMed]
- Winter, G., Waterman, D. G., Parkhurst, J. M., Brewster, A. S., Gildea, R. J., Gerstel, M., Fuentes-Montero, L., Vollmar, M., Michels-Clark, T., Young, I. D., Sauter, N. K. & Evans, G. (2018). Acta Cryst. D74, 85–97. [DOI] [PMC free article] [PubMed]
- Zander, U., Bourenkov, G., Popov, A. N., de Sanctis, D., Svensson, O., McCarthy, A. A., Round, E., Gordeliy, V., Mueller-Dieckmann, C. & Leonard, G. A. (2015). Acta Cryst. D71, 2328–2343. [DOI] [PMC free article] [PubMed]
- Zander, U., Cianci, M., Foos, N., Silva, C. S., Mazzei, L., Zubieta, C., de Maria, A. & Nanao, M. H. (2016). Acta Cryst. D72, 1026–1035. [DOI] [PMC free article] [PubMed]
Associated Data
This section collects any data citations, data availability statements, or supplementary materials included in this article.
Supplementary Materials
PDB reference: Dps, 6qvx


