

Abstract
There is a critical need to find safe therapeutics to treat an increasingly obese population and diseases associated with an imbalance in energy homeostasis. The melanocortin-3 receptor (MC3R) and melanocortin-4 receptor (MC4R) ligands have long been the focus to help scientists understand energy homeostasis and the regulation of feeding behavior. Herein, we use a nanomolar macrocyclic melanocortin receptor agonist ligand MDE6-5-2c (c[Pro-His-DPhe-Arg-Trp-Dap-Ala-DPro) to examine metabolic and energy hemostasis profiles upon intrathecal (IT) administration directly into the spinal cord as compared to intracerebroventricular (ICV) administration directly into the brain. Overall, central ICV administration of MDE6-5-2c resulted in decreased food intake, in a dose-dependent manner, and decreased respiratory exchange ratio (RER). Comparison of IT versus ICV routes of MDE6-5-2c administration resulted in MDE6-5-2c possessing a longer duration of action on both feeding behavior and RER via IT. The C-peptide, ghrelin, GIP, leptin, IL-6, and resistin plasma hormones and biomarkers were compared using IT versus ICV MDE6-5-2c routes of administration. Plasma resistin levels were decreased upon ICV treatment of MDE6-5-2c, as compared to ICV vehicle control treatment. Intrathecal treatment resulted in significantly decreased inflammatory cytokine interleukin-6 (IL-6) levels compared to ICV administration. Investigation of the nonselective MC3R and MC4R macrocyclic agonist MDE6-5-2c molecule revealed differences in food intake, RER, and plasma biomarker profiles based upon ICV or IT routes of administration and characterize this novel molecular chemotype as a molecular probe to study the melanocortin system in vivo.
Keywords: IT, ICV, Obesity, Melanocortin, TSE Cages, Feeding, MC4R
Graphical Abstract

Introduction:
There is an unmet need to identify therapeutics for the growing obesity epidemic and related diseases in the United States and globally.1 The melanocortin receptor family contains G protein-coupled receptors that consist of 5 subtypes (MC1–5R).2–12 The MC1–5R have been linked to a number of different roles in the body including sexual function13, 14, pigmentation3, steroidogenesis15, hypertension16, 17, and energy homeostasis.18–23 Specifically, MC3R and MC4R nonselective agonists have been targeted as potential therapeutics for obesity-related comorbidities. Naturally occurring agonists of the melanocortin system derive from the proopiomelanocortin (POMC) gene and include adrenocorticotropic hormone (ACTH), α-melanocyte stimulating hormone (MSH), β-MSH, and γ-MSH.24 The endogenous antagonists of the MC3R and MC4R receptors are agouti and agouti-related protein (AGRP).25–27 Intracerebroventricular (ICV) administration of the nonselective melanocortin receptor agonists melanotan II (MTII), NDP-MSH, and α-MSH resulted in decreased food intake in mice and rats.18, 20, 28, 29 In comparison, ICV administration of the AGRP endogenous MC3R antagonist and MC4R antagonist/inverse agonist and the synthetic melanocortin SHU9119 compound, which is a MC3R antagonist/partial agonist and a MC4R antagonist, increased food intake in mice, as compared to controls.18, 20, 23, 30 While MC4R-selective compounds have been investigated as potential therapeutics in the clinic for metabolic disorders, they have led to off-target side effects such as hypertension and increased male erectile activity.16, 31 For the investigation of MC4R-related obesity treatments, there is an unmet need for the creation of melanocortin ligands, using novel scaffolds and chemotypes, that would bypass these undesired side effects.
It has previously been reported that cyclizing the active loop of AGRP head-to-tail through a DPro-Pro motif, yielding the macrocycle c[Pro-Arg-Phe-Phe-Asn-Ala-Phe-DPro], resulted in a nanomolar MC4R antagonist ligand.32 Further structure activity-relationship (SAR) studies demonstrated that replacing the Asn with a diaminopropionic acid (Dap) residue increased MC4R antagonist potency, resulting in an equipotent MC4R antagonist compared to AGRP.32–34 To generate agonist ligands, the Arg-Phe-Phe tripeptide sequence from the antagonist macrocyclic scaffold was replaced with the His-DPhe-Arg-Trp melanocortin agonist sequence.33 Truncation studies established that removing the Phe from the scaffold, generating the macrocyclic octapeptide c[Pro-His-DPhe-Arg-Trp-Dap-Ala-DPro] (MDE6-5-2c), resulted in an agonist ligand possessing EC50 potencies of 1, 40, 2, and 0.3 nM at the MC1R, MC3R, MC4R, and MC5R, respectively.33 Due to the in vitro nanomolar potency of MDE6-5-2c at the MC4R and unique AGRP-derived scaffold, it is hypothesized that this ligand may result in a novel physiological profile in vivo.
Testing of melanocortin ligands in the central nervous system (CNS) has long been documented by ICV administration as the preferred approach. During ICV treatment, compounds are administered into the CNS via a cannula placed precisely into the lateral ventricles of the brain.35 The compound is then injected into the cerebral spinal fluid (CSF) of the lateral ventricles and interacts with centrally located melanocortin receptors in the brain. Intracerebroventricular injection in vivo experiments can be costly and resource intensive because animals have to undergo surgery and typically recover for at least 7 days before experimentation is initiated. An alternative approach to administer these ligands into the CNS through the spinal cord is via intrathecal (IT) administration.10, 36 During IT treatment, mice are given an unanesthetized lumbar puncture between L5 and L6 in which the compound is administered into the CSF of the spinal cord. This technique can be used to examine ligands and melanocortin receptors in the spinal cord. The function of melanocortin receptors in the spinal cord on metabolic functions remains undefined. Furthermore, it is important to be mindful that ligands that are administered into the spinal cord CSF access the brain, but at a very slow rate.36 Studies involving spinal cord melanocortin receptors can be informative for ligand design strategies because the MC4Rs in cholinergic, spinal neurons have been linked to obesity-induced hypertension.37
Analyzing both ICV and IT routes of administration could provide a better understanding of how melanocortin receptors influence metabolic behaviors via these mechanisms. Herein, we examined how the nonselective melanocortin agonist MDE6-5-2c affects feeding behavior for 24 h (and up to 72 h, Supporting Information Figure 2) after ICV and IT treatment. Subsequently, a comparative study of 5 nmol/5 μL MDE6-5-2c was performed to explore how respiratory exchange ratio (RER), ambulatory activity and energy expenditure (EE) differentiate and varied between routes of administration. To examine the comparative metabolic profiles of IT versus ICV administration, mouse plasma metabolic hormone levels were measured 6 h post-treatment. The goal of this study is to better understand how acute IT administration of melanocortin ligands can be used as a safe, robust technique to study differences between brain and spinal cord melanocortin receptor metabolic and energy homeostasis profiles.
Results and Discussion:
Both Intrathecal (IT) and Intracerebroventricular (ICV) Injections of MDE6-5-2c Decreased Food Intake in Mice.
To determine comparative MDE6-5-2c administration affects on food intake, we ran an in vivo feeding experiment using three concentrations of MDE6-5-2c (2, 5, and 10 nmol in saline vehicle per mouse) administered either ICV or IT (Fig. 1A) into the same cohort of cannulated mice. Thus, each animal received compound and vehicle control to minimize experimental variability between individual mice. Cumulative food intake was analyzed every 4 h for 24 h (Figure 2) and up to 72 h (Supporting Information Figure 2) after a single dose treatment. These experiments were performed using a “normal” satiated nocturnal experimental paradigm where mice were administered compound or vehicle control 2 h before lights out. Food and water are available ab libitum. Mice administered ICV with MDE6-5-2c ate less cumulative food, dose-dependently, as compared to mice treated with vehicle control. Mice treated with 5 nmol MDE6-5-2c ICV had decreased cumulative food intake than vehicle at 4, 8, and 12 h after administration. Mice treated with a single dose of 10 nmol MDE6-5-2c ICV had decreased cumulative food intake for 24 h (Fig. 2A) and up to 72 h (Supporting Information Figure 2) post-treatment. Mice that had MDE6-5-2c administered IT resulted in a different profile. IT administration of 5 nmol MDE6-5-2c resulted in significantly reduced cumulative food intake at 16, 20, and 24 h following single treatment compared to vehicle treated mice (Fig. 2B). No significant changes in mouse body weight resulted for up 24 h after treatment (data not shown).
Figure 1.
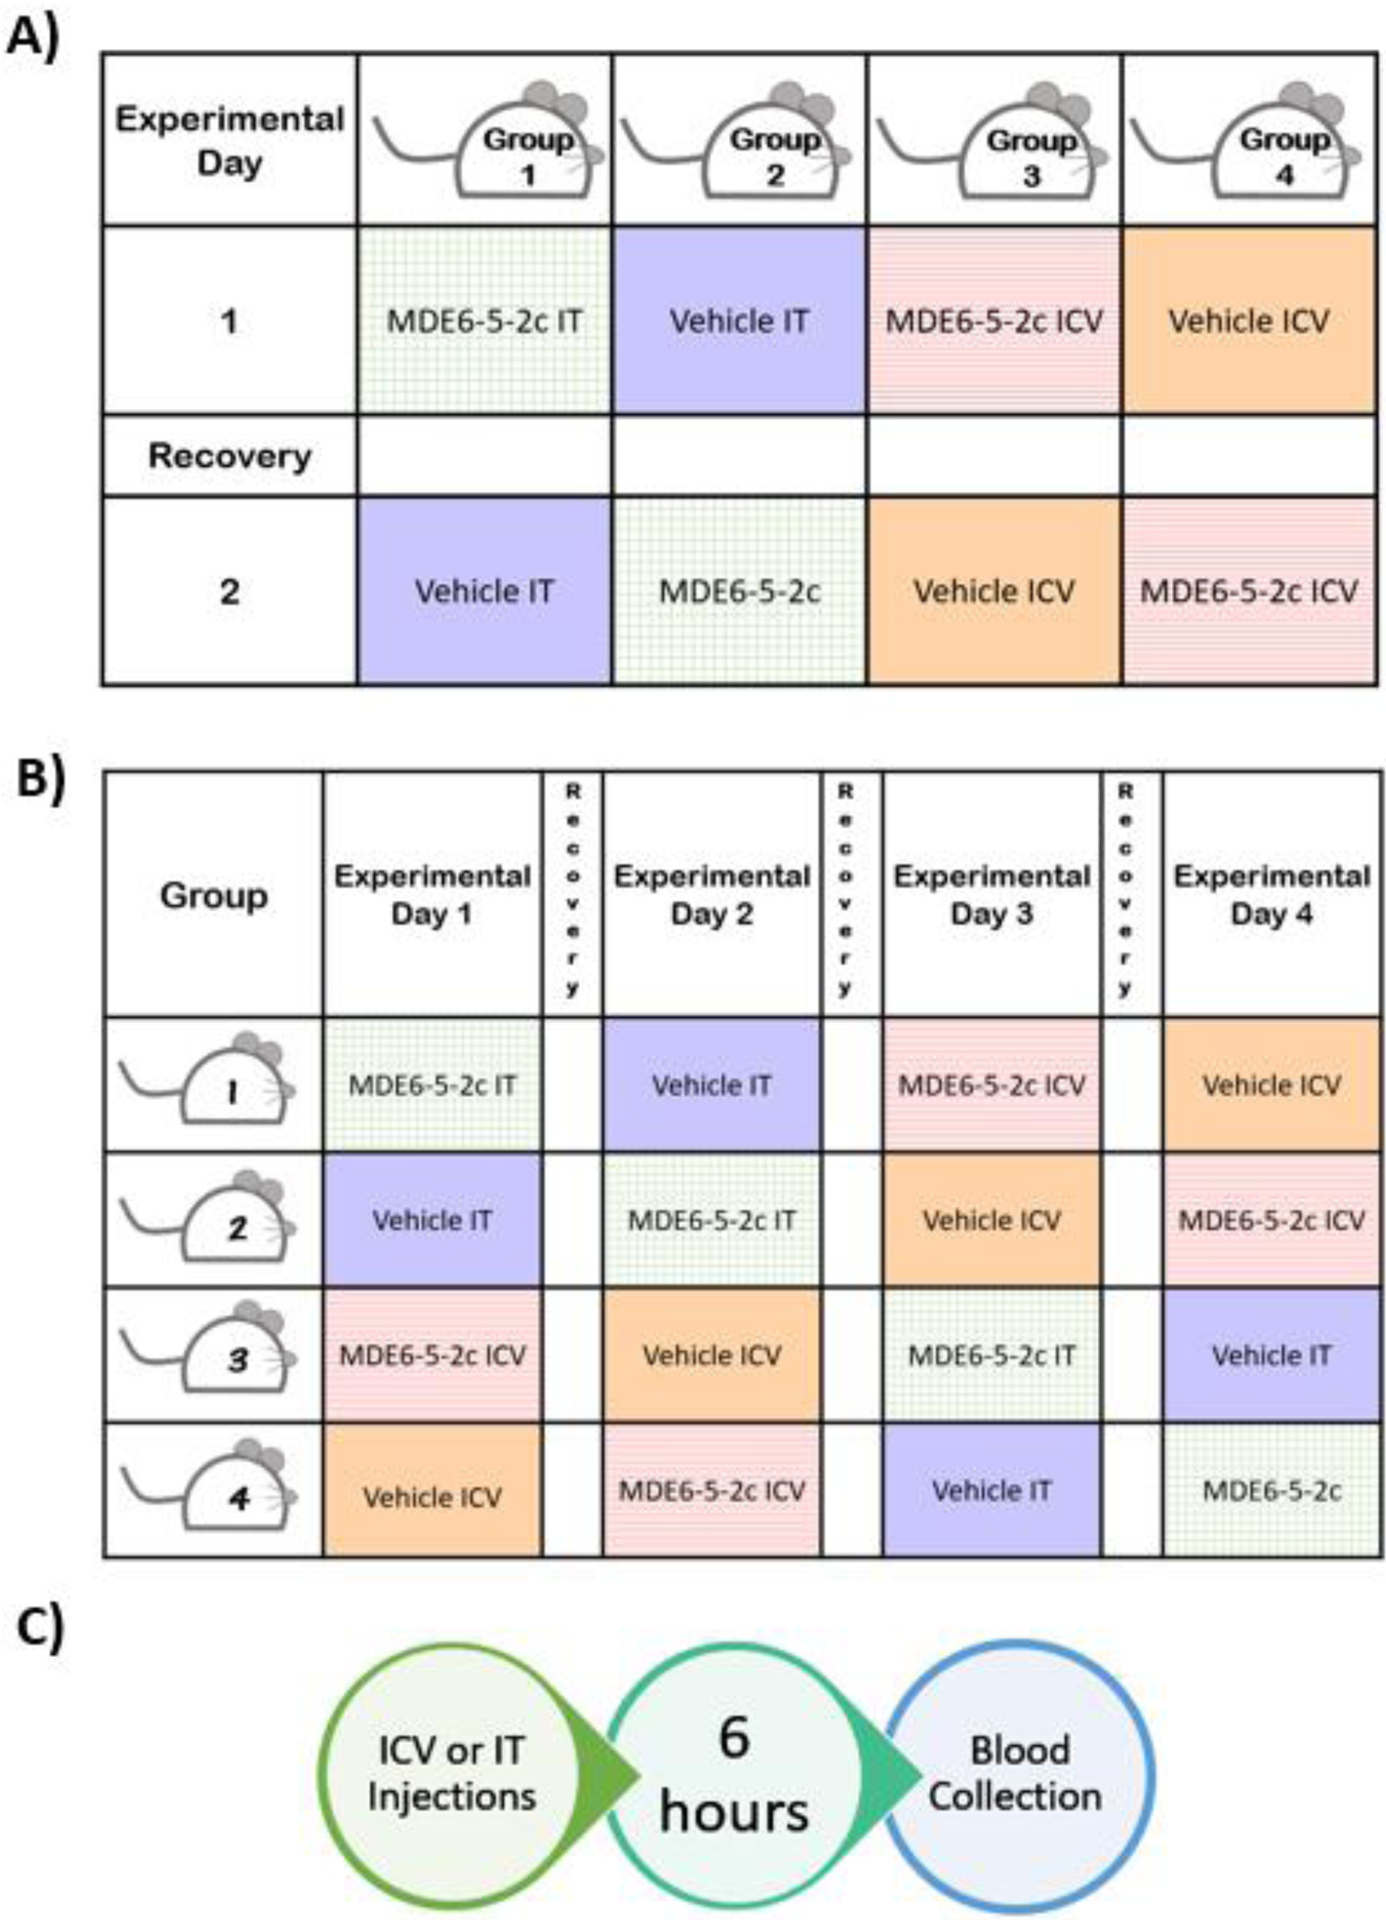
Experimental design for MDE6-5-2c dose-response feeding experiments and blood collection. (A) Dose-response experiments examining how concentration of MDE6-5-2c influences mouse food intake. Mice were tested twice in this experiment where mice were treated with a single dose of 2 nmol MDE6-5-2c during experiment 1 and with 10 nmol MDE6-5-2c in experiment 2. Mice received a 6-day recovery washout period (white boxes) to re-establish baseline energy homeostasis and feeding behavior. (B) Mice were treated with either a single dose of 5 nmol MDE6-5-2c or vehicle via IT or ICV route of administration. Mice received a 6 day recovery washout period (white boxes) to re-establish baseline energy homeostasis and feeding behavior. (C) Timeline for the blood plasma biomarker experiment. Mice were treated with either a single injection of 5 nmol MDE6-5-2c or vehicle control, 2 h before lights off. Food intake and body weight data was collected every 2 h post treatment until blood collection. A group of naïve, age-matched mice (n=5) were sacrificed at the same time of day in a separate experiment for comparative plasma biomarker levels.
Figure 2.

Dose-response summary of cumulative food intake comparing single treatment of MDE6-5-2c with a single treatment of vehicle control in male WT cannulated mice. (A) Decreased cumulative food intake was dose-dependent on concentration of MDE6-5-2c versus vehicle control when administered ICV. Cumulative food intake was significantly decreased in mice treated with 5 nmol MDE6-5-2c at 4, 8, and 12 h after administration compared to vehicle controls. Mice administered ICV with 10 nmol MDE6-5-2c had decreased food consumption up to 24 h post treatment, as compared to mice treated with vehicle control. (B) Comparison of cumulative food intake depending on concentration of MDE6-5-2c versus vehicle administered IT. Mice treated IT with 5 nmol of MDE6-5-2c ate significantly less at 8, 12, 16, 20, and 24 h after treatment than mice injected with vehicle control. Vehicle contains purified H2O and <3% DMSO in equal concentrations as the different MDE6-5-2c concentration treated groups. **p < 0.01, *** p < 0.001 for 5 nmol MDE6-5-2c compared to vehicle. ##p < 0.01, ###p < 0.001 for 10 nmol MDE6-5-2c compared to vehicle. Data is represented as mean ± SEM.
Food intake results are consistent with the in vitro pharmacology of MDE6-5-2c functioning as a nonselective MC3R and MC4R agonist.33 It was postulated that a dose-dependent decrease in cumulative food intake would result with 2, 5, and 10 nmol MDE6-5-2c concentrations via ICV administration. A dose-dependent decrease in cumulative food intake was not observed, however, when MDE6-5-2c was administered IT. A 5 nmol concentration of MDE6-5-2c appears to be the most effective concentration upon IT administration (Fig. 2B).
Route of Administration of 5 nmol MDE6-5-2c Differentially Affects Food Intake and Respiratory Exchange Ratio.
A previous report found that routes of administration of melanocortin compounds can differentially influence metabolic profiles in mice.10 It has been postulated that this differential metabolic profile may be a result of spinal cord administration, but additional experimental data are needed to develop this hypothesis further. Herein, the nonselective melanocortin agonist MDE6-5-2c (designed based upon a unique AGRP antagonist chemotype) is being used to test this hypothesis and how administration routes of melanocortin compounds impact energy homeostasis profiles.33 A cohort of 15 cannulated wild-type (WT) male mice were placed in TSE metabolic cages and divided into four groups (vehicle vs. MDE6-5-2c and ICV vs. IT) in a Latin square, nocturnal (non-fasting) experimental paradigm (Fig. 1B). Each mouse was treated with all four different combinations (vehicle ICV, vehicle IT, MDE6-5-2c ICV or MDE6-5-2c IT) 2 h before the onset of the “dark” light cycle. The TSE metabolic cages measured mouse food intake, water intake, ambulatory activity (beam break), respiratory exchange ratio (RER), and energy expenditure (EE). Overall, mice treated via IT administration ate significantly more than mice treated via ICV administration around 6 h post-treatment (Fig. 3A) during their nocturnal feeding cycle. Since there was a significant effect of compound observed, the food intake data was further analyzed between the two routes of administration. ICV administration of MDE6-5-2c resulted in decreased food intake only up to the first 2 h post-treatment, as compared to vehicle control (Fig. 3C). IT administration of MDE6-5-2c resulted in decreased food intake at 4 and 6 h post-treatment, as compared to vehicle control (Fig. 3D). Water intake was significantly higher at 8 h post-treatment in mice administered IT as compared to mice treated ICV for both vehicle and MDE6-5-2c (Fig. 3B). Since there was not a significant main effect of compound for the water intake data, no further analysis was performed. The MDE6-5-2c food intake results are similar to previous reports where the nonselective melanocortin agonist MTII, upon treatment IT, resulted in a 2 h longer duration of action of cumulative food intake versus ICV administration at the same concentration.10 These data support the hypothesis that nonselective melanocortin agonists have different food intake profiles based upon IT (slower onset, longer lasting) versus ICV (acute onset, short duration of action) routes of administration in the same mouse. The mechanism of action for these results remain unknown; however, it could be speculated that upon IT treatment, the compound requires more time to reach the brain via the CSF network, versus direct access into the brain via the ICV administration route. This hypothesis could be probed in future experiments with different molecular chemotypes and melanocortin receptor ligand selectivity profiles.
Figure 3.
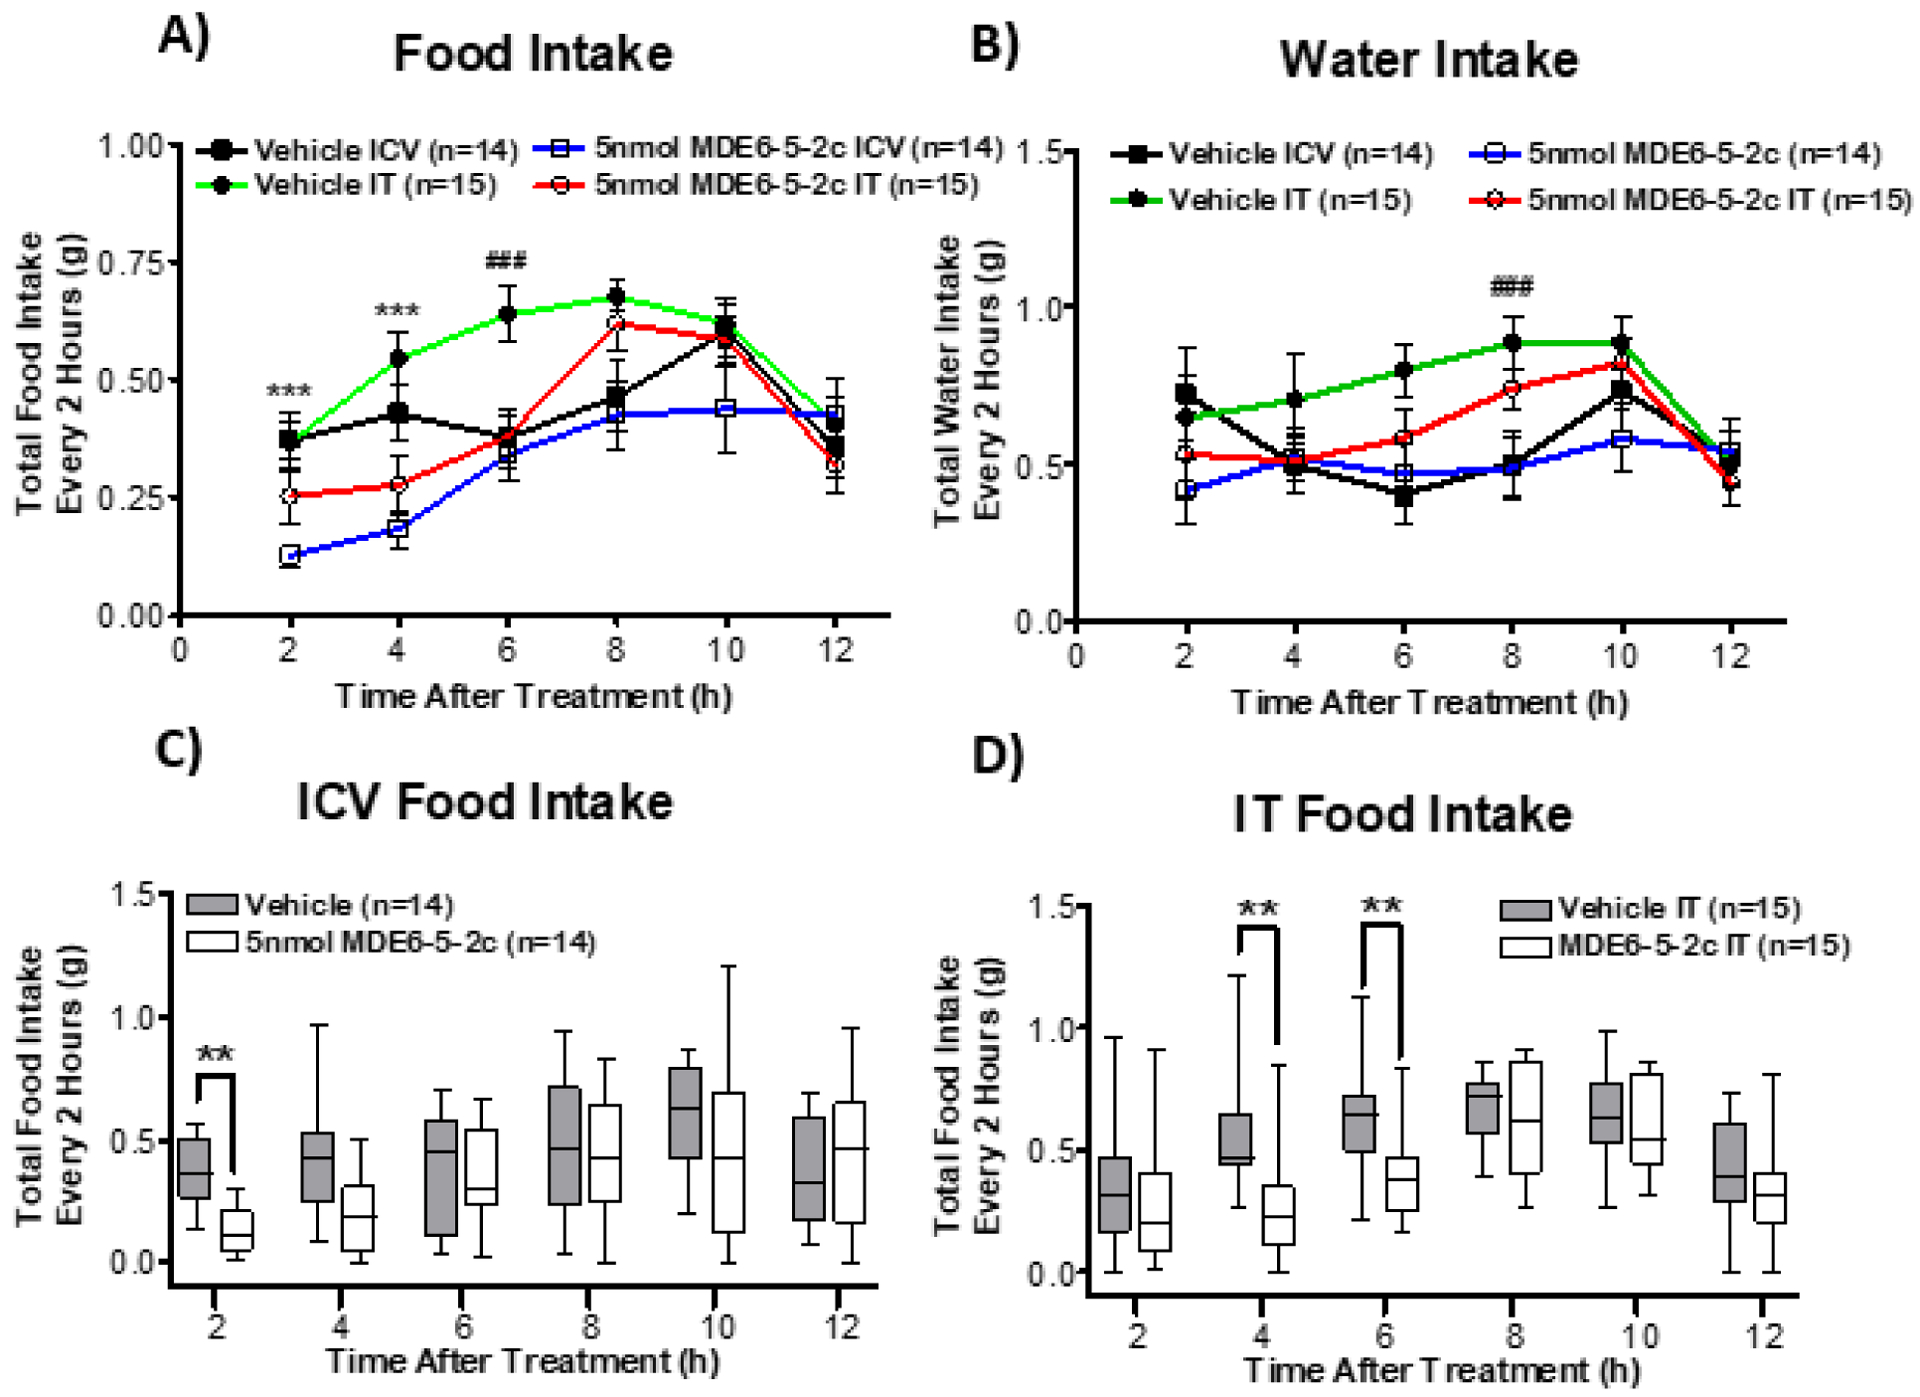
Acute food intake response is differentially influenced by the route of administration (ICV versus IT) of 5 nmol of MDE6-5-2c, versus vehicle control treatment. (A) Overall comparison of food intake depending on route of administration and compound MDE6-5-2c. Total food intake was significantly decreased in mice treated with a single dose of 5 nmol MDE6-5-2c at 2 h and 4 h post-treatment, as compared to mice treated with vehicle control. Mice that were administered 5 nmol of MDE6-5-2c IT ate significantly more food at 6 h post-treatment, as compared to mice treated ICV. (B) Comparison of water intake, depending on route of administration, and compound MDE6-5-2c. Mice that were subject to IT administration drank significantly more water at 8 h after treatment, as compared to ICV administration, regardless of the vehicle control or 5 nmol of MDE6-5-2c. Compound MDE6-5-2c did not have an effect on water intake. (C) Mice treated with a single dose of 5 nmol MDE6-5-2c ICV ate significantly less food 2 h post treatment, as compared to mice injected with vehicle ICV. (D) Mice that were administered a single dose of 5 nmol MDE6-5-2c IT resulted in an acute decrease in food consumption at 4 and 6 h post-treatment, as compared to mice that were injected with vehicle IT. **p < 0.01, *** p < 0.001 for MDE6-5-2c compared to vehicle. ##p < 0.01 for comparing ICV administration to IT administration. Data in graphs A and B are represented as mean ± SEM. Data in graphs C and D are represented as traditional box and whisker plot. The box represents the upper and lower quartiles of the data set with a line to indicate the mean. The whiskers indicate the data maximum and minimum.
To compare the effect of melanocortin agonist administration on metabolic profiles, the nonselective melanocortin receptor (MC3R/MC4R) agonist MDE6-5-2c was used to study changes in metabolic parameters such as respiratory exchange ratio (RER), ambulatory activity, and energy expenditure (EE). Analyzing RER data can distinguish between metabolic fuel sources being utilized during certain time points or upon treatment (i.e. carbohydrates or fatty acids). The RER values are determined based upon measurements obtained from the TSE metabolic cages by taking the volume of CO2 produced and then dividing by the O2 volume consumed. When RER values approach 1.0, it has been established in the field that carbohydrates are the primary fuel source being utilized in the body. The RER values approaching 0.7 indicate fats as the primary fuel source.38, 39 At 8 h after MDE6-5-2c treatment, IT administered mice had a significantly higher RER value than mice treated via ICV administration (Fig. 4A). In both ICV and IT routes of administration, a single treatment of 5 nmol MDE6-5-2c resulted in significantly decreased RER values, as compared to vehicle control values, for up to 12 h after treatment (Fig. 4A). Since a significant difference between the routes of administration and drug was observed, RER was further analyzed separately based on route of administration. Mice treated ICV with 5 nmol MDE6-5-2c had significantly decreased RER values 2 to 6 h post-treatment as compared to vehicle control values (Fig. 4B). The same mice, when treated with 5 nmol MDE6-5-2c IT, had significantly decreased RER values 4 to 12 h post-treatment as compared vehicle control treatment (Fig. 4C). These results parallel what was observed for the food intake data where IT administration of 5 nmol MDE6-5-2c seemed to have a delayed onset and longer duration of action as compared to ICV treatment (Fig. 3C and D). Overall, these data indicate that when mice are treated with 5 nmol MDE6-5-2c, they shift from carbohydrates (RER =1.0) to fatty acid utilization (RER=0.7) as their fuel source when comparing the same mice treated with vehicle control. This finding has also been reported for the nonselective melanocortin receptor agonist MTII that possessed decreased RER levels as compared to vehicle control treatment.10 It has been well established that melanocortin antagonists such as the synthetic SHU9119 and endogenous AGRP shifted RER values indicating the utilization of carbohydrates as a predominant fuel source.11, 40, 41 In summary, 5 nmol MDE6-5-2c upon IT administration resulted in the prolonged effect of decreasing RER as values compared to ICV administration in the same mouse.
Figure 4.

Acute summary of metabolic measures in male mice treated with 5 nmol MDE6-5-2c via IT or ICV administration. (A) Synopsis of respiratory exchange ratio (RER) dependent on route of administration and vehicle or 5 nmol MDE6-5-2c treatment. Respiratory exchange ratio is determined by taking the volume of CO2 generated divided by the O2 consumed by the mouse. Mice treated with 5 nmol MDE6-5-2c had significantly decreased RER at 2, 4, 6, 8, 10, and 12h after injection. The RER was significantly decreased in mice administered drug delivered by ICV versus IT. (B) Mice given 5 nmol MDE6-5-2c via ICV delivery had significantly reduced RER values 2, 4, and 6 h post treatment as compared to vehicle ICV control mice. (C) Mice treated with 5 nmol MDE6-5-2c IT resulted in significantly decreased RER at 4, 6, 8, 10, and 12 h post-treatment. Comparison of data in B and C indicates IT administration of 5 nmol MDE6-5-2c resulted in a more “chronic” (4 to 12 h) effect on RER than the “acute” (2, 4, and 6 h) response observed upon ICV administration. (D) Treatment with 5 nmol MDE6-5-2c and route of administration had a significant interaction on activity over time (p = 0.030 and p = 0.044), but we did not find significance at any specific time point. (E) Mice treated with 5 nmol MDE6-5-2c resulted in significantly increased energy expenditure (EE) 8 h post-treatment, as compared to mice treated with vehicle control. Energy expenditure is calculated by gathering the amount of kilocalories utilized per hour and normalized to the body weight of mouse (kcal/h/kg). **p < 0.01, *** p < 0.001 for 5 nmol MDE6-5-2c compared to vehicle control. ## p < 0.01 for comparing ICV administration to IT administration. Data in graphs A, D, and E are represented as mean ± SEM. Data in graphs B and C are represented as traditional box and whisker plot. The box represents the upper and lower quartiles of the data set with a line to indicate the mean. The whiskers indicate the data maximum and minimum.
Physical activity is often used during in vivo studies as a measure of animal well-being and to identify drug and dose tolerance. Monitoring physical activity is a standard approach to experimentally address concerns of treatment toxicity that would be observed with inactivity and undesired adverse behaviors.10–12, 42 The energy expenditure (EE) determination requires activity data as a component to analyze the amount of energy consumed by a mouse.38 In this study, we examined how the route of administration (ICV versus IT) of 5 nmol MDE6-5-2c compound would affect mouse activity in the same individuals. There was a significant interaction of time × drug and time × administration (p<0.05), but a post-hoc analysis did not identify a specific time point difference in ambulatory activity (Fig. 4D). Further analysis identified that mice treated with 5 nmol MDE6-5-2c had expended more energy compared to vehicle treated mice at 8 h post a single dose administration (Fig. 4E). Importantly, neither ambulatory activity nor energy expenditure were significantly reduced by 5 nmol MDE6-5-2c by either administration method. These data suggest that administration (IT and ICV) of 5 nmol MDE6-5-2c did not negatively affect the energy homeostasis in these mice. These data are consistent with a previous report demonstrating ambulatory activity was not differentiated between ICV and IT administration for melanocortin ligands.10 The melanocortin agonist MTII (3 nmol) administration ICV and IT was reported to result in a significantly higher EE in the first 4 and 8 h post treatment,10 whereas a significant difference was observed in EE for 5 nmol MDE6-5-2c at 8 h post treatment ICV or IT. In contrast, it has been reported that administration of MTII resulted in decreased EE upon a single injection peripherally.43, 44 This study demonstrates that centrally administered melanocortin agonists (ICV or IT) could be a viable alternative to peripheral administration to study probe compounds at the melanocortin receptors expressed in the brain.
Effect of MDE6-5-2c on Metabolic Plasma Hormone Biomarkers.
Using a “normal” nocturnal (nonfasting) experimental paradigm, a group of cannulated WT male mice received a single treatment of 5 nmol MDE6-5-2c (n=7–9) or vehicle control (n=6–8) via either ICV or IT routes of administration. Six hours post-treatment, the mice were euthanized, and trunk blood was collected (Supporting Information Fig. 1E). Plasma levels of the hormones [C-peptide, ghrelin, glucose-dependent insulinotropic polypeptide (GIP), and leptin] and the cytokines (Interleuken-6 and Resistin) were analyzed using a MILLIPLEX® MAP mouse metabolic hormone magnetic bead panel multiplex assay.12
The C-peptide biomarker is a widely used clinical biomarker correlated with insulin secretion and β cell function.45 The C-peptide and insulin peptides are equally created and cleaved from the same progenitor proinsulin gene.46, 47 Previous publications examining melanocortin receptor agonist administration reported decreased insulin and C-peptide plasma levels.12, 36, 46–50 In this experiment, neither IT nor ICV injections of 5 nmol MDE6-5-2c resulted in a statistically significant change of C-peptide plasma levels (Fig. 5A).
Figure 5.

Comparison of metabolic hormone and biomarker plasma levels upon intracerebroventricular (ICV; black bars) or intrathecal (IT; white bars) administration 6 h post-treatment of a single dose of 5 nmol MDE6-5-2c (IT n=7–8; ICV n=9) or vehicle control (IT n=6–7; ICV n=7–8) in male cannulated WT mice. (A) Neither route of administration nor treatment had a significant effect on C-peptide levels. (B) Mice treated with 5 nmol MDE6-5-2c ICV had significantly increased ghrelin plasma levels 6 h post-administration, as compared to mice treated ICV with vehicle control. There was no significance observed comparing ICV and IT vehicle control groups nor between groups administered vehicle IT or 5 nmol MDE6-5-2c IT. (C) Mice treated with vehicle IT had significantly increased GIP plasma levels 6 h post-treatment as compared to mice treated with vehicle control ICV. Plasma levels of GIP did not differ between vehicle and 5 nmol MDE6-5-2c treatment groups via ICV or IT routes of administration. (D) Mice that were treated with vehicle control ICV had significantly decreased leptin plasma levels as compared to mice administered vehicle IT. Notably, there was a trend toward mice treated with 5 nmol MDE6-5-2c (IT) that resulted in decreased leptin plasma levels, as compared to vehicle control treated mice (p = 0.056). (E) Interleuken-6 (IL-6) plasma levels in mice injected via IT administration resulted in decreased levels as compared to mice injected via ICV for both vehicle or 5 nmol MDE6-5-2c treated groups. Plasma levels of IL-6 for 5 nmol MDE6-5-2c or vehicle treated control mice were not significantly different, despite ICV or IT routes of administration. (F) Plasma levels of resistin were decreased in mice tested with 5 nmol MDE6-5-2c, as compared to vehicle control treated mice when administered ICV. No significant difference between resistin plasma levels in mice treated with vehicle or 5 nmol MDE6-5-2c via IT administration resulted. *p < 0.05, ** p < 0.01 for MDE6-5-2c compared to vehicle controls and mode of administration. Data is represented as mean ± SEM.
Interleukin-6 (IL-6) is a proinflammatory cytokine observed at high levels in patients at risk for type 2 diabetes.51, 52 Previously, the literature has reported conflicting results about the influence of nonselective melanocortin agonists, like α-melanocyte-stimulating hormone (α-MSH), on IL-6 plasma levels and secretion. The majority of these studies claimed that melanocortin agonists cause a decrease in IL-6 secretion and plasma levels,53–55 while only one study indicated that a single dose of α-MSH caused an acute increase in secretion of IL-6.56 We found that a single ICV or IT treatment of 5 nmol MDE6-5-2c did not influence the plasma levels of IL-6 (Fig. 5E). However, the route of administration had a significant effect on IL-6 plasma levels. Upon IT administration, both vehicle control and 5 nmol MDE6-5-2c resulted in decreased IL-6 plasma levels relative to the ICV route of administration.
Ghrelin is a peptide that has an orexigenic effect by activating hypothalamic neuropeptide Y (NPY) and agouti related peptide (AGRP) neurons and is a known upstream regulator of the melanocortin pathway.57, 58 Upon IT administration of 5 nmol MDE6-5-2c, no significant difference in plasma ghrelin levels compared to vehicle controls was observed (Fig. 5B). However, there was a significant increase of ghrelin in mice treated with 5 nmol MDE6-5-2c via ICV administration, as compared to vehicle control mice (Fig. 5B). This latter result is consistent with a previous study where mice were treated with a bivalent melanocortin agonist compound, but it remains unclear if this a direct pharmacological effect or a consequence of decreased food intake compared to controls.12 Increased ghrelin plasma levels might be anticipated since mice treated with 5 nmol MDE6-5-2c consumed less chow, as compared to control treated mice.
Leptin is a hormone that originates from adipose tissue and is elevated in individuals with a higher fat mass.59 Leptin induces satiety; however, obese animal models often have been reported to possess decreased sensitivity to leptin, also referred to as leptin-resistance.60–63 Previous publications examining the influence of melanocortin agonists such as MTII on leptin serum and plasma levels reported decreased levels upon compound treatment.12, 49, 50 In this study, a decreased (p=0.056) plasma leptin value resulted from 5 nmol MDE6-5-2c administration IT but not ICV (Fig. 5D). Previous publications examining treatments postulated that decreased leptin plasma levels are linked to decreased food intake that correlated with an acute decreased body weight and fat mass.49, 50 Treatment with 5 nmol MDE6-5-2c did not result in differences in lean or fat mass (Supporting Information Fig. 1C and D) when administered either IT or ICV.
Glucose-dependent insulinotropic polypeptide, also known as gastric inhibitory peptide (GIP), stimulates insulin secretion with the help of glucagon-like peptide 1 (GLP-1) in the pancreatic β-cells.64–67 While the understanding of how GIP is manipulated in metabolic disease remains inconclusive, it has been demonstrated that increased plasma GIP levels are observed in obese animals (which go away after fasting). Additionally, GIP resistance has been observed in many individuals with type 2 diabetes mellitus.67–71 In previous studies, GIP levels have been reported to decrease in plasma after administration of a melanocortin agonist in mice.12, 72 Mice treated with 5 nmol MDE6-5-2c, despite eating less food than controls, did not show any significant changes in GIP versus vehicle control, either IT or ICV (Fig. 5C).
Resistin is a cytokine that is secreted by adipocytes during adipogenesis and has been reported to directly impact insulin resistance in obese mice.73 Treatment with 5 nmol MDE6-5-2c ICV resulted in significantly decreased plasma levels of resistin (Fig. 5F). Previous studies reported decreased resistin plasma levels when mice were treated with melanocortin agonists and increased resistin plasma levels upon treatment with the melanocortin MC3R and MC4R antagonist SHU9119.12, 74, 75
Effect of Administration (ICV vs. IT) on Metabolic Hormone Levels.
It is noteworthy to report that the route of administration had a significant effect on metabolic plasma hormone levels, as anticipated. As compared to vehicle control, both leptin and GIP plasma hormone levels are significantly increased in mice treated via IT administration as compared to mice treated via ICV administration (Fig. 5C and D). These differences can be postulated to be linked to differences in food intake comparing only routes of administration, i.e. observed at 6 h post-treatment (Figs. 3A, C, and D). Leptin is a hormone that stimulates satiety, so it is not surprising to observe that increased food intake in mice treated with vehicle via IT administration resulted in increased leptin plasma levels.60, 61 Mice treated with vehicle control via IT administration showed increased food intake and GIP plasma levels as compared to ICV administration which decreased food intake and GIP levels. The most robust difference observed between IT and ICV routes of administration of vehicle is for the IL-6 plasma levels (Fig. 5E). These results indicate a strong effect solely from route of the administration, ICV versus IT. Since IL-6 is a pro-inflammatory cytokine, it could be postulated that the procedure of IT administration causes reduced inflammatory cascade than ICV administration.51, 52
Comparisons of Naïve Mice versus IT or ICV Vehicle Treated Mice.
For the experimental paradigm presented here, the metabolic profile of mice that had undergone cannulation surgery were compared for changes after administration of vehicle control or MDE6-5-2c via IT or ICV routes of administration. While this serves as an experimental control, it is interesting to ponder the hormone plasma values of naïve mice that have not undergone any type of surgery but were age-matched and sacrificed at the same time point as the cannulated mice with the corresponding plasma hormone levels shown in Fig. 5. In these naïve mice (n=5), the levels of C-peptide 840 ± 60 pg/mL, ghrelin 595 ± 70 pg/mL, GIP 460 ± 50 pg/mL, leptin 1630 ± 180, IL-6 50 ± 5 pg/mL, and resistin 8500 ± 550 pg/mL were observed in the plasma.12, 76 Notably, the naïve values for C-peptide, GIP, leptin, and resistin are different than the cannulated and ICV/IT vehicle treated mice in this experiment. The ghrelin levels are similar for both the cannulated ICV and IT vehicle treated groups. The IL-6 values of naïve mice are similar to the IT treated cannulated vehicle control values (Fig. 5). While every effort was made to keep the treatment of the naïve and experimental mice relatively the same, it is well established that mice receiving surgery and compound administration (vehicle or MDE6-5-2c) are innately undergoing higher levels of stress. Thus, the experimental design of comparing identically manipulated mice treated with vehicle control versus compound administration in the same individual serves as the most robust control variable. A plethora of studies examining the effects of experimental stress and the corresponding influences on leptin and plasma hormone levels in rodents show wide variation and seem dependent on the methodology of the experimental stress models utilized.77–80 Thus, based upon these variables it is challenging to directly compare naïve mice to the cannulated and treated mice reported herein.
Conclusions
Discovery of structurally distinct molecules and chemical probes is essential for deciphering pharmacological pathways regulated by the melanocortin system for the development of safe therapeutics for the treatment of obesity and related diseases. An antagonist AGRP based macrocyclic chemotype scaffold was modified and converted to the potent nonselective MC3R/MC4R agonist MDE6-5-2c.33 Herein, intrathecal (IT) and intracerebroventricular (ICV) routes of administration of MDE6-5-2c were used to compare differences in energy homeostasis profiles when administered directly into the brain (ICV) or spinal cord (IT). Both ICV and IT administration of 5 nmol MDE6-5-2c decreased food intake as compared to vehicle control treated mice. Similarly, RER values were decreased in mice administered 5 nmol MDE6-5-2c by both ICV and IT routes of administration. Mice treated with 5 nmol MDE6-5-2c IT possessed a longer duration of action on both food intake and RER, as compared to ICV administration. Mice treated with 5 nmol MDE6-5-2c ICV showed significant changes in the plasma hormones ghrelin and resistin, as compared to IT administration. The ICV route of administration alone resulted in increased IL-6 plasma levels as compared to IT treatment of both vehicle and 5 nmol MDE6-5-2c. These data support the hypothesis that ICV and IT routes of administration of melanocortin ligands both provide similar results toward determining if a compound can increase or decrease food intake, RER, EE, physical activity, and plasma biomarkers relative to vehicle treatment responses. However, there are both subtle and significant differences that emerge upon detailed profiling when comparing the same compound in the same mice with different routes of administration in the brain.
Methods:
Animals.
Male wild-type (WT) mice containing a mixed 129/Sv×C57BL/6J background were used and originated from an in-house breeding colony as previously reported in literature.10–12, 20, 22, 81 All mice were housed in a 12 h reverse light-dark cycle (lights off 12 pm). Experimental mice were housed in TSE PhenoMaster metabolic cages (TSE Systems; Berlin, Germany) throughout the metabolic profiling studies that measured food intake, water intake, physical activity (via beam break), RER, and EE. Mice undergoing hPYY validation and the Milliplex plasma hormone panel experiments were housed in standard polycarbonate conventional cages provided by the University of Minnesota’s Research Animal Resources (RAR). Mice were 8 weeks old, age-matched and weight-matched at the start of the experiment. Cages were changed out weekly by lab research staff. All mice had ad libitum access to water and normal mouse chow (Harlan Teklad 2018 Diet; 18.6% crude protein, 6.2% crude fat, 3.5% crude fiber). This mouse chow has an energy density of 3.1 kcal/g. These experiments were performed and approved within the guidelines provided by the Institutional Animal Care and Use Committee (IACUC) at the University of Minnesota.
Cannulation Surgery and Cannula Placement Validation.
Surgery for cannula implantation was performed as described previously.10–12, 20, 22, 23, 43 Mice were anesthetized with a solution of 5 mg/kg Xylazine and 100 mg/kg Ketamine via intraperitoneal (IP) injection. Mice were given an analgesic dose of flunixin meglumine (FluMegluine, Clipper Distribution Company) and then placed in a stereotaxic apparatus (David Kopf Instruments). A 26-gauge cannula (PlasticsOne, Roanoke, VA; CAT #8IC315GS4SPC) was placed into a lateral cerebral ventricle of the brain. The brain coordinates were 1.0 mm lateral, 46 mm posterior to bregma, and 2.3 mm ventral to the skull and secured by with dental cement (C&B Metabond Adhesive Cement Kit #S380) and Lang’s Jet Dental Repair Kit (Jet Denture Repair Powder, #1220; Jet Liquid #1403). Mice were given 0.5 mL of 0.9% saline (Hospira; Lake Forrest, IL) subcutaneous (SQ) immediately post-operation and then flunixin for 3 days after surgery. After 7 days of recovery, proper cannula placement into the lateral ventricle was validated by administering intracerebroventricular (ICV) human (h)PYY(3−36) (Cat #H8585; Bachem) at a concentration of 2.5 μg/2.0 μL 2 h prior to onset of the dark cycle as previously described.10–12, 20, 22, 23 Food intake and mouse weight were recorded at 2, 4, and 6 h after treatment. Proper cannula placement was determined when a mouse ate ≥0.8 g more food when injected with hPYY as compared to when they were treated with vehicle control. Mice that did not meet this criterion were excluded from the study. All mice in this study (with the exception of the naïve mice) underwent cannulation surgery as a control variable, and vehicle or compound was administered via ICV or IT administration as indicated.
Mouse Metabolic Feeding Studies.
Male mice with validated cannula placement were housed for 2 weeks into TSE PhenoMaster metabolic cages (TSE Systems, Berlin Germany) to acclimate to the new cage environment. All experiments in the TSE PhenoMaster metabolic cages were conducted during a nocturnal nonfasting paradigm and were of crossover design. Intrathecal injections were administered as previously reported.36, 82, 83 Compound or vehicle controls were administered (IT or ICV) in a single dose at 2 h before the initiation of the dark cycle (t = 0 h). Intracerebroventricular compound and vehicle were administered at a rate of 1 μL per minute, while IT ligands were administered instantaneously. The TSE PhenoMaster system recorded food intake, water intake, oxygen uptake, carbon dioxide production, and ambulatory locomotor activity. Energy expenditure (EE) and respiratory exchange ratio (RER) were calculated by the TSE PhenoMaster system using the oxygen uptake and carbon dioxide production values. Energy expenditure is a parameter used to examine energy consumption and is calculated by taking the number of kilocalories burned by the mouse per hour and normalizing it to the mouse’s weight (kcal/h/kg). Respiratory exchange ratio was determined by dividing the volume of carbon dioxide by the oxygen consumed by the mouse in the metabolic cages.38, 39 A week prior to experiment (after acclimation), naïve metabolic data was collected with no treatment. In the first cohort (MDE6-5-2c IT and ICV dose response curves), mice were separated into four groups (Figure 1A). Two groups were labeled for ICV injections and two were labeled for IT injections. On the first day of experimentation, half of these mice were administered 2 nmol MDE6-5-2c while the other half received vehicle control. Compounds were then switched on the second day of experimentation. The experiment was repeated to test 10 nmol MDE6-5-2c. This data was added to the 5 nmol MDE6-5-2c data (seen next in cohort 2) with no significant difference seen between control groups to create a dose-response graph. In the second cohort (the 5 nmol MDE6-5-2c IT vs. ICV comparison study), mice were divided into 4 groups (n = 3 to 4 per group; n = 15 total for IT administration, n = 14 total for ICV administration) and given a single dose of 5 nmol/mouse MDE6-5-2c via IT or ICV administration (Fig. 1B). This process was repeated 3 more times so that each single mouse received all four different treatments (saline, compound, IT, and ICV routes of administration). The ICV data was excluded from one mouse because it was determined to have a blocked cannula.
Mouse Body Composition.
In the third cohort, male age-matched mice were organized in a randomized block design and housed in standard polycarbonate conventional cages provided by the University of Minnesota’s Research Animal Resources (RAR) in a reverse light-dark cycle room (lights off 12 pm). This third cohort was used for both body composition analysis and plasma collection for hormone Milliplex assays (Figure 1C). Food intake and body weight were measured manually using a standard laboratory scale balance (Sartorius Quintix 512–1s, Bohemia, New York) at time points 0 h (baseline), 2 h, 4 h, and 6 h after treatment. Single injections (IT or ICV) were given to each mouse 2 h prior to lights out. Body composition (fat and lean mass) was analyzed at baseline (t = 0 h) and 6 h after treatment in an EchoMRI-100H™ (Echo Medical Systems LLC, Houston TX, USA). Fat body mass percentage and lean body mass percentage were calculated by taking the fat or lean mass and dividing it by the mouse body weight, then multiplying by 100 (n=4).
Plasma Collection and Magpix Hormone Panel.
Prior to plasma collection, a variety of blood enzyme inhibitors were added to the 1.5 mL EDTA-K2 coated collection tubes (Milian, USA) to prevent hormone degradation. These include the enzyme inhibitors DPPIV (10 μL/mL of whole blood; Cat. No. DPP4, EMD Millipore Corporation, Billerica, MA), Pefabloc/AEBSF (1 mg/mL of whole blood; Product No. 11873601001, Roche, Indianapolis, IN), Protease Inhibitor Cocktail (10 μL/mL of whole blood; Part No. P8340, Sigma-Aldrich, St. Louis, MO), and Aprotinin (500 KIU/ML of whole blood; Part No. A6279, Sigma-Aldrich, Indianapolis, IN). During Cohort 3, trunk blood plasma was collected 6 h after injection using 1.5 mL EDTA-K2 coated tubes (Milian, USA) and was placed on ice. Trunk blood was collected from the group of naïve, age-matched mice (n=5) at the same time of day to use in the hormone panel for comparative purposes. The average amount of total whole blood collected per tube was 500 μL. The whole blood samples were spun at 10,000 rpm for 10 min at 4 °C. Plasma was collected from the supernatant and samples were frozen at −20 °C until thawed once on the day of Milliplex experiments to prevent biomarker degradation due to multiple freeze/thawing periods. Plasma hormone levels were measured in 10 μL duplicates using MILLIPLEX® MAP mouse metabolic hormone magnetic bead panel multiplex assay kit (Cat. No. MMHMAG-44K, EMD Millipore Corporation, Billerica, MA now known as MilliporeSigma, Merck KGaA, Darmstadt, Germany). Hormone plasma concentrations were obtained using the MAGPIX® System using MILLIPLEX® xPonent 4.2 software (Cat. No. 40–072, EMD Millipore Corporation, Billerica, MA now known as MilliporeSigma, Merck KGaA, Darmstadt, Germany).
Compounds.
Human PYY (cat# H8585; Bachem) was prepared from a stock solution using sterile ddH2O to make a final concentration of 10 μg/μL and then stored at −20 °C. For the cannula validation experiments, the hPYY 10 μg/μL stock solution was thawed and further diluted with sterile 0.9% saline (Hospira; Lake Forest, IL) to a concentration of 2.5 μg/2 μL (0.1 mg/kg). The MDE6-5-2c peptide was synthesized by using Fmoc based solid phase peptide synthesis (SPPS) as previously reported.22, 33 Compound MDE6-5-2c was purified to ≥95% by RP-HPLC and the correct mass was confirmed by ESI-MS (University of Minnesota Department of Chemistry Mass Spectrometry Laboratory). The MDE6-5-2c peptide was dissolved into a stock solution of 10−2 M using ddH2O and DMSO (at <3%) and stored at −20 °C. On the days of experimentation, the MDE6-5-2c stock solution was thawed and diluted with sterile 0.9% saline to the indicated concentration. Intracerebroventricular injections were at concentrations of either 2 nmol/3 μL, 5 nmol/3 μL, or 10 nmol/3 μL depending on the day of experiment. Vehicle was prepared for ICV administration with the same ratio of ddH2O and DMSO compared to MDE6-5-2c ICV counterparts in which final DMSO concentration was calculated to be <0.5%. Mice treated via IT administration were injected with the concentrations of 2 nmol/5 μL, 5 nmol/5 μL, or 10 nmol/5 μL. Similarly, vehicle was prepared for IT treatment with the same ratio of DMSO and ddH2O compared to MDE6-5-2c IT counterparts in which final DMSO concentration was estimated to be <0.1%. All MDE6-5-2c used in this experiment came from the same synthesis batch.
Data Analysis.
The primary independent variables were as follows: (i) routes of administration (IT or ICV); (ii) food intake; (iii) mouse body weight; (iv) water intake; (v) locomotor activity; (vi) respiratory exchange ratio; (vii) energy expenditure; (viii) C-peptide hormone plasma levels; (ix) ghrelin hormone plasma levels; (x) gastric inhibitory polypeptide (GIP) hormone plasma levels; (xi) interleukin 6 (IL-6) hormone plasma levels; (xii) leptin hormone plasma levels; (xiii) resistin hormone plasma levels; (xiv) fat mass percentage; and (xv) lean mass percentage. A two-factor within-subject analysis of variance (ANOVA) was applied to examine metabolic parameters in this study. The between-session variables were administration route (IT versus ICV) and compound (vehicle control or MDE6-5-2c) while the within-subject variable was time. Follow-up independent sample t-tests with Bonferroni correction were used to identify specific time points that have sources of significance. Hormone plasma measurements were analyzed using a one-way ANOVA with between-subject variables of administration and compound. Follow-up independent t-tests with Bonferroni correction were used to examine significance between groups separated by compound and route of administration. Statistical analysis was performed using the using Statistical Package for the Social Science Software (SPSS Version 24; IBM, Ireland). Data is represented as the mean ± standard error of the mean (SEM) with p < 0.05 indicating significance (comprehensive statistical analysis of these variables is provided in the Supporting Information).
Supplementary Material
Funding:
These experiments were funded by the National Institute of Health through R01DK091906 (C.H.-L.) and the F32DK108402 Postdoctoral Fellowship (M.D.E).
Abbreviations:
- GPCR
G protein-coupled receptor
- ICV
intracerebroventricular
- IT
intrathecal
- MC1R
melanocortin 1 receptor
- MC3R
melanocortin 3 receptor
- MC4R
melanocortin 4 receptor
- MC5R
melanocortin 5 receptor
- CNS
central nervous system
- PNS
peripheral nervous system
- RER
respiratory exchange ratio
- EE
energy expenditure
- GIP
gastric inhibitory polypeptide or glucose-dependent insulinotropic polypeptide
- IL-6
interleukin-6
- EDTA
ethylenediamine tetra-acetic acid
- DPPIV
dipeptidyl peptidase-4
- DMSO
dimethyl sulfoxide
- ANOVA
analysis of variance
Footnotes
The authors declare no competing financial interest.
SUPPORTING INFORMATION
The Supporting Information is available free of charge at https://pubs.acs.org/doi/10.1021/acschemneuro.0c00409
Statistical analysis details for all the experiments performed in this manuscript. A summary figure of acute food intake, lean, and fat mass data on the day of the plasma biomarker blood collection experiment. A summary figure of cumulative food intake data for up to 72 hours post dose-response MDE6-5-2c versus vehicle control treatment. Summary figures comparing cumulative food intake of non-treated mice versus vehicle treated ICV or IT routes of administration.
References
- 1.Hales CM, Carroll MD, Fryar CD, and Ogden CL (2017) Prevalence of obesity among adults and youth: United States, 2015–2016. NCHS Data Brief, 1–8. [PubMed] [Google Scholar]
- 2.Roselli-Rehfuss L, Mountjoy KG, Robbins LS, Mortrud MT, Low MJ, Tatro JB, Entwistle ML, Simerly RB, and Cone RD (1993) Identification of a receptor for γ melanotropin and other proopiomelanocortin peptides in the hypothalamus and limbic system. Proc. Natl. Acad. Sci. U. S. A 90, 8856–8860. [DOI] [PMC free article] [PubMed] [Google Scholar]
- 3.Mountjoy KG, Robbins LS, Mortrud MT, and Cone RD (1992) The cloning of a family of genes that encode the melanocortin receptors. Science 257, 1248–1251. [DOI] [PubMed] [Google Scholar]
- 4.Griffon N, Mignon V, Facchinetti P, Diaz J, Schwartz JC, and Sokoloff P (1994) Molecular cloning and characterization of the rat fifth melanocortin receptor. Biochem. Biophys. Res. Commun 200, 1007–1014. [DOI] [PubMed] [Google Scholar]
- 5.Gantz I, Shimoto Y, Konda Y, Miwa H, Dickinson CJ, and Yamada T (1994) Molecular cloning, expression, and characterization of a fifth melanocortin receptor. Biochem. Biophys. Res. Commun 200, 1214–1220. [DOI] [PubMed] [Google Scholar]
- 6.Gantz I, Miwa H, Konda Y, Shimoto Y, Tashiro T, Watson SJ, DelValle J, and Yamada T (1993) Molecular cloning, expression, and gene localization of a fourth melanocortin receptor. J. Biol. Chem 268, 15174–15179. [PubMed] [Google Scholar]
- 7.Gantz I, Konda Y, Tashiro T, Shimoto Y, Miwa H, Munzert G, Watson SJ, DelValle J, and Yamada T (1993) Molecular cloning of a novel melanocortin receptor. J. Biol. Chem 268, 8246–8250. [PubMed] [Google Scholar]
- 8.Chhajlani V, and Wikberg JE (1992) Molecular cloning and expression of the human melanocyte stimulating hormone receptor cDNA. FEBS Lett. 309, 417–420. [DOI] [PubMed] [Google Scholar]
- 9.Chhajlani V, Muceniece R, and Wikberg JE (1993) Molecular cloning of a novel human melanocortin receptor. Biochem. Biophys. Res. Commun 195, 866–873. [DOI] [PubMed] [Google Scholar]
- 10.Adank DN, Lunzer MM, Lensing CJ, Wilber SL, Gancarz AM, and Haskell-Luevano C (2018) Comparative in vivo investigation of intrathecal and intracerebroventricular administration with melanocortin ligands MTII and AGRP into mice. ACS Chem. Neurosci 9, 320–327. [DOI] [PMC free article] [PubMed] [Google Scholar]
- 11.Lensing CJ, Adank DN, Doering SR, Wilber SL, Andreasen A, Schaub JW, Xiang ZM, and Haskell-Luevano C (2016) Ac-Trp-DPhe(p-l)-Arg-Trp-NH2, a 250-fold selective melanocortin-4 receptor (MC4R) antagonist over the melanocortin-3 receptor (MC3R), affects energy homeostasis in male and female mice differently. ACS Chem. Neurosci 7, 1283–1291. [DOI] [PMC free article] [PubMed] [Google Scholar]
- 12.Lensing CJ, Adank DN, Wilber SL, Freeman KT, Schnell SM, Speth RC, Zarth AT, and Haskell-Luevano C (2017) A direct in vivo comparison of the melanocortin monovalent agonist Ac-His-DPhe-Arg-Trp-NH2 versus the bivalent agonist Ac-His-DPhe-Arg-Trp-PEDG20-His-DPhe-Arg-Trp-NH2: A bivalent advantage. ACS Chem. Neurosci 8, 1262–1278. [DOI] [PMC free article] [PubMed] [Google Scholar]
- 13.Uckert S, Bannowsky A, Albrecht K, and Kuczyk MA (2014) Melanocortin receptor agonists in the treatment of male and female sexual dysfunctions: Results from basic research and clinical studies. Expert Opin. Invest. Drugs 23, 1477–1483. [DOI] [PubMed] [Google Scholar]
- 14.Van der Ploeg LHT, Martin WJ, Howard AD, Nargund RP, Austin CP, Guan XM, Drisko J, Cashen D, Sebhat I, Patchett AA, Figueroa DJ, DiLella AG, Connolly BM, Weinberg DH, Tan CP, Palyha OC, Pong SS, MacNeil T, Rosenblum C, Vongs A, Tang R, Yu H, Sailer AW, Fong TM, Huang C, Tota MR, Chang RS, Stearns R, Tamvakopoulos C, Christ G, Drazen DL, Spar BD, Nelson RJ, and MacIntyre DE (2002) A role for the melanocortin 4 receptor in sexual function. Proc. Natl. Acad. Sci. U. S. A 99, 11381–11386. [DOI] [PMC free article] [PubMed] [Google Scholar]
- 15.Haynes RC Jr., and Berthet L (1957) Studies on the mechanism of action of the adrenocorticotropic hormone. J. Biol. Chem 225, 115–124. [PubMed] [Google Scholar]
- 16.Greenfield JR, Miller JW, Keogh JM, Henning E, Satterwhite JH, Cameron GS, Astruc B, Mayer JP, Brage S, See TC, Lomas DJ, O’Rahilly S, and Farooqi IS (2009) Modulation of blood pressure by central melanocortinergic pathways. N. Engl. J. Med 360, 44–52. [DOI] [PubMed] [Google Scholar]
- 17.Maranon RO, Lima R, Mathbout M, do Carmo JM, Hall JE, Roman RJ, and Reckelhoff JF (2014) Postmenopausal hypertension: Role of the sympathetic nervous system in an animal model. Am. J. Physiol.: Regul., Integr. Comp. Physiol 306, R248–R256. [DOI] [PMC free article] [PubMed] [Google Scholar]
- 18.Fan W, Boston BA, Kesterson RA, Hruby VJ, and Cone RD (1997) Role of melanocortinergic neurons in feeding and the agouti obesity syndrome. Nature 385, 165–168. [DOI] [PubMed] [Google Scholar]
- 19.Huszar D, Lynch CA, Fairchild-Huntress V, Dunmore JH, Fang Q, Berkemeier LR, Gu W, Kesterson RA, Boston BA, Cone RD, Smith FJ, Campfield LA, Burn P, and Lee F (1997) Targeted disruption of the melanocortin-4 receptor results in obesity in mice. Cell 88, 131–141. [DOI] [PubMed] [Google Scholar]
- 20.Irani BG, Xiang ZM, Yarandi HN, Holder JR, Moore MC, Bauzo RM, Proneth B, Shaw AM, Millard WJ, Chambers JB, Benoit SC, Clegg DJ, and Haskell-Luevano C (2011) Implication of the melanocortin-3 receptor in the regulation of food intake. Eur. J. Pharmacol 660, 80–87. [DOI] [PMC free article] [PubMed] [Google Scholar]
- 21.Joppa MA, Ling N, Chen C, Gogas KR, Foster AC, and Markison S (2005) Central administration of peptide and small molecule MC4 receptor antagonists induce hyperphagia in mice and attenuate cytokine-induced anorexia. Peptides 26, 2294–2301. [DOI] [PubMed] [Google Scholar]
- 22.Lensing CJ, Freeman KT, Schnell SM, Adank DN, Speth RC, and Haskell-Luevano C (2016) An in vitro and in vivo investigation of bivalent ligands that display preferential binding and functional activity for different melanocortin receptor homodimers. J. Med. Chem 59, 3112–3128. [DOI] [PMC free article] [PubMed] [Google Scholar]
- 23.Marsh DJ, Hollopeter G, Huszar D, Laufer R, Yagaloff KA, Fisher SL, Burn P, and Palmiter RD (1999) Response of melanocortin-4 receptor-deficient mice to anorectic and orexigenic peptides. Nat. Genet 21, 119–122. [DOI] [PubMed] [Google Scholar]
- 24.Nakanishi S, Inoue A, Kita T, Nakamura M, Chang AC, Cohen SN, and Numa S (1979) Nucleotide sequence of cloned cDNA for bovine corticotropin-β-lipotropin precursor. Nature 278, 423–427. [DOI] [PubMed] [Google Scholar]
- 25.Yang YK, Thompson DA, Dickinson CJ, Wilken J, Barsh GS, Kent SBH, and Gantz I (1999) Characterization of agouti-related protein binding to melanocortin receptors. Mol. Endocrinol 13, 148–155. [DOI] [PubMed] [Google Scholar]
- 26.Ollmann MM, Wilson BD, Yang YK, Kerns JA, Chen YR, Gantz I, and Barsh GS (1997) Antagonism of central melanocortin receptors in vitro and in vivo by agouti-related protein. Science 278, 135–138. [DOI] [PubMed] [Google Scholar]
- 27.Lu D, Willard D, Patel IR, Kadwell S, Overton L, Kost T, Luther M, Chen W, Woychik RP, Wilkison WO, and Cone RD (1994) Agouti protein is an antagonist of the melanocyte-stimulating-hormone receptor. Nature 371, 799–802. [DOI] [PubMed] [Google Scholar]
- 28.Brown KS, Gentry RM, and Rowland NE (1998) Central injection in rats of α-melanocyte-stimulating hormone analog: Effects on food intake and brain Fos. Regul. Pept 78, 89–94. [DOI] [PubMed] [Google Scholar]
- 29.Poggioli R, Vergoni AV, and Bertolini A (1986) ACTH-(1–24) and α-MSH antagonize feeding behavior stimulated by kappa opiate agonists. Peptides 7, 843–848. [DOI] [PubMed] [Google Scholar]
- 30.Marsh DJ, Miura GI, Yagaloff KA, Schwartz MW, Barsh GS, and Palmiter RD (1999) Effects of neuropeptide Y deficiency on hypothalamic agouti-related protein expression and responsiveness to melanocortin analogues. Brain Res. 848, 66–77. [DOI] [PubMed] [Google Scholar]
- 31.Dorr RT, Lines R, Levine N, Brooks C, Xiang L, Hruby VJ, and Hadley ME (1996) Evaluation of melanotan-II, a superpotent cyclic melanotropic peptide in a pilot phase-I clinical study. Life Sci. 58, 1777–1784. [DOI] [PubMed] [Google Scholar]
- 32.Ericson MD, Wilczynski A, Sorensen NB, Xiang ZM, and Haskell-Luevano C (2015) Discovery of a β-hairpin octapeptide, c[Pro-Arg-Phe-Phe-Dap-Ala-Phe-DPro], mimetic of agouti-related protein(87–132) [AGRP(87–132)] with equipotent mouse melanocortin-4 receptor (mMC4R) antagonist pharmacology. J. Med. Chem 58, 4638–4647. [DOI] [PMC free article] [PubMed] [Google Scholar]
- 33.Ericson MD, Freeman KT, Schnell SM, and Haskell-Luevano C (2017) A macrocyclic agouti-related protein/[Nle4,DPhe7]α-melanocyte stimulating hormone chimeric scaffold produces subnanomolar melanocortin receptor ligands. J. Med. Chem 60, 805–813. [DOI] [PMC free article] [PubMed] [Google Scholar]
- 34.Fleming KA, Freeman KT, Ericson MD, and Haskell-Luevano C (2018) Synergistic multiresidue substitutions of a macrocyclic c[Pro-Arg-Phe-Phe-Asn-Ala-Phe-DPro] agouti-related protein (AGRP) scaffold yield potent and >600-fold MC4R versus MC3R selective melanocortin receptor antagonists. J. Med. Chem 61, 7729–7740. [DOI] [PMC free article] [PubMed] [Google Scholar]
- 35.Kuo A, and Smith MT (2014) Theoretical and practical applications of the intracerebroventricular route for CSF sampling and drug administration in CNS drug discovery research: A mini review. J. Neurosci. Methods 233, 166–171. [DOI] [PubMed] [Google Scholar]
- 36.Hylden JLK, and Wilcox GL (1980) Intrathecal morphine in mice: a new technique. Eur. J. Pharmacol 67, 313–316. [DOI] [PubMed] [Google Scholar]
- 37.Sohn JW, Harris LE, Berglund ED, Liu T, Vong L, Lowell BB, Balthasar N, Williams KW, and Elmquist JK (2013) Melanocortin 4 receptors reciprocally regulate sympathetic and parasympathetic preganglionic neurons. Cell 152, 612–619. [DOI] [PMC free article] [PubMed] [Google Scholar]
- 38.Meyer CW, Reitmeir P, and Tschop MH (2015) Exploration of energy metabolism in the mouse using indirect calorimetry: Measurement of daily energy expenditure (DEE) and basal metabolic rate (BMR). Curr. Protoc. Mouse Biol 5, 205–222. [DOI] [PubMed] [Google Scholar]
- 39.Speakman JR (2013) Measuring energy metabolism in the mouse - theoretical, practical, and analytical considerations. Front. Physiol 4, 34. [DOI] [PMC free article] [PubMed] [Google Scholar]
- 40.Goodin SZ, Keichler AR, Smith M, Wendt D, and Strader AD (2008) Effect of gonadectomy on AGRP-induced weight gain in rats. Am. J. Physiol.: Regul., Integr. Comp. Physiol 295, R1747–R1753. [DOI] [PubMed] [Google Scholar]
- 41.Kooijman S, Boon MR, Parlevliet ET, Geerling JJ, van de Pol V, Romijn JA, Havekes LM, Meurs I, and Rensen PC (2014) Inhibition of the central melanocortin system decreases brown adipose tissue activity. J. Lipid Res 55, 2022–2032. [DOI] [PMC free article] [PubMed] [Google Scholar]
- 42.Bonsall DR, Kim H, Tocci C, Ndiaye A, Petronzio A, McKay-Corkum G, Molyneux PC, Scammell TE, and Harrington ME (2015) Suppression of locomotor activity in female C57Bl/6J mice treated with interleukin-1β: Investigating a method for the study of fatigue in laboratory animals. PLoS One 10, e0140678. [DOI] [PMC free article] [PubMed] [Google Scholar]
- 43.Chen AS, Metzger JM, Trumbauer ME, Guan XM, Yu H, Frazier EG, Marsh DJ, Forrest MJ, Gopal-Truter S, Fisher J, Camacho RE, Strack AM, Mellin TN, MacIntyre DE, Chen HY, and Van der Ploeg LH (2000) Role of the melanocortin-4 receptor in metabolic rate and food intake in mice. Transgenic Res. 9, 145–154. [DOI] [PubMed] [Google Scholar]
- 44.Kublaoui BM, Holder JL Jr., Gemelli T, and Zinn AR (2006) Sim1 haploinsufficiency impairs melanocortin-mediated anorexia and activation of paraventricular nucleus neurons. Mol. Endocrinol 20, 2483–2492. [DOI] [PubMed] [Google Scholar]
- 45.Jones AG, and Hattersley AT (2013) The clinical utility of C-peptide measurement in the care of patients with diabetes. Diabetic Med. 30, 803–817. [DOI] [PMC free article] [PubMed] [Google Scholar]
- 46.Rubenstein AH, Clark JL, Melani F, and Steiner DF (1969) Secretion of proinsulin C-peptide by pancreatic β cells and its circulation in blood. Nature 224, 697–699. [Google Scholar]
- 47.Steiner DF, Cunningham D, Spigelman L, and Aten B (1967) Insulin biosynthesis: Evidence for a precursor. Science 157, 697–700. [DOI] [PubMed] [Google Scholar]
- 48.Fan W, Dinulescu DM, Butler AA, Zhou J, Marks DL, and Cone RD (2000) The central melanocortin system can directly regulate serum insulin levels. Endocrinology 141, 3072–3079. [DOI] [PubMed] [Google Scholar]
- 49.Obici S, Feng Z, Tan J, Liu L, Karkanias G, and Rossetti L (2001) Central melanocortin receptors regulate insulin action. J. Clin. Invest 108, 1079–1085. [DOI] [PMC free article] [PubMed] [Google Scholar]
- 50.Pierroz DD, Ziotopoulou M, Ungsunan L, Moschos S, Flier JS, and Mantzoros CS (2002) Effects of acute and chronic administration of the melanocortin agonist MTII in mice with diet-induced obesity. Diabetes 51, 1337–1345. [DOI] [PubMed] [Google Scholar]
- 51.Pradhan AD, Manson JE, Rifai N, Buring JE, and Ridker PM (2001) C-Reactive protein, interleukin 6, and risk of developing type 2 diabetes mellitus. J. Am. Med. Assoc 286, 327–334. [DOI] [PubMed] [Google Scholar]
- 52.Castell JV, Gomez-Lechon MJ, David M, Andus T, Geiger T, Trullenque R, Fabra R, and Heinrich PC (1989) Interleukin-6 is the major regulator of acute phase protein synthesis in adult human hepatocytes. FEBS Lett. 242, 237–239. [DOI] [PubMed] [Google Scholar]
- 53.Bohm M, Apel M, Sugawara K, Brehler R, Jurk K, Luger TA, Haas H, Paus R, Eiz-Vesper B, Walls AF, Ponimaskin E, Gehring M, Kapp A, and Raap U (2012) Modulation of basophil activity: A novel function of the neuropeptide α-melanocyte-stimulating hormone. J. Allergy Clin. Immunol 129, 1085–1093. [DOI] [PubMed] [Google Scholar]
- 54.Huang QH, Hruby VJ, and Tatro JB (1998) Systemic α-MSH suppresses LPS fever via central melanocortin receptors independently of its suppression of corticosterone and IL-6 release. Am. J. Physiol 275, R524–R530. [DOI] [PubMed] [Google Scholar]
- 55.Ottani A, Neri L, Canalini F, Calevro A, Rossi R, Cappelli G, Ballestri M, Giuliani D, and Guarini S (2014) Protective effects of the melanocortin analog NDP-α-MSH in rats undergoing cardiac arrest. Eur. J. Pharmacol 745, 108–116. [DOI] [PubMed] [Google Scholar]
- 56.Jun DJ, Na KY, Kim W, Kwak D, Kwon EJ, Yoon JH, Yea K, Lee H, Kim J, Suh PG, Ryu SH, and Kim KT (2010) Melanocortins induce interleukin 6 gene expression and secretion through melanocortin receptors 2 and 5 in 3T3-L1 adipocytes. J. Mol. Endocrinol 44, 225–236. [DOI] [PMC free article] [PubMed] [Google Scholar]
- 57.Engelstoft MS, Park WM, Sakata I, Kristensen LV, Husted AS, Osborne-Lawrence S, Piper PK, Walker AK, Pedersen MH, Nohr MK, Pan J, Sinz CJ, Carrington PE, Akiyama TE, Jones RM, Tang C, Ahmed K, Offermanns S, Egerod KL, Zigman JM, and Schwartz TW (2013) Seven transmembrane G protein-coupled receptor repertoire of gastric ghrelin cells. Mol. Metab 2, 376–392. [DOI] [PMC free article] [PubMed] [Google Scholar]
- 58.Shaw AM, Irani BG, Moore MC, Haskell-Luevano C, and Millard WJ (2005) Ghrelin-induced food intake and growth hormone secretion are altered in melanocortin 3 and 4 receptor knockout mice. Peptides 26, 1720–1727. [DOI] [PubMed] [Google Scholar]
- 59.Maffei M, Halaas J, Ravussin E, Pratley RE, Lee GH, Zhang Y, Fei H, Kim S, Lallone R, Ranganathan S, Kern PA, and Friedman JM (1995) Leptin levels in human and rodent: Measurement of plasma leptin and ob RNA in obese and weight-reduced subjects. Nat. Med 1, 1155–1161. [DOI] [PubMed] [Google Scholar]
- 60.Morton GJ, Blevins JE, Williams DL, Niswender KD, Gelling RW, Rhodes CJ, Baskin DG, and Schwartz MW (2005) Leptin action in the forebrain regulates the hindbrain response to satiety signals. J. Clin. Invest 115, 703–710. [DOI] [PMC free article] [PubMed] [Google Scholar]
- 61.Kristensen P, Judge ME, Thim L, Ribel U, Christjansen KN, Wulff BS, Clausen JT, Jensen PB, Madsen OD, Vrang N, Larsen PJ, and Hastrup S (1998) Hypothalamic CART is a new anorectic peptide regulated by leptin. Nature 393, 72–76. [DOI] [PubMed] [Google Scholar]
- 62.Caro JF, Kolaczynski JW, Nyce MR, Ohannesian JP, Opentanova I, Goldman WH, Lynn RB, Zhang PL, Sinha MK, and Considine RV (1996) Decreased cerebrospinal-fluid/serum leptin ratio in obesity: A possible mechanism for leptin resistance. Lancet 348, 159–161. [DOI] [PubMed] [Google Scholar]
- 63.Bjorbaek C, Elmquist JK, Frantz JD, Shoelson SE, and Flier JS (1998) Identification of SOCS-3 as a potential mediator of central leptin resistance. Mol. Cell 1, 619–625. [DOI] [PubMed] [Google Scholar]
- 64.Yip RG, Boylan MO, Kieffer TJ, and Wolfe MM (1998) Functional GIP receptors are present on adipocytes. Endocrinology 139, 4004–4007. [DOI] [PubMed] [Google Scholar]
- 65.Dupre J, and Beck JC (1966) Stimulation of release of insulin by an extract of intestinal mucosa. Diabetes 15, 555–559. [DOI] [PubMed] [Google Scholar]
- 66.Dupre J, Ross SA, Watson D, and Brown JC (1973) Stimulation of insulin secretion by gastric inhibitory polypeptide in man. J. Clin. Endocrinol. Metab 37, 826–828. [DOI] [PubMed] [Google Scholar]
- 67.Nauck MA, Heimesaat MM, Orskov C, Holst JJ, Ebert R, and Creutzfeldt W (1993) Preserved incretin activity of glucagon-like peptide 1 [7–36 amide] but not of synthetic human gastric inhibitory polypeptide in patients with type-2 diabetes mellitus. J. Clin. Invest 91, 301–307. [DOI] [PMC free article] [PubMed] [Google Scholar]
- 68.Bailey CJ, Flatt PR, Kwasowski P, Powell CJ, and Marks V (1986) Immunoreactive gastric inhibitory polypeptide and K cell hyperplasia in obese hyperglycaemic (ob/ob) mice fed high fat and high carbohydrate cafeteria diets. Acta Endocrinol. 112, 224–229. [DOI] [PubMed] [Google Scholar]
- 69.Flatt PR, Bailey CJ, Kwasowski P, Swanston-Flatt SK, and Marks V (1983) Abnormalities of GIP in spontaneous syndromes of obesity and diabetes in mice. Diabetes 32, 433–435. [DOI] [PubMed] [Google Scholar]
- 70.Jones IR, Owens DR, Moody AJ, Luzio SD, Morris T, and Hayes TM (1987) The effects of glucose-dependent insulinotropic polypeptide infused at physiological concentrations in normal subjects and type 2 (non-insulin-dependent) diabetic patients on glucose tolerance and B-cell secretion. Diabetologia 30, 707–712. [DOI] [PubMed] [Google Scholar]
- 71.Krarup T, Saurbrey N, Moody AJ, Kuhl C, and Madsbad S (1987) Effect of porcine gastric inhibitory polypeptide on β-cell function in type I and type II diabetes mellitus. Metab., Clin. Exp 36, 677–682. [DOI] [PubMed] [Google Scholar]
- 72.Panaro BL, Tough IR, Engelstoft MS, Matthews RT, Digby GJ, Moller CL, Svendsen B, Gribble F, Reimann F, Holst JJ, Holst B, Schwartz TW, Cox HM, and Cone RD (2014) The melanocortin-4 receptor is expressed in enteroendocrine L cells and regulates the release of peptide YY and glucagon-like peptide 1 in vivo. Cell Metab. 20, 1018–1029. [DOI] [PMC free article] [PubMed] [Google Scholar]
- 73.Steppan CM, Bailey ST, Bhat S, Brown EJ, Banerjee RR, Wright CM, Patel HR, Ahima RS, and Lazar MA (2001) The hormone resistin links obesity to diabetes. Nature 409, 307–312. [DOI] [PubMed] [Google Scholar]
- 74.Lee JH, Bullen JW Jr., Stoyneva VL, and Mantzoros CS (2005) Circulating resistin in lean, obese, and insulin-resistant mouse models: Lack of association with insulinemia and glycemia. Am. J. Physiol.: Endocrinol. Metab 288, E625–E632. [DOI] [PubMed] [Google Scholar]
- 75.Lin J, Choi YH, Hartzell DL, Li C, Della-Fera MA, and Baile CA (2003) CNS melanocortin and leptin effects on stearoyl-CoA desaturase-1 and resistin expression. Biochem. Biophys. Res. Commun 311, 324–328. [DOI] [PubMed] [Google Scholar]
- 76.Haskell-Luevano C, Schaub JW, Andreasen A, Haskell KR, Moore MC, Koerper LM, Rouzaud F, Baker HV, Millard WJ, Walter G, Litherland SA, and Xiang Z (2009) Voluntary exercise prevents the obese and diabetic metabolic syndrome of the melanocortin-4 receptor knockout mouse. FASEB J. 23, 642–655. [DOI] [PMC free article] [PubMed] [Google Scholar]
- 77.Nakahara K, Okame R, Katayama T, Miyazato M, Kangawa K, and Murakami N (2010) Nutritional and environmental factors affecting plasma ghrelin and leptin levels in rats. J. Endocrinol 207, 95–103. [DOI] [PubMed] [Google Scholar]
- 78.Macedo IC, Medeiros LF, Oliveira C, Oliveira CM, Rozisky JR, Scarabelot VL, Souza A, Silva FR, Santos VS, Cioato SG, Caumo W, and Torres IL (2012) Cafeteria diet-induced obesity plus chronic stress alter serum leptin levels. Peptides 38, 189–196. [DOI] [PubMed] [Google Scholar]
- 79.Heiman ML, Ahima RS, Craft LS, Schoner B, Stephens TW, and Flier JS (1997) Leptin inhibition of the hypothalamic-pituitary-adrenal axis in response to stress. Endocrinology 138, 3859–3863. [DOI] [PubMed] [Google Scholar]
- 80.Sandoval DA, and Davis SN (2003) Leptin: Metabolic control and regulation. J. Diabetes Complications 17, 108–113. [DOI] [PubMed] [Google Scholar]
- 81.Rowland NE, Schaub JW, Robertson KL, Andreasen A, and Haskell-Luevano C (2010) Effect of MTII on food intake and brain c-Fos in melanocortin-3, melanocortin-4, and double MC3 and MC4 receptor knockout mice. Peptides 31, 2314–2317. [DOI] [PMC free article] [PubMed] [Google Scholar]
- 82.Le Naour M, Lunzer MM, Powers MD, and Portoghese PS (2012) Opioid activity of spinally selective analogues of N-naphthoyl-β-naltrexamine in HEK-293 cells and mice. J. Med. Chem 55, 670–677. [DOI] [PMC free article] [PubMed] [Google Scholar]
- 83.Lunzer MM, and Portoghese PS (2007) Selectivity of δ- and κ-opioid ligands depends on the route of central administration in mice. J. Pharmacol. Exp. Ther 322, 166–171. [DOI] [PubMed] [Google Scholar]
Associated Data
This section collects any data citations, data availability statements, or supplementary materials included in this article.