

Abstract
Rationale: A novel model of phenotypes based on set thresholds of respiratory system compliance (Crs) was recently postulated in context of coronavirus disease (COVID-19) acute respiratory distress syndrome (ARDS). In particular, the dissociation between the degree of hypoxemia and Crs was characterized as a distinct ARDS phenotype.
Objectives: To determine whether such Crs-based phenotypes existed among patients with ARDS before the COVID-19 pandemic and to closely examine the Crs–mortality relationship.
Methods: We undertook a secondary analysis of patients with ARDS, who were invasively ventilated on controlled modes and enrolled in a large, multinational, epidemiological study. We assessed Crs, degree of hypoxemia, and associated Crs-based phenotypic patterns with their characteristics and outcomes.
Measurements and Main Results: Among 1,117 patients with ARDS who met inclusion criteria, the median Crs was 30 (interquartile range, 23–40) ml/cm H2O. One hundred thirty-six (12%) patients had preserved Crs (≥50 ml/cm H2O; phenotype with low elastance [“phenotype L”]), and 827 (74%) patients had poor Crs (<40 ml/cm H2O; phenotype with high elastance [“phenotype H”]). Compared with those with phenotype L, patients with phenotype H were sicker and had more comorbidities and higher hospital mortality (32% vs. 45%; P < 0.05). A near complete dissociation between PaO2/FiO2 and Crs was observed. Of 136 patients with phenotype L, 58 (43%) had a PaO2/FiO2 < 150. In a multivariable-adjusted analysis, the Crs was independently associated with hospital mortality (adjusted odds ratio per ml/cm H2O increase, 0.988; 95% confidence interval, 0.979–0.996; P = 0.005).
Conclusions: A wide range of Crs was observed in non–COVID-19 ARDS. Approximately one in eight patients had preserved Crs. PaO2/FiO2 and Crs were dissociated. Lower Crs was independently associated with higher mortality. The Crs–mortality relationship lacked a clear transition threshold.
Keywords: acute respiratory distress syndrome, phenotype, respiratory system compliance, intensive care, mechanical ventilation
At a Glance Commentary
Scientific Knowledge on the Subject
Acute respiratory distress syndrome (ARDS) is classically associated with a reduction in respiratory system compliance (Crs). A novel model of phenotypes based on set Crs thresholds was recently postulated in the context of coronavirus disease (COVID-19) ARDS. It is unclear whether such phenotypes existed among patients with ARDS before the COVID-19 pandemic.
What This Study Adds to the Field
Crs-based phenotypes could also be identified among patients with non–COVID-19 ARDS, of whom nearly one in eight had preserved Crs (phenotype with low elastance) and three in four had poor Crs (phenotype with high elastance). A significant proportion (43%) of patients with preserved Crs had moderate-to-severe hypoxemia (PaO2/FiO2 < 150). Lower Crs on the first day of ARDS was independently associated with higher mortality, and the Crs–mortality relationship lacked a clear transition point for any particular Crs threshold under 100 ml/cm H2O.
Acute respiratory distress syndrome (ARDS) is a heterogeneous syndrome with a complex pathophysiology, which involves increased pulmonary vascular permeability, increased lung weight, and loss of aerated lung tissue (1). Clinically, the underlying bilateral inflammatory lung injury seen in ARDS is typified by rapid onset of hypoxemic acute respiratory failure and reduction in the respiratory system compliance (Crs) (2). Crs may be associated with the severity of ARDS, as it grossly reflects the size of normally aerated lung volume (3) or functional lung size (4). The prognostic value of Crs in relation to mortality, however, remains uncertain (5–7). The ARDS Berlin definition taskforce considered Crs as an ancillary variable but could not include Crs in the final definition because of the lack of evidence for its predictive validity at the time (1).
Recently, on the basis of preliminary observations during the coronavirus disease (COVID-19) pandemic, it was postulated that patients with COVID-19 pneumonia, who satisfied the Berlin criteria of ARDS, presented with an atypical form of ARDS or a distinct phenotype, characterized by a dissociation between relatively well-preserved Crs and severity of hypoxemia (8). This raised doubts regarding the applicability of conventional and proven ARDS support strategies among such patients. Furthermore, a novel model of two primary phenotypes, a phenotype with low elastance or high Crs (“phenotype L”) and a phenotype with high elastance or low Crs (“phenotype H”), was postulated on the basis of differences in Crs, lung weight, and lung recruitability (9, 10).
It is unclear whether such Crs-based phenotypic patterns existed among patients with ARDS before the COVID-19 pandemic. Given this, we set out to determine the range of Crs on the first day of ARDS, the degree of hypoxemia, and the prevalence of associated Crs-based phenotypic patterns with their characteristics and outcomes among patients with ARDS enrolled in the LUNG SAFE (Large Observational Study to Understand the Global Impact of Severe Acute Respiratory Failure) study (11). Our secondary objective was to closely examine the relationship between Crs and ARDS-related mortality.
Methods
The LUNG SAFE study was a prospective observational multinational cohort study of patients with acute hypoxemic respiratory failure requiring ventilatory support. The detailed study design and main results have been published previously (11). All participating ICUs obtained ethics committee approval and either patient consent or an ethics committee waiver of consent. National coordinators and site investigators (see Appendix E1 in the online supplement) were responsible for ensuring data integrity and validity.
Patients, Study Design, and Data Collection
Patients receiving mechanical ventilation during the study period were enrolled. Exclusion criteria were age < 16 years or inability to obtain informed consent (when required). For the current report, we restricted analyses to the subset of patients who were classified as having ARDS within 48 hours of the onset of acute hypoxemic respiratory failure in the ICU and who received invasive mechanical ventilation with controlled ventilation modes, lacked spontaneous breathing effort (where the total respiratory rate was equal to the set respiratory rate ±1 on the mechanical ventilator), did not require extracorporeal membrane oxygenation support, and had available data for positive end-expiratory pressure (PEEP), Vt, and plateau pressure.
Data on arterial blood gases, type of ventilatory support with ventilator settings, and Sequential Organ Failure Assessment (SOFA) score were collected at the same time each day. Data on ventilatory settings were recorded simultaneously with the arterial blood gas. Decisions to withhold or withdraw life-sustaining treatments during the ICU stay and the time at which this decision was taken were recorded. Patient survival was evaluated at hospital discharge, or at Day 90, whichever occurred first. Clinician recognition of ARDS was assessed on Day 1 of study entry, and when patients exited the study.
Data Definitions
The Crs (ml/cm H2O) was defined as the Vt (milliliters) divided by the difference between plateau pressure (cm H2O) and PEEP (cm H2O) (1). Driving pressure (cm H2O) was derived as the difference between plateau pressure and PEEP (12). Patients were partitioned into three groups on the basis of the recently proposed Crs thresholds (9, 10): Crs < 40 ml/cm H2O, (poor Crs or phenotype H), Crs of 40–50 ml/cm H2O, (intermediate phenotype), and Crs ≥ 50 ml/cm H2O (preserved Crs or phenotype L). The duration of invasive mechanical ventilation was calculated as the number of days between the date of intubation and the date of extubation in the ICU (or death, if the patient died while on invasive mechanical ventilation). Other data definitions have been previously reported (11–13).
Outcomes
The primary outcome was the range of Crs on the first day of ARDS, specifically the prevalence of Crs-based phenotypic patterns with their characteristics and outcomes, among patients with ARDS enrolled in the LUNG SAFE study. The secondary outcome was the relationship between Crs and mortality at hospital discharge after adjusting for relevant confounders.
Data Management and Statistical Analyses
Descriptive statistics included proportions for categorical and mean (SD) or median (interquartile range) for continuous variables. Plateau pressure was either specifically measured or the peak inspiratory pressure was considered to be the plateau pressure when this specific measurement was unavailable and a patient was ventilated on a pressure-controlled mode and lacked spontaneous breathing. As a sensitivity analysis, in cases where plateau pressure was not specifically measured, the plateau pressure was alternatively estimated as a function of the peak inspiratory pressure using a generalized additive model introducing a penalized spline term of peak inspiratory pressure. To assess differences among the three phenotypic groups, we performed the chi-square test (or the Fisher’s exact test) for discrete variables and performed ANOVA (or the Kruskal-Wallis test) for continuous variables. Bonferroni correction was applied to determine significance in the setting of multiple comparisons. The chi-square test (or Fisher’s exact test) or Student’s t test (or Wilcoxon-Mann-Whitney test) were used to assess differences between groups in discrete and continuous distributions of parameters, respectively. The relationship between Crs and the PaO2/FiO2 ratio was investigated using a regression model introducing a penalized spline term for the PaO2/FiO2 ratio, and the proportion of variance explained by independent variable was assessed with adjusted r2. The locally estimated scatterplot smoothing method was used to inspect the relationship between mortality and Crs. Multivariable logistic regression models were used to evaluate the association between Crs and hospital mortality after adjusting for relevant confounders. In each regression model, the independent predictors (demographic characteristics and clinical parameters measured on the first day of ARDS) were identified through a stepwise regression approach. This approach combines forward and backward selection methods in an iterative procedure (with a significance level of 0.05 both for entry and retention) to select predictors in the final multivariable model. Independent variables used in the stepwise approach were age, sex, body mass index, comorbidity, ARDS risk factors, illness severity parameters at Day 1 (PaO2/FiO2, PaCO2, pH, and nonpulmonary SOFA score adjusted for missing values), ventilatory settings at Day 1 (Vt, PEEP, Crs, FiO2, volume Assist-Control mode, and standardized Ve), and use of adjunctive measures at Day 1 (prone position, neuromuscular blockade, and corticosteroids). Patients with Crs > 150 ml/cm H2O were considered as outliers and were excluded from the final regression model to reduce uncertainty at extreme values. However, a sensitivity analysis after including these outliers was also performed. To facilitate interpretation, adjusted marginal probabilities of hospital mortality were plotted across the range of Crs. Additional sensitivity analyses were conducted on the subset of patients who continued to meet ARDS Berlin criteria on the second day. Results were reported as the odds ratio with 95% confidence interval. All P values were two-sided, with P values < 0.05 considered as statistically significant. Statistical analyses were performed with R, version 3.5.2. (R Project for Statistical Computing) and SAS software, version 9.4 (SAS Institute).
Results
Of 2,377 patients who developed ARDS within 48 hours of the onset of acute severe hypoxemic respiratory failure in the ICU, 1,117 patients were included in this study (Figure 1).
Figure 1.
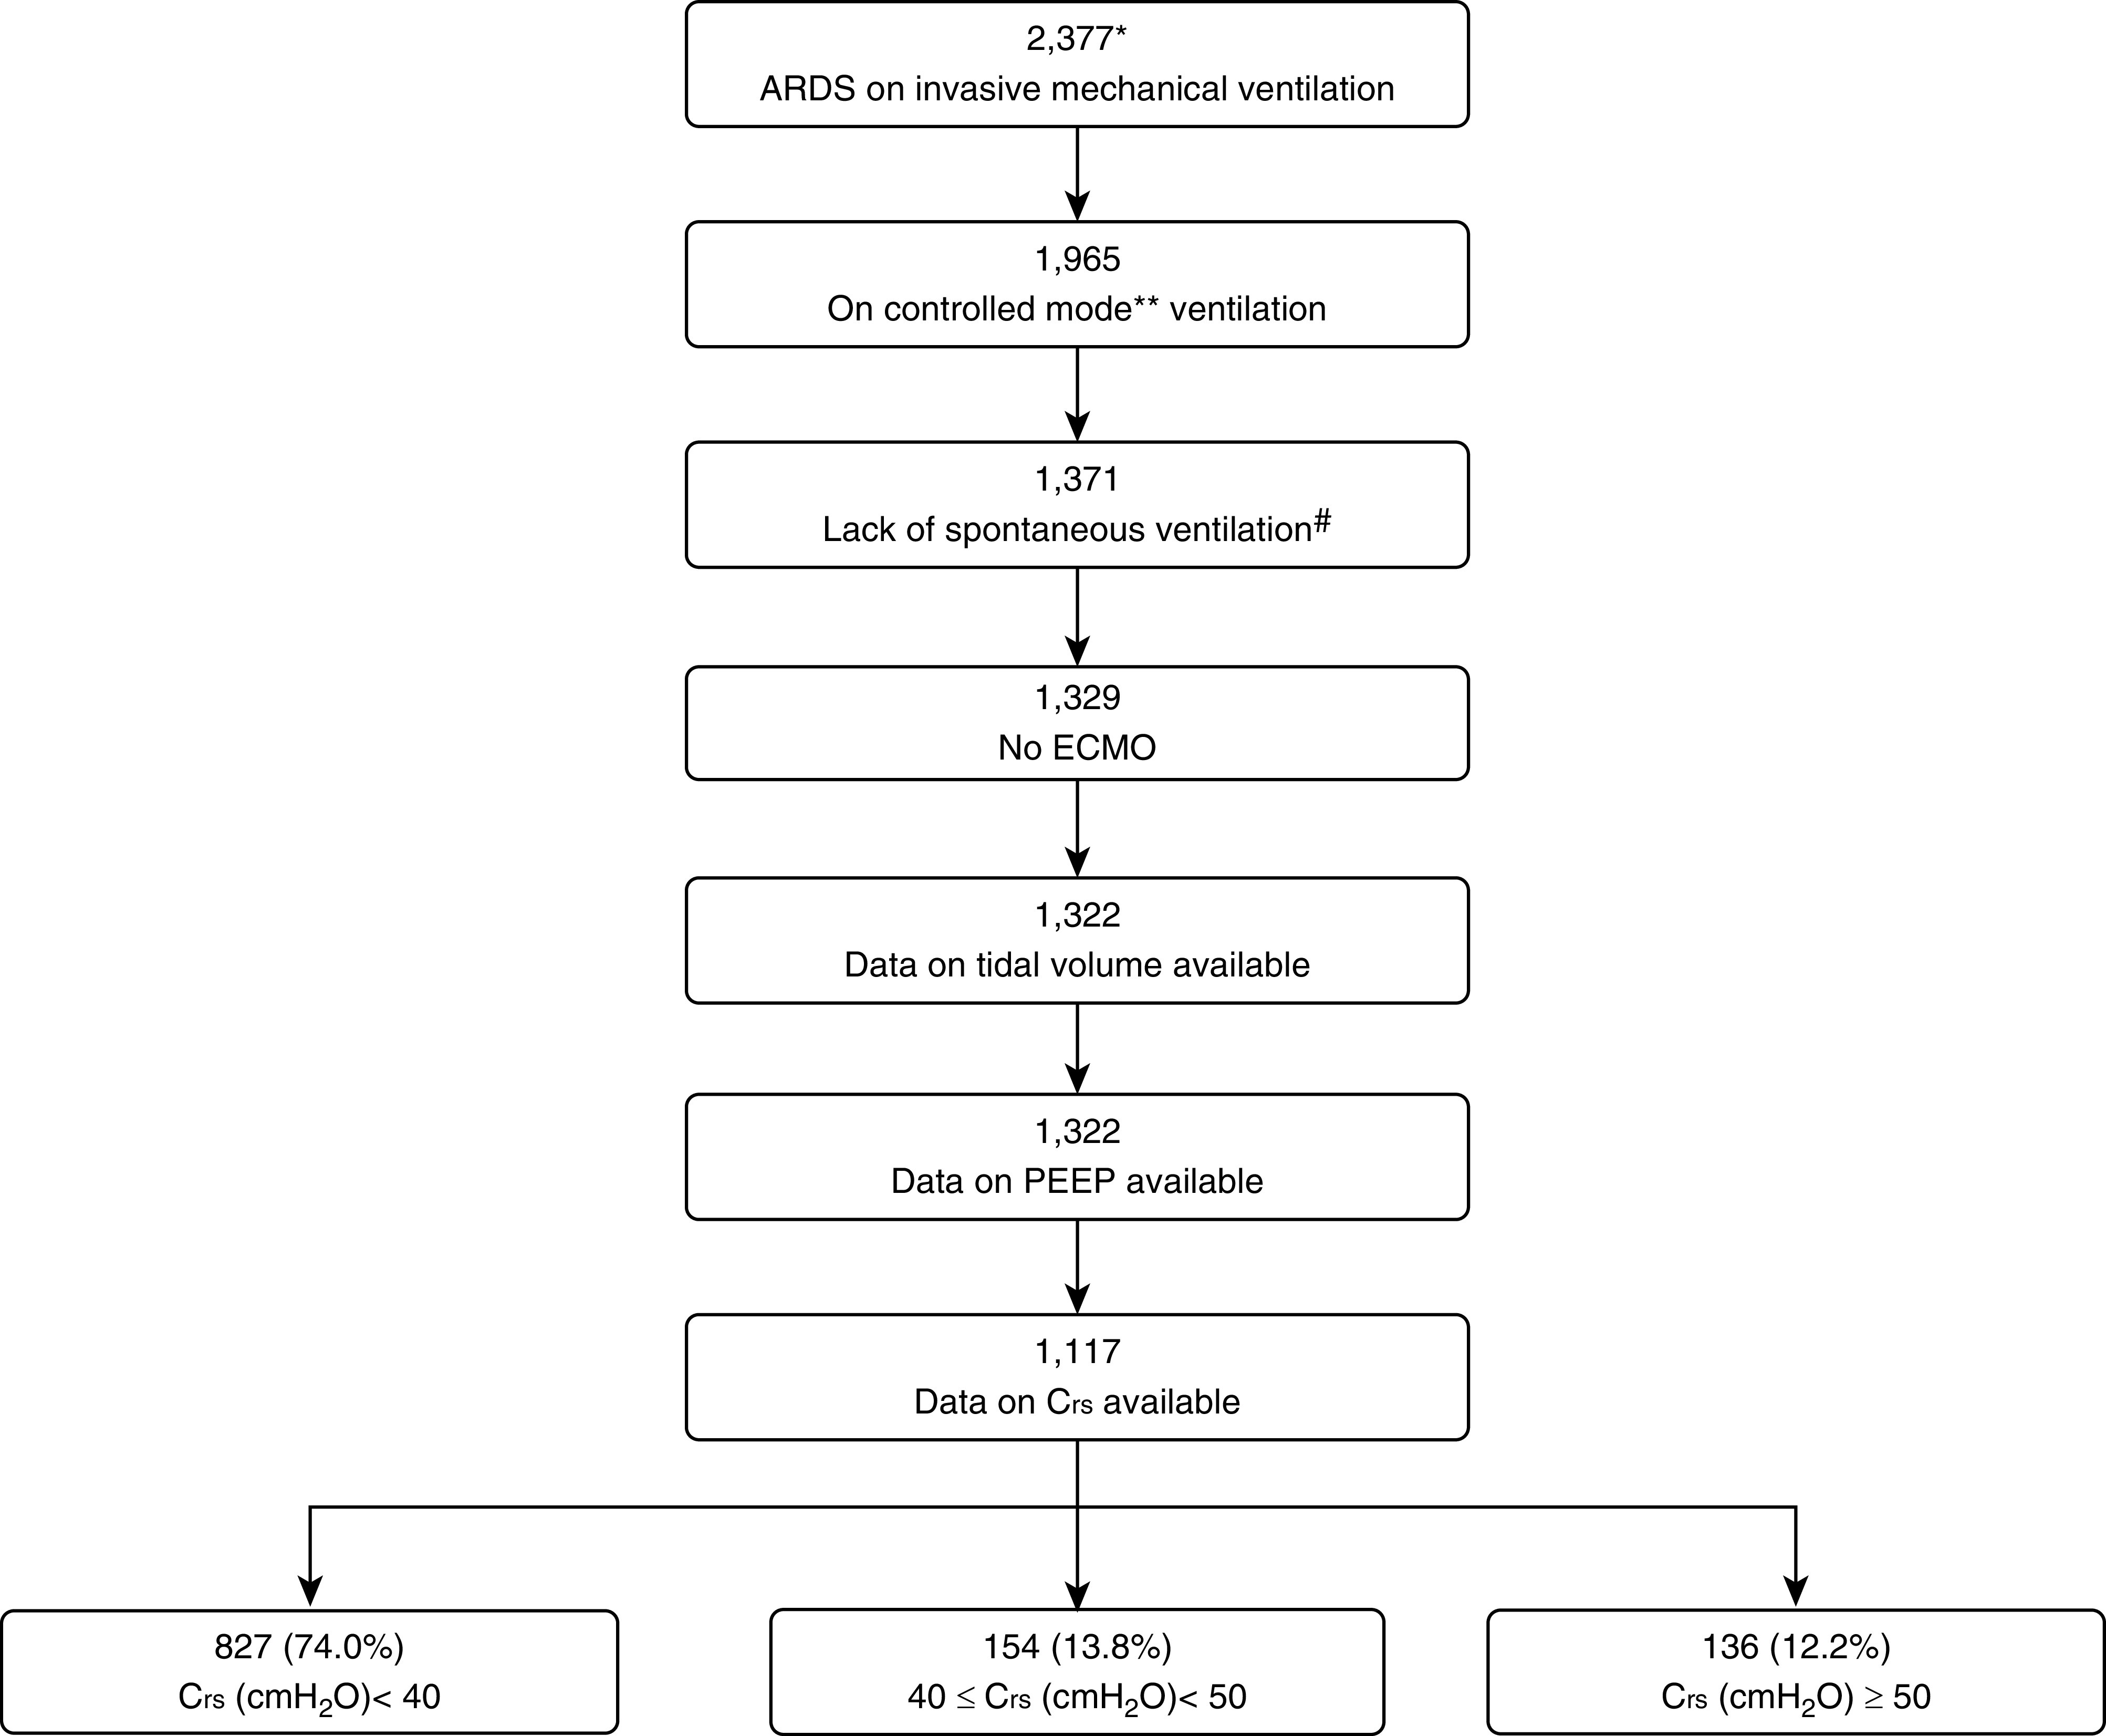
Patient flowchart to show subset selection. *Patients who developed ARDS within 1–2 days of developing acute hypoxemic respiratory failure and who were managed with invasive mechanical ventilation. **Volume Assist-Control ventilation, pressure-controlled ventilation, airway pressure release ventilation, or pressure-regulated volume control were considered as controlled modes of mechanical ventilation. #No spontaneous ventilation was considered when the set respiratory rate was equal to actual respiratory rate ± 1. ARDS = acute respiratory distress syndrome; Crs = respiratory system compliance; ECMO = extracorporeal membrane oxygenation; PEEP = positive end-expiratory pressure.
Characteristics of Phenotypic Groups
Baseline characteristics, including measures of illness severity, for the phenotypic groups are displayed in Table 1. As per the prespecified Crs thresholds, 827 (74%) patients had poor Crs (<40 ml/cm H2O) and could be classed as having phenotype H, 154 (14%) had the intermediate phenotype, and 136 (12%) patients had preserved Crs (≥50 ml/cm H2O) and could be classed as having phenotype L. Clinician recognition of ARDS was higher for phenotype H than for phenotype L (69% vs. 57%; P < 0.05). Phenotype H was more common among females and was associated with a higher burden of comorbidities, including diabetes. The phenotypic groups did not differ in terms of pulmonary versus nonpulmonary risk factors for ARDS or in terms of the nonpulmonary SOFA score. The mean PaO2/FiO2 ratio varied: 151 ± 66 for phenotype H, 156 ± 60 for the intermediate phenotype, and 171 ± 69 for phenotype L (P < 0.05). Fifty-eight (43%) patients with preserved Crs and 451 (55%) patients with poor Crs had a PaO2/FiO2 ratio <150. Figure 2 shows a near complete dissociation between Crs and the PaO2/FiO2 ratio (r2 adjusted = 0.001) in this cohort, with a large variability in the Crs (median, 30 [interquartile range, 23–40] ml/cm H2O; range, 6–225 ml/cm H2O).
Table 1.
Characteristics of ARDS Phenotypes Stratified by Crs
| Baseline Variables | H Phenotype (Crs < 40) | Intermediate Phenotype (40 ≤ Crs < 50) | L Phenotype (Crs ≥ 50) | P Value |
|---|---|---|---|---|
| n (%) | 827 (74.04) | 154 (13.79) | 136 (12.18) | — |
| Clinician recognition of ARDS, n (%) | ||||
| At baseline | 198 (36.03) | 49 (31.82) | 32 (23.53)* | 0.0143 |
| During ICU stay | 574 (69.41) | 95 (61.69) | 78 (57.35)* | 0.0073 |
| Age, yr, mean ± SD | 59.97 ± 16.42 | 61.23 ± 15.95 | 60.15 ± 17.56 | 0.7542 |
| Males, n (%) | 472 (57.07) | 116 (75.32)* | 102 (75.00)* | <0.0001 |
| BMI, kg/m2, mean ± SD | 27.90 ± 7.64 | 28.24 ± 7.36 | 26.50 ± 5.30 | 0.1892 |
| Chronic diseases, n (%)† | ||||
| COPD | 178 (21.52) | 32 (20.78) | 29 (21.40) | 0.9786 |
| Diabetes mellitus | 209 (25.27) | 28 (18.18) | 18 (13.24)* | 0.0027 |
| Immune incompetence | 178 (21.52) | 23 (14.94) | 20 (14.71) | 0.0581 |
| Chronic cardiac failure | 77 (9.31) | 13 (8.44) | 10 (7.35) | 0.7384 |
| Chronic renal failure | 86 (10.40) | 12 (7.79) | 9 (6.62) | 0.2744 |
| Chronic liver failure | 35 (4.23) | 7 (4.55) | 9 (6.62) | 0.4664 |
| Number of chronic diseases, n (%) | ||||
| 0 | 327 (39.54) | 71 (46.10) | 71 (52.21)* | 0.0115 |
| 1 | 307 (37.12) | 58 (37.66) | 44 (32.35) | 0.5409 |
| ≥2 | 193 (23.34) | 25 (16.23) | 21 (15.44)* | 0.0279 |
| Type of risk factors for ARDS, n (%) | 0.4884 | |||
| None | 64 (7.74) | 11 (7.14) | 6 (4.41) | |
| Only nonpulmonary | 176 (21.28) | 32 (20.78) | 29 (21.32) | |
| Only pulmonary | 475 (57.44) | 84 (54.55) | 75 (55.15) | |
| Both | 112 (13.54) | 27 (17.53) | 26 (19.12) | |
| Risk factors for ARDS, n (%)† | ||||
| Pneumonia | 465 (56.23) | 82 (53.25) | 81 (59.56) | 0.5574 |
| Extrapulmonary sepsis | 137 (16.57) | 27 (17.53) | 23 (16.91) | 0.9559 |
| Blood transfusion | 135 (16.32) | 27 (17.53) | 20 (14.71) | 0.8085 |
| Trauma or pulmonary contusion | 36 (4.35) | 14 (9.09)* | 15 (11.03)* | 0.0015 |
| Other risk factors | 35 (4.23) | 8 (5.19) | 8 (5.88) | 0.6402 |
| Illness severity | ||||
| Gas exchange | ||||
| PaO2, mm Hg, mean ± SD | 93.30 ± 36.45 | 91.21 ± 33.26 | 99.29 ± 42.97 | 0.2308 |
| PaO2/FiO2, mm Hg, mean ± SD | 150.60 ± 66.44 | 156.53 ± 59.81 | 170.92 ± 69.00* | 0.0034 |
| PaO2/FiO2 < 150 mm Hg, n (%) | 451 (54.53) | 72 (46.75) | 58 (42.65) | 0.0136 |
| SpO2, %, median (IQR) | 96.0 (93.0–98.0) | 96.0 (93.0–98.0) | 97.0 (95.0–98.0) | 0.0547 |
| PaCO2, mm Hg, mean ± SD | 48.26 ± 16.04 | 46.85 ± 16.50 | 46.69 ± 14.38 | 0.2227 |
| pH, unit, mean ± SD | 7.30 ± 0.13 | 7.32 ± 0.11 | 7.33 ± 0.1* | 0.0303 |
| SOFA score, mean ± SD | ||||
| Adjusted for missing values | 10.63 ± 3.98 | 10.19 ± 3.56 | 9.98 ± 3.96 | 0.1483 |
| Nonpulmonary (adjusted for missing values) | 7.33 ± 3.92 | 6.97 ± 3.68 | 6.96 ± 3.94 | 0.4309 |
Definition of abbreviations: ARDS = acute respiratory distress syndrome; BMI = body mass index; COPD = chronic obstructive pulmonary disease; Crs = respiratory system compliance, ml/cm H2O; H phenotype = phenotype with high elastance or low Crs; IQR = interquartile range (first quartile to third quartile); L phenotype = phenotype with low elastance or high Crs; SOFA = Sequential Organ Failure Assessment; SpO2 = oxygen saturation as measured by pulse oximetry.
P value < 0.05, comparison versus H phenotype (Bonferroni correction).
Sum of percentages is >100% because patient could have more than one chronic disease and/or risk factor.
Figure 2.

Distribution of (A) PaO2/FiO2 and (B) Crs in the cohort and the relationship between Crs and the PaO2/FiO2 ratio. Crs = respiratory system compliance; IQR = interquartile range.
Ventilatory Settings and Adjunctive Therapies
Table 2 displays the ventilatory settings and adjunctive therapies among phenotype groups. The mean Vt varied among groups: 7.5 ± 1.6 ml/kg of predicted body weight (PBW) in phenotype H, 7.8 ± 1.8 ml/kg of PBW in the intermediate phenotype, and 8.5 ± 2.1 ml/kg of PBW in phenotype L (P < 0.05). The mean PEEP levels were similar across the three groups, but the plateau pressure, peak inspiratory pressure, and driving pressure were all significantly higher, with correspondingly lower Crs, in phenotype H versus phenotype L (P < 0.05 for all). The use of proning and neuromuscular blockade, but not corticosteroids, was more common in the group with phenotype H.
Table 2.
Ventilatory Management and Adjunctive Interventions in Each ARDS Phenotypic Group
| Parameter | H Phenotype (Crs < 40) | Intermediate Phenotype (40 ≤ Crs < 50) | L Phenotype (Crs ≥ 50) | P Value |
|---|---|---|---|---|
| n (%) | 827 (74.04) | 154 (13.79) | 136 (12.18) | — |
| Ventilator settings, first day of ARDS | ||||
| Crs, ml/cm H2O, median (IQR) | 26.25 (21.05–32.00) | 43.27 (41.08–45.45)* | 66.00 (55.00–80.63)*† | <0.0001 |
| Volume Assist-Control mode, n (%) | 276 (33.37) | 69 (44.81)* | 51 (37.50) | 0.0213 |
| FiO2, unit, median (IQR) | 0.60 (0.50–1.00) | 0.60 (0.50–0.80)* | 0.60 (0.40–0.83)* | 0.0026 |
| Set respiratory rate, breaths/min, mean ± SD | 19.87 ± 5.55 | 18.90 ± 5.65 | 17.35 ± 4.49* | <0.0001 |
| Total respiratory rate, breaths/min, mean ± SD | 19.90 ± 5.54 | 18.93 ± 5.66 | 17.43 ± 4.48* | <0.0001 |
| Vt, ml/kg IBW, mean ± SD | 7.50 ± 1.65 | 7.81 ± 1.80 | 8.49 ± 2.15*† | <0.0001 |
| PEEP, cm H2O, mean ± SD | 8.61 ± 3.22 | 8.88 ± 3.55 | 8.35 ± 3.00 | 0.5536 |
| PIP, cm H2O, mean ± SD | 30.31 ± 7.55 | 25.99 ± 6.40* | 22.66 ± 6.77*† | <0.0001 |
| Plateau pressure, cm H2O, mean ± SD | 25.72 ± 5.23 | 19.92 ± 3.62* | 15.90 ± 3.85*† | <0.0001 |
| Driving pressure, cm H2O, mean ± SD | 17.34 ± 4.46 | 11.10 ± 1.90* | 7.64 ± 2.26*† | <0.0001 |
| Standardized Ve, L/min, median (IQR) | 9.64 (7.52–12.78) | 9.73 (8.06–12.56) | 9.90 (8.28–12.89) | 0.2957 |
| Adjunctive measures, first day of ARDS | ||||
| Neuromuscular blockade, n (%) | 158 (19.11) | 22 (14.29) | 15 (11.03)* | 0.0381 |
| Prone positioning, n (%) | 30 (3.63) | 7 (4.55) | 0 (0.00) | 0.0594 |
| Corticosteroids, n (%) | 104 (12.58) | 12 (7.79) | 15 (11.03) | 0.2297 |
| Adjunctive measures, during ICU stay | ||||
| Neuromuscular blockade, n (%) | 236 (28.54) | 36 (23.38) | 21 (15.44)* | 0.0039 |
| Prone positioning, n (%) | 91 (11.00) | 12 (7.79) | 5 (3.68)* | 0.0193 |
| Corticosteroids, n (%) | 169 (20.44) | 23 (14.94) | 23 (16.91) | 0.2154 |
Definition of abbreviations: ARDS = acute respiratory distress syndrome; Crs = respiratory system compliance, ml/cm H2O; H phenotype = phenotype with high elastance or low Crs; IBW = ideal body weight; IQR = interquartile range (first quartile to third quartile); L phenotype = phenotype with low elastance or high Crs; PEEP = positive end-expiratory pressure; PIP = peak inspiratory pressure.
P value < 0.05, comparison versus H phenotype (Bonferroni correction).
P value < 0.05, comparison versus intermediate phenotype (Bonferroni correction).
Outcomes
Table 3 summarizes the clinical outcomes for each phenotypic group. The groups behaved similarly in terms of the progression of ARDS from Day 1 to Day 2. There were no differences among the groups regarding decisions on limitation of life-sustaining therapies or measures. Surviving patients with phenotype L were liberated from mechanical ventilation earlier than those with phenotype H. Mortality rates in the ICU and hospital differed significantly among the three groups, with higher mortality among patients with phenotype H (Table 3). Mortality status at hospital discharge was unavailable for four (0.5%) patients in the group with phenotype H. Results were similar when analyses were restricted to patients with a PaO2/FiO2 ratio < 150 mm Hg (Table E1). The locally estimated scatterplot smoothing curve demonstrated that unadjusted mortality risk decreased with increasing Crs, with no clear transition point for any particular Crs threshold under 100 ml/cm H2O (Figure 3A). In multivariable analyses (Table 4), older age, immune incompetence, higher nonpulmonary SOFA score, presence of chronic liver disease, and presence of risk factors for ARDS were associated with higher odds of hospital mortality. Increasing body mass index and increasing pH were associated with lower odds of hospital mortality. Increasing Crs was independently associated with lower odds of hospital mortality (adjusted odds ratio per ml/cm H2O increase, 0.988; 95% confidence interval, 0.979–0.996; P = 0.005). The adjusted marginal probability of hospital mortality decreased linearly with increasing values of Crs, with no clear transition point for any particular Crs threshold (Figure 3B).
Table 3.
Clinical Outcomes for Each ARDS Phenotypic Group
| Parameter | H Phenotype (Crs < 40) | Intermediate Phenotype (40 ≤ Crs < 50) | L phenotype (Crs ≥ 50) | P Value |
|---|---|---|---|---|
| n (%) | 827 (74.04) | 154 (13.79) | 136 (12.18) | — |
| Progression of ARDS (from Day 1 to Day 2)* | 0.4548 | |||
| Improved/resolved | 222 (30.04) | 48 (33.57) | 48 (37.50) | |
| No change | 321 (43.44) | 62 (43.36) | 52 (40.63) | |
| Worsened | 196 (26.52) | 33 (23.08) | 28 (21.88) | |
| Duration of invasive mechanical ventilation, d, median (IQR) | ||||
| All patients | 8 (4–16) | 9.5 (5–15) | 7 (4–12.5) | 0.1379 |
| Survivors at ICU discharge | 9 (5–17) | 10 (5–15) | 7 (3–12)† | 0.0233 |
| Duration of ICU stay, d, median (IQR) | ||||
| All patients | 11 (6–20) | 11 (6–21) | 95 (5–16) | 0.1879 |
| Survivors at ICU discharge | 12 (7–23) | 12 (8–21) | 11 (5–16)† | 0.0440 |
| Deaths in ICU, n (%) | 333 (40.27) | 48 (21.17) | 37 (27.21)† | 0.0032 |
| Duration of hospital stay, d, median (IQR) | ||||
| All patients | 16 (8–33) | 20 (11.5–38) | 19 (8–30) | 0.0703 |
| Survivors at hospital discharge | 25 (14–43) | 27.5 (15–44) | 23 (15–38) | 0.5059 |
| Deaths in hospital, n (%) | 370 (44.96) | 56 (36.36) | 44 (32.35)† | 0.0063 |
| Limitation of life sustained measures in ICU, n (%) | 214 (25.88) | 33 (21.43) | 28 (20.59) | 0.2541 |
Definition of abbreviations: ARDS = acute respiratory distress syndrome; Crs = respiratory system compliance, ml/cm H2O; H phenotype = phenotype with high elastance or low Crs; IQR = interquartile range (first quartile to third quartile); L phenotype = phenotype with low elastance or high Crs.
Value calculated for patients in ICU after 2 days from ARDS onset and evaluable ARDS Berlin criteria.
P value < 0.05, comparison versus H phenotype (Bonferroni correction).
Figure 3.

(A) Locally estimated scatterplot smoothing curves and (B) predicted marginal probabilities with 95% confidence intervals for hospital mortality versus Crs. Crs = respiratory system compliance; OR = odds ratio.
Table 4.
Factors Associated with Hospital Mortality in Our Study Population
| Multivariable Model* | Odds Ratio (95% CI) | P Value |
|---|---|---|
| Age, yr | 1.025 (1.017–1.034) | <0.0001 |
| BMI, kg/m2 | 0.966 (0.946–0.985) | 0.0006 |
| Nonpulmonary (adjusted for missing values) SOFA score | 1.128 (1.085–1.172) | <0.0001 |
| Immune incompetence (reference: no) | 1.989 (1.424–2.777) | <0.0001 |
| Chronic liver disease (reference: no) | 3.486 (1.684–7.217) | 0.0008 |
| ARDS risk factors (reference: no) | 1.823 (1.065–3.122) | 0.0287 |
| pH, per 0.01 unit increase | 0.979 (0.968–0.991) | 0.0004 |
| Crs, per ml/cm H2O increase | 0.988 (0.979–0.996) | 0.0049 |
Definition of abbreviations: ARDS = acute respiratory distress syndrome; BMI = body mass index; CI = confidence interval; Crs = respiratory system compliance, ml/cm H2O; SOFA = Sequential Organ Failure Assessment.
On 1,035 patients; patients with Crs > 150 ml/cm H2O (n = 7; 0.6%) were considered as outliers and were excluded.
Sensitivity Analyses
These results remained robust when Crs derivation was based on plateau pressure that was modeled, when not specifically measured, as a function of peak inspiratory pressure while receiving pressure-controlled mode ventilation. The corresponding data from these sensitivity analyses for the characteristics of phenotypic groups, ventilatory parameters, and outcomes among the phenotype groups based on this method of Crs estimation are shown in Tables E2–E6, and Figures E1 and E2. The multivariable analysis after including outliers (i.e., patients with Crs > 150 ml/cm H2O; n = 7; 0.6%) showed similar results, as in Table 4, in terms of independent predictors of mortality (Table E7). Furthermore, the key findings from the sensitivity analyses of the subset of patients (n = 791; 71%) who continued to meet ARDS Belin definition on the second day, remained unchanged compared with the main analysis (Tables E8 and E9 and Figures E3 and E4).
Discussion
In this secondary analysis of LUNG SAFE study patients with ARDS, a wide range of Crs was observed. One in eight of these patients had preserved Crs (phenotype L) and three in four had poor Crs (phenotype H). Moderate-to-severe hypoxemia was present in a significant proportion (43%) of patients with preserved Crs. There was no relationship between the degree of hypoxemia and Crs among these patients with ARDS. Compared with those classed as having phenotype H, patients classed as having phenotype L had fewer comorbidities, were less sick, and had lower mortality rates. Decreasing Crs on the first day of ARDS was independently associated with higher mortality. The Crs–mortality relationship lacked a clear transition point for any particular Crs threshold, suggesting that such set thresholds are arbitrary.
Although our analysis shows that Crs-based phenotypic patterns are present in non–COVID-19 ARDS, there are some important observations to be made when comparing our results with those of recent reports on phenotypes in the context of COVID-19. Preserved Crs (or phenotype L) was reported to be more common in patients with COVID-19 pneumonia (9), but other recent small studies showed that Crs in COVID-19 ARDS is similar to that observed in non–COVID-19 ARDS (14–16). The median Crs for our cohort with non–COVID-19 ARDS is also similar to that reported in these studies on COVID-19 ARDS (14–16). Moreover, these studies did not specifically exclude spontaneously breathing patients, which could have potentially overestimated the Crs among some patients.
There are good arguments to be made to identify different ARDS phenotypes on the basis of clinical, radiologic, biologic, and/or outcome characteristics (17). ARDS is a heterogeneous syndrome, and the most optimal treatment and mechanical ventilation strategy are likely to be different for different subsets of patients. Different ARDS phenotypes have been described on the basis of a parsimonious sets of predictors, comprising plasma biomarkers, genetics and clinical variables, and latent class analysis (18). Another study showed two distinct ARDS phenotypes that responded differentially to randomly assigned fluid-management strategies (19), and distinct metabolic endotypes in ARDS have also been described (20). More recently, a classifier model was validated to identify two distinct ARDS phenotypes, hypoinflammatory and hyperinflammatory, which had significantly different mortality rates (21). Future studies might find it useful to explore whether the proposed phenotype H, whether present in the context of COVID-19 or non–COVID-19 ARDS, shares any other characteristics, besides high mortality rates, with the hyperinflammatory ARDS phenotype.
To our knowledge, this is the largest prospective data set to demonstrate a significant association between Crs and mortality in patients with ARDS, with no clear transition point or step for mortality risk at any particular threshold across the Crs spectrum. This is consistent with the relationship between plateau pressure and mortality (22) and is also consistent with the observed relationship between driving pressure and mortality, as driving pressure is a function of Vt scaled to Crs (4). Normal Crs in the supine position is in the range of 100–200 ml/cm H2O (23), but in mechanically ventilated adults with normal lungs, the interquartile range of Crs has been reported as 44–64 ml/cm H2O (24). A combination of Crs < 20 ml/cm H2O with severe hypoxemia identified a very high-risk ARDS subset in a post hoc analysis (1). On the basis of this evidence, although it may be justifiable to propose these thresholds to categorize Crs-based phenotypes, the lack of any transition point in mortality risk across the range of Crs indicates that any such proposed thresholds are arbitrary. We used similar Crs thresholds, as recently proposed (10), to provide a frame of reference for other studies investigating the phenotypic distribution in COVID-19 pneumonia. Furthermore, our data provide reassurance that a phenotype of preserved Crs in combination with hypoxemia also exists in non–COVID-19 ARDS, and the current evidence-based best practices involving “lung-protective ventilation” with a limited Vt strategy would still be applicable for such patients. A post hoc analysis of clinical trials in ARDS did not reveal a safe threshold for plateau pressure below which the strategy of limiting Vts had no beneficial effect (22).
Limitations
The data for this study were collected prospectively before Crs-based phenotypes were postulated and are therefore unlikely to be biased toward any particular phenotype. The key study findings remained robust in all sensitivity analyses that were performed. There are other limitations of the LUNG SAFE study that have been well described (11–13). Importantly, given the observational nature of the study, causal inferences for any reported associations cannot be drawn. More specific to this report, the conditions for measuring the PaO2/FiO2 ratio, PEEP, plateau pressure, driving pressure, and Crs were not standardized. These were assessed as clinicians use them in real-life practice. These global measures are also unable to account for regional lung heterogeneity, chest-wall stiffness, and patient position (2). Furthermore, the lead-time bias in the form of time period for which patients fulfilled Berlin criteria or had ARDS before the assessment on Day 1 remains an unmeasured confounder. It is possible that patients categorized as having phenotype H during the initial 48 hours of ARDS could have been further along on the scale of the disease evolution process than those categorized as having phenotype L. Furthermore, our a priori decision to exclude patients with an increased likelihood of spontaneous breathing, which was done to ensure the reliability of Crs data, could have resulted in underestimation of the prevalence of patients with phenotype L. About 9% of patients were further excluded because of missing data for PEEP, Vt, or Crs. However, we do not have reasons to believe that these missing data were not randomly distributed among those excluded. We admit that the proposed type L and type H phenotypes have characteristics other than just Crs, including shunt fraction, lung weight (assessed by computed tomography scanning), or lung recruitability, that were not available in our data set. However, we submit that because a high degree of correlation was shown previously among Crs, lung weight, and potential for recruitability (25), our groups are likely representative of these phenotypes. Lastly, this report was a secondary analysis. However, it was hypothesis-driven rather than exploratory, and the results are highly relevant for clinicians who will be managing patients with either COVID-19–related or non–COVID-19–related ARDS.
Conclusions
In a large cohort of patients with non–COVID-19 ARDS, a wide range of Crs was observed. Approximately one in eight of these patients had preserved Crs, which was similar to those with phenotype L described in the context of COVID-19 pneumonia. There was a near complete dissociation between the degree of hypoxemia and Crs among patients with ARDS. A significant proportion of patients with preserved Crs had moderate-to-severe hypoxemia. Lower Crs on the first day of ARDS was independently associated with higher mortality. Importantly, the Crs–mortality relationship lacked a clear transition point for any particular Crs threshold under 100 ml/cm H2O, suggesting that such set thresholds are quite arbitrary.
Supplementary Material
Acknowledgments
Acknowledgment
The European Society of Intensive Care Medicine (ESICM) provided support in data collection and study coordination.
Footnotes
Supported by the European Society of Intensive Care Medicine (ESICM), Brussels, Belgium; by St. Michael’s Hospital, Toronto, Canada; and by the University of Milan-Bicocca, Monza, Italy. ESICM, St. Michael’s Hospital, and University of Milan-Bicocca had no role in the design and conduct of the study; management, analysis, or interpretation of the data; preparation, review, or approval of the manuscript; or decision to submit the manuscript for publication.
Author Contributions: F.M.: Access to study data, performed the analysis, and takes responsibility for the integrity of the data. R.P.: Drafting of the manuscript. R.P., F.M., J.G.L., and F.M.P.v.H.: Study concept and design, interpretation of the data, and critical revision of the manuscript for important intellectual content.
A complete list of the LUNG SAFE Investigators and ESICM Trials Group members may be found in the online supplement.
This article has an online supplement, which is accessible from this issue’s table of contents at www.atsjournals.org.
Originally Published in Press as DOI: 10.1164/rccm.202005-2046OC on August 17, 2020
Author disclosures are available with the text of this article at www.atsjournals.org.
Contributor Information
Collaborators: on behalf of the LUNG SAFE Investigators and the ESICM Trials Group
References
- 1.Ranieri VM, Rubenfeld GD, Thompson BT, Ferguson ND, Caldwell E, Fan E, et al. ARDS Definition Task Force. Acute respiratory distress syndrome: the Berlin definition. JAMA. 2012;307:2526–2533. doi: 10.1001/jama.2012.5669. [DOI] [PubMed] [Google Scholar]
- 2.Henderson WR, Chen L, Amato MBP, Brochard LJ. Fifty years of research in ARDS: respiratory mechanics in acute respiratory distress syndrome. Am J Respir Crit Care Med. 2017;196:822–833. doi: 10.1164/rccm.201612-2495CI. [DOI] [PubMed] [Google Scholar]
- 3.Gattinoni L, Pesenti A, Avalli L, Rossi F, Bombino M. Pressure-volume curve of total respiratory system in acute respiratory failure: computed tomographic scan study. Am Rev Respir Dis. 1987;136:730–736. doi: 10.1164/ajrccm/136.3.730. [DOI] [PubMed] [Google Scholar]
- 4.Amato MB, Meade MO, Slutsky AS, Brochard L, Costa EL, Schoenfeld DA, et al. Driving pressure and survival in the acute respiratory distress syndrome. N Engl J Med. 2015;372:747–755. doi: 10.1056/NEJMsa1410639. [DOI] [PubMed] [Google Scholar]
- 5.Nuckton TJ, Alonso JA, Kallet RH, Daniel BM, Pittet JF, Eisner MD, et al. Pulmonary dead-space fraction as a risk factor for death in the acute respiratory distress syndrome. N Engl J Med. 2002;346:1281–1286. doi: 10.1056/NEJMoa012835. [DOI] [PubMed] [Google Scholar]
- 6.Seeley E, McAuley DF, Eisner M, Miletin M, Matthay MA, Kallet RH. Predictors of mortality in acute lung injury during the era of lung protective ventilation. Thorax. 2008;63:994–998. doi: 10.1136/thx.2007.093658. [DOI] [PMC free article] [PubMed] [Google Scholar]
- 7.Lanspa MJ, Peltan ID, Jacobs JR, Sorensen JS, Carpenter L, Ferraro JP, et al. Driving pressure is not associated with mortality in mechanically ventilated patients without ARDS. Crit Care. 2019;23:424. doi: 10.1186/s13054-019-2698-9. [DOI] [PMC free article] [PubMed] [Google Scholar]
- 8.Gattinoni L, Coppola S, Cressoni M, Busana M, Rossi S, Chiumello D. COVID-19 does not lead to a “typical” acute respiratory distress syndrome. Am J Respir Crit Care Med. 2020;201:1299–1300. doi: 10.1164/rccm.202003-0817LE. [DOI] [PMC free article] [PubMed] [Google Scholar]
- 9.Gattinoni L, Chiumello D, Caironi P, Busana M, Romitti F, Brazzi L, et al. COVID-19 pneumonia: different respiratory treatments for different phenotypes? Intensive Care Med. 2020;46:1099–1102. doi: 10.1007/s00134-020-06033-2. [DOI] [PMC free article] [PubMed] [Google Scholar]
- 10.Gattinoni L, Chiumello D, Rossi S. COVID-19 pneumonia: ARDS or not? Crit Care. 2020;24:154. doi: 10.1186/s13054-020-02880-z. [DOI] [PMC free article] [PubMed] [Google Scholar]
- 11.Bellani G, Laffey JG, Pham T, Fan E, Brochard L, Esteban A, et al. LUNG SAFE Investigators; ESICM Trials Group. Epidemiology, patterns of care, and mortality for patients with acute respiratory distress syndrome in intensive care units in 50 countries. JAMA. 2016;315:788–800. doi: 10.1001/jama.2016.0291. [DOI] [PubMed] [Google Scholar]
- 12.Laffey JG, Bellani G, Pham T, Fan E, Madotto F, Bajwa EK, et al. LUNG SAFE Investigators and the ESICM Trials Group. Potentially modifiable factors contributing to outcome from acute respiratory distress syndrome: the LUNG SAFE study. Intensive Care Med. 2016;42:1865–1876. doi: 10.1007/s00134-016-4571-5. [DOI] [PubMed] [Google Scholar]
- 13.van Haren F, Pham T, Brochard L, Bellani G, Laffey J, Dres M, et al. Large observational study to Understand the Global impact of Severe Acute Respiratory Failure (LUNG SAFE) Investigators. Spontaneous breathing in early acute respiratory distress syndrome: insights from the Large Observational Study to Understand the Global Impact of Severe Acute Respiratory Failure study. Crit Care Med. 2019;47:229–238. doi: 10.1097/CCM.0000000000003519. [DOI] [PMC free article] [PubMed] [Google Scholar]
- 14.Ziehr DR, Alladina J, Petri CR, Maley JH, Moskowitz A, Medoff BD, et al. Respiratory pathophysiology of mechanically ventilated patients with COVID-19: a cohort study. Am J Respir Crit Care Med. 2020;201:1560–1564. doi: 10.1164/rccm.202004-1163LE. [DOI] [PMC free article] [PubMed] [Google Scholar]
- 15.Bhatraju PK, Ghassemieh BJ, Nichols M, Kim R, Jerome KR, Nalla AK, et al. COVID-19 in critically ill patients in the Seattle region: case series. N Engl J Med. 2020;382:2012–2022. doi: 10.1056/NEJMoa2004500. [DOI] [PMC free article] [PubMed] [Google Scholar]
- 16.Bos LD, Paulus F, Vlaar APJ, Beenen LFM, Schultz MJ. Subphenotyping ARDS in COVID-19 patients: consequences for ventilator management. Ann Am Thorac Soc. doi: 10.1513/AnnalsATS.202004-376RL. [online ahead of print] 12 May 2020; DOI: 10.1513/AnnalsATS.202004-376RL. [DOI] [PMC free article] [PubMed] [Google Scholar]
- 17.Shankar-Hari M, McAuley DF. Acute respiratory distress syndrome phenotypes and identifying treatable traits: the dawn of personalized medicine for ARDS. Am J Respir Crit Care Med. 2017;195:280–281. doi: 10.1164/rccm.201608-1729ED. [DOI] [PubMed] [Google Scholar]
- 18.Wilson JG, Calfee CS. ARDS subphenotypes: understanding a heterogeneous syndrome. Crit Care. 2020;24:102. doi: 10.1186/s13054-020-2778-x. [DOI] [PMC free article] [PubMed] [Google Scholar]
- 19.Famous KR, Delucchi K, Ware LB, Kangelaris KN, Liu KD, Thompson BT, et al. ARDS Network. Acute respiratory distress syndrome subphenotypes respond differently to randomized fluid management strategy. Am J Respir Crit Care Med. 2017;195:331–338. doi: 10.1164/rccm.201603-0645OC. [DOI] [PMC free article] [PubMed] [Google Scholar]
- 20.Viswan A, Ghosh P, Gupta D, Azim A, Sinha N. Distinct metabolic endotype mirroring acute respiratory distress syndrome (ARDS) subphenotype and its heterogeneous biology. Sci Rep. 2019;9:2108. doi: 10.1038/s41598-019-39017-4. [DOI] [PMC free article] [PubMed] [Google Scholar]
- 21.Sinha P, Delucchi KL, McAuley DF, O’Kane CM, Matthay MA, Calfee CS. Development and validation of parsimonious algorithms to classify acute respiratory distress syndrome phenotypes: a secondary analysis of randomised controlled trials. Lancet Respir Med. 2020;8:247–257. doi: 10.1016/S2213-2600(19)30369-8. [DOI] [PMC free article] [PubMed] [Google Scholar]
- 22.Hager DN, Krishnan JA, Hayden DL, Brower RG ARDS Clinical Trials Network. Tidal volume reduction in patients with acute lung injury when plateau pressures are not high. Am J Respir Crit Care Med. 2005;172:1241–1245. doi: 10.1164/rccm.200501-048CP. [DOI] [PMC free article] [PubMed] [Google Scholar]
- 23.Lim TP, Luft UC. Alterations in lung compliance and functional residual capacity with posture. J Appl Physiol. 1959;14:164–166. doi: 10.1152/jappl.1959.14.2.164. [DOI] [PubMed] [Google Scholar]
- 24.Arnal JM, Garnero A, Saoli M, Chatburn RL. Parameters for simulation of adult subjects during mechanical ventilation. Respir Care. 2018;63:158–168. doi: 10.4187/respcare.05775. [DOI] [PubMed] [Google Scholar]
- 25.Gattinoni L, Caironi P, Cressoni M, Chiumello D, Ranieri VM, Quintel M, et al. Lung recruitment in patients with the acute respiratory distress syndrome. N Engl J Med. 2006;354:1775–1786. doi: 10.1056/NEJMoa052052. [DOI] [PubMed] [Google Scholar]
Associated Data
This section collects any data citations, data availability statements, or supplementary materials included in this article.