

Abstract
Somatic transposon expression in neural tissue is commonly considered as a measure of mobilization and has therefore been linked to neuropathology and organismal individuality. We combined genome sequencing data with single-cell mRNA sequencing of the same inbred fly strain to map transposon expression in the Drosophila midbrain and found that transposon expression patterns are highly stereotyped. Every detected transposon is resident in at least one cellular gene with a matching expression pattern. Bulk RNA sequencing from fly heads of the same strain revealed that coexpression is a physical link in the form of abundant chimeric transposon–gene mRNAs. We identified 264 genes where transposons introduce cryptic splice sites into the nascent transcript and thereby significantly expand the neural transcript repertoire. Some genes exclusively produce chimeric mRNAs with transposon sequence; on average, 11.6% of the mRNAs produced from a given gene are chimeric. Conversely, most transposon-containing transcripts are chimeric, which suggests that somatic expression of these transposons is largely driven by cellular genes. We propose that chimeric mRNAs produced by alternative splicing into polymorphic transposons, rather than transposon mobilization, may contribute to functional differences between individual cells and animals.
Transposons compose up to ∼50% of eukaryotic genomes (Britten and Kohne 1968; Ketchum et al. 2000; International Human Genome Sequencing Consortium 2001), and their mobilization in the germline contributes to chromosome evolution. Transposon activity comprises a wide array of molecular functions (Sienski et al. 2012; Bourque et al. 2018). Nonheritable de novo transposition in neural tissue may contribute to functional heterogeneity in the brain and to neurological disease (Muotri et al. 2005; Coufal et al. 2009; Baillie et al. 2011; Kazazian 2011; Evrony et al. 2012; Kazazian and Moran 2017; Schauer et al. 2018). However, it is difficult to map rare de novo transposon insertions using whole-genome DNA sequencing (Baillie et al. 2011; Evrony et al. 2012, 2016; Perrat et al. 2013; Upton et al. 2015; Treiber and Waddell 2017). Some studies therefore correlate neurodegeneration in animal models with changes in transposon expression (Li et al. 2012, 2013; Krug et al. 2017; Guo et al. 2018; Sun et al. 2018). Using elevated expression as a proxy for mobility could be misleading because it does not always result in de novo somatic transposition (Evrony et al. 2012, 2016; Treiber and Waddell 2017). It is therefore important to understand what controls neural expression of transposon-derived sequences.
Transposons often reside in introns where they can introduce splice sites producing chimeric mRNAs between the transposon and the relevant gene (Makałowski et al. 1994; Deininger 2011). Around 4% of human genes incorporate transposon sequences as novel exons (Nekrutenko and Li 2001), and 75% of human lncRNAs contain segments of transposon origin (Kapusta et al. 2013). However, it is unclear how chimeric transcripts from these loci contribute to the overall pool of transposon mRNAs in somatic cells. Reliable measurement of autonomous and nonautonomous transposon expression in somatic tissue is hampered by repetitive sequences being difficult to map and germline transposons being polymorphic (Lanciano and Cristofari 2020). Hence, many somatic transposon expression studies have analyzed single transposon families or have used bulk sequencing of tissues or cultured cells (Faulkner et al. 2009; Rangwala et al. 2009; Li et al. 2013; Philippe et al. 2016; Wang et al. 2016; Pinson et al. 2018; Babaian et al. 2019; Chung et al. 2019). A genome-wide assessment of the prevalence of chimeric transcripts requires that cellular expression of each transposon in the genome can be related to that of their surrounding genes. Technical developments in high-throughput single-cell transcriptomics of complex tissues, such as the fly brain, make this possible (Macosko et al. 2015; Croset et al. 2018).
Here, we used single-cell RNA-seq (scRNA-seq) to map transposon expression to individual cells in the Drosophila midbrain. Combining these data with high-coverage genomic DNA (gDNA) sequencing of the same inbred fly strain permitted neural transposon expression to be correlated with that of genes within which they are inserted. We confirmed these transposon–gene interactions by extracting mRNA from heads of the same strain and performing high-coverage bulk mRNA sequencing. Breakpoint-spanning sequences identified genome-wide splicing of host genes to transposons that generates a considerable diversity of mature chimeric mRNAs. We also present a quality-control approach using immobile genetic elements (IGEs) to quantify rates of amplification artifacts in bulk mRNA sequencing data. Finally, we analyze mRNA sequencing data from other fly strains to assess how chimeric transcripts vary between strains.
Results
Single-cell transcriptomics reveals cell type–restricted transposon expression
The Drosophila genome contains at least 112 transposon subfamilies, with copy number of an individual type ranging from a few to hundreds (Kaminker et al. 2002). Conventional scRNA-seq analyses typically discard sequencing reads that align to multiple genomic loci and therefore underestimate transposon expression. Multiply aligned scRNA-seq reads can be kept and their counts divided by the number of copies in the genome. However, germline insertions in the reference genome are likely to differ substantially from insertions in our tested fly strain, making quantification of their expression inaccurate. We therefore devised an alternative analysis pipeline to map expression of all transposons within scRNA-seq data (scTE-seq). scTE-seq masks repetitive sequences in the reference genome and adds a single copy of the consensus sequence for every known transposon to this masked genome. This produces a Drosophila reference genome with one copy of each transposon subfamily. We used this modified reference genome to map transposon and gene reads onto individual midbrain cells from a fly strain expressing mCherry in αβ Kenyon cells (KCs) of the mushroom body (MB), henceforth called αβCherry flies. We found evidence for expression of the sense and antisense strands of most transposons, which composed 75.5% and 24.5% (±1.9% SD) of all transposon expression, respectively (Supplemental Fig. S1; Supplemental Table S1). We verified our mapping approach reliably captured transposon reads by comparing our results from scTE-seq to those obtained using RepEnrich2 (Criscione et al. 2014). Counts computed by RepEnrich2 were strongly correlated with the number of uniquely mapping reads identified by scTE-seq (R2= 0.661) (Supplemental Fig. S2). Therefore, mapping to consensus sequences did not bias transposon expression levels. We clustered cells from the midbrain and assigned many clusters to known cell types using marker gene expression (Fig. 1A; Croset et al. 2018). Displaying transposons on the cluster plot revealed some to be up-regulated in specific cell types. For example, the long-terminal repeat (LTR) retrotransposons copia and opus were elevated in the αβ, α′β′, and γ KCs (Fig. 1B, left) and α′β′ KCs (Fig. 1C, left), respectively. Other LTR retrotransposons such as micropia were up-regulated in the ellipsoid body (Fig. 1D, first graph), whereas blood and 412 were higher in glia (Fig. 1E,F, left).
Figure 1.

Single-cell transcriptomics reveals patterned transposon expression in the Drosophila midbrain. (A) Two-dimensional reduction (t-SNE) of 14,804 Drosophila midbrain cells based on gene expression levels. Colors represent cell clusters (at SNN resolution of 3.5). (B–F) Mean expression of transposons and neighboring cellular genes in the relevant cell groups in eight biological replicates and t-SNE representation of cell type–restricted expression. (B) copia and twin of eyeless (toy) in all Kenyon Cell (KC) classes. (C) opus and mushroom-body expressed (mub) in α′β′ KCs. (D) micropia and Rhodopsin 7 (Rh7) in the ellipsoid body. (E,F) blood and CG32521, and 412 and Tequila (teq) in glia. Values represent the mean normalized number of unique molecular identifiers (UMI's) in an average cell from each cell type and from the rest of the midbrain. Error bar indicates SEM. Transposon and gene levels were normalized separately. Blue schematic shows location of cell cluster (pink) in t-SNE plot. (G) Two-dimensional reduction of 14,804 Drosophila midbrain cells based exclusively on transposon expression levels. Colors represent cell clusters (at SNN resolution of 3.5). (H,I) Mean expression of Stalker2 and Heat-shock-protein-70Bc (Hsp70Bc), and Doc and Furin 1 (Fur1) in their relevant transposon clusters and the position of the cluster in the overall transposon-based t-SNE (indicated in pink).
Transposon expression correlates with that of cellular genes they are inserted within
We reasoned that transposon expression might be elevated in specific cells because a copy of that transposon is inserted in a gene that is highly expressed in the same cells. To test this hypothesis, we took our previously published high-coverage gDNA sequence of αβCherry flies and mapped the germline transposon insertions in these flies using TEchim, a custom-built transposon analysis program. TEchim uses STAR aligner (Dobin et al. 2013), to screen sequencing data for reads that span the junction between a genomic locus and a consensus transposon sequence, and BLAST (Altschul et al. 1990), to extract information about the transposon insertion site at single-nucleotide resolution. The aim of TEchim is to extract high-fidelity contiguous breakpoint-spanning reads, which distinguishes it from other approaches such as those combined in the integrated analysis pipeline “McClintock” (Nelson et al. 2017). TEchim generates nucleotide contigs from gDNA or cDNA sequencing reads, then creates in silico paired-end reads and screens them for cases in which one end maps to a gene and the mate read maps to a transposon. Because these in silico reads are derived from contiguous sequences, one can refer back to the original reads to determine transposon–gene breakpoint sequence. TEchim also generates sequencing coverage around insertion sites, which permits estimation of the population frequency of germline insertions. Our gDNA data from 10 individual flies revealed a range of population frequencies for transposons in inter- and intragenic regions (Supplemental Table S2). In the subsequent analyses we focus on insertions detected in at least 50% of flies tested. We found highly penetrant copia, opus, micropia, blood, and 412 insertions in twin of eyeless (toy), mushroom-body expressed (mub), Rhodopsin 7 (Rh7), CG32521, and Tequila (teq), respectively. Expression of these genes mirrored the pattern of the transposon they harbored (Fig. 1B–F, right). Neural expression of these transposons in αβCherry flies therefore appears to be driven by these nearby genes.
We next assessed whether all our annotated transposons showed patterned midbrain expression. Reclustering the scRNA-seq data using transposon expression generated 78 clusters that mostly contained cells from all eight biological replicates (Fig. 1G; Supplemental Fig. S3), indicative of stereotyped transposon expression between different flies from the same strain. Analysis of cellular gene expression across the transposon clusters showed that many clusters preferentially expressed certain genes. For example, the cluster expressing Stalker2 LTR was enriched for cells also expressing Heat-shock-protein-70Bc (Hsp70Bc) (Fig. 1H), and cells in the Doc-cluster had high Furin 1 (Fur1) (Fig. 1I). Referring back to the gDNA revealed that αβCherry flies harbor a Stalker2 copy within Hsp70Bc and a LINE-like Doc element inside Fur1. Again, these data suggest expression of Stalker2 and Doc is driven by a neighboring gene.
Quantitative analysis reveals high-fidelity transposon–gene coexpression
Our gDNA analysis also revealed many transposons inside genes that were more broadly expressed across the brain. In total, we identified 4306 germline transposons (Supplemental Table S2 displays all sites where the upstream breakpoint was detected in at least 50% of flies tested); 2163 of these lie outside and 2143 sit within a gene, henceforth denoted the neighboring gene. Of these, 910 cases were inserted in the same direction as the gene, 1175 in antisense orientation and 58 in loci within genes in both orientations. To quantify the correlated expression of transposons and cellular genes, we devised a method based on the Hardy-Weinberg principle for quantifying linkage equilibrium of two alleles in population genetics (Fig. 2A; Lewontin and Kojima 1960). We binarized our scRNA-seq data to generate the equivalent of biallelic traits in a population (Methods). The proportion of cells expressing a specific transposon was calculated, multiplied by the proportion of cells expressing a certain gene, and then this value was subtracted from the proportion of cells that expressed both the transposon and gene. We termed this value the coexpression disequilibrium (CD). These CD values were normalized to account for variable abundance of each transposon and gene in every transposon–gene pair, and the analysis was repeated for all transposon–transposon and gene–gene pairs. Normalized values were then ranked within each of the eight biological replicates, and P-values calculated and corrected for multiple comparisons (Benjamini–Hochberg). These values describe the probability that a transposon–gene pair would have such a highly ranked CD across multiple replicates if they were expressed independently.
Figure 2.

Most transposons are coexpressed with neighboring genes. (A) Schematic and formulas describing the calculation of coexpression disequilibrium (CDAX) values. (B) Examples of transposon–gene pairs that are neighboring in the genome and coexpressed across the midbrain. Height of pink bars shows relative transposon expression levels in scRNA-seq data. Transposons contributing to >0.5% of overall transposon expression, indicated by dark orange bar on the bottom left, are individually displayed, and the associated gene with the lowest corrected P-value is indicated for each one. Transposons contributing <0.5%, indicated by light orange bar on the top left, are pooled into sense and antisense expression. Transposons are also organized horizontally into sense (left side of plot marked with dark yellow bar on top) and antisense expressing elements (right side of plot, light yellow). See Supplemental Table S3 for the entire list of correlated transposon–gene pairs.
We combined the list of all detected germline transposon insertions in αβCherry flies with the scRNA-seq data generated from these flies and calculated CD values between every transposon and its neighboring gene (Supplemental Table S3). For all transposons that contributed to ≥0.5% of overall expression we found at least one copy inside a gene that showed a correlated expression pattern (Benjamini–Hochberg corrected P < 0.05) (Fig. 2B). Exceptions were the telomeric TART, TART-A, and HeT-A, which are likely to be autonomously expressed. Transposons inserted in the same orientation as the gene's transcription unit had correlated expression of the sense strand of the transposon with that of the gene. In contrast, the antisense strand was correlated for reverse orientation transposons. Since the number of transposon copies, and therefore the number of potentially correlated neighboring genes, varied between 1 (e.g., accord, 1731, Tirant, and so forth) and 91 for roo in an antisense orientation, we tested whether the same number of randomly chosen (not neighboring) genes would show similar coexpression patterns with transposons. We randomly selected 10 sets of 2143 genes and counted the number of transposon–gene pairs with correlated expression (below the P-value threshold of 0.05) in each gene set. We then performed a χ2 test using the mean number of randomly correlated pairs as the expected frequency if there was no interaction between transposons and neighboring genes (Supplemental Table S4). These analyses showed that a neighboring gene significantly influences the expression pattern of almost all transposons in the fly brain.
Transposons become part of chimeric transcripts with cellular mRNAs
We next tested whether observed coexpression of transposons and neighboring genes might result from chimeric mRNAs formed from the transposon–gene pairs. We extracted mRNA from αβCherry fly heads and generated 250-bp-long reads that were screened for chimeras using TEchim. Incorporating a function in TEchim that maintains strand specificity of input reads enabled unambiguous assignment of chimeras to cellular genes. We found that a large number of intronic transposons give rise to chimeric pre-mRNAs. In total, we retrieved chimeric mRNA segments from 4732 different genomic loci, with 2430 spanning a gene-to-transposon (5′ to 3′) and 2302 a transposon-to-gene junction (Supplemental Table S5). These pre-mRNAs were polyadenylated and frequently contained intron and transposon sequences. Importantly, qPCR-, bulk-, and scRNA-seq analyses would count these transposon-containing pre-mRNAs as evidence for transposon expression. Chimeras included sequences from LTR, LINE-like, and DNA transposons attached to mRNAs from genes involved in many biological processes. For example, we found sequence from the LTR retrotransposon gypsy in transcripts of the ubiquitin gene Ubi-P5E and of highwire (hiw), encoding a neuron specific ubiquitin ligase, the non-LTR element Doc in Fur1, encoding a synaptic membrane bound protease, and the TIR element hobo attached to transcripts from Shaker, which encodes a voltage-gated potassium channel (Kaplan and Trout 1969; Roebroek et al. 1991; Izquierdo 1994; Wan et al. 2000).
Immobile genetic elements generate a threshold to exclude amplification artifacts
Previous studies of transposon mapping have established that in vitro amplification of DNA often leads to chimeric amplification artifacts (Evrony et al. 2016; Treiber and Waddell 2017). We therefore accounted for similar errors in our mRNA data by calculating the rate of amplification artifacts with 10 sets of 167 exons that were expressed at the same level as each transposon. These exons cannot relocate in gDNA, so we name them immobile genetic elements (IGEs) because IGEs should only occur in one location in gDNA from αβCherry flies. Chimeric reads between IGEs and other genes most likely represent amplification artifacts. As expected, the rate of generating IGE chimeras was correlated to the expression level of the IGE and the gene with which it formed a chimeric molecule. Critically, the IGE chimera rate was substantially lower than that formed between genes and transposons (Fig. 3A). We therefore used prevalence of IGE chimeras to define a false discovery rate (FDR) of 0.05%. The FDR was calculated by dividing the number of IGE chimeras per total chimeras (i.e., including transposon chimeras). This 0.05% threshold resulted in an average of 1.9 IGE hits per 2165 total chimeras (Supplemental Fig. S4; Supplemental Table S6). All chimeric transcripts presented in this study were detected with an FDR <0.05%.
Figure 3.
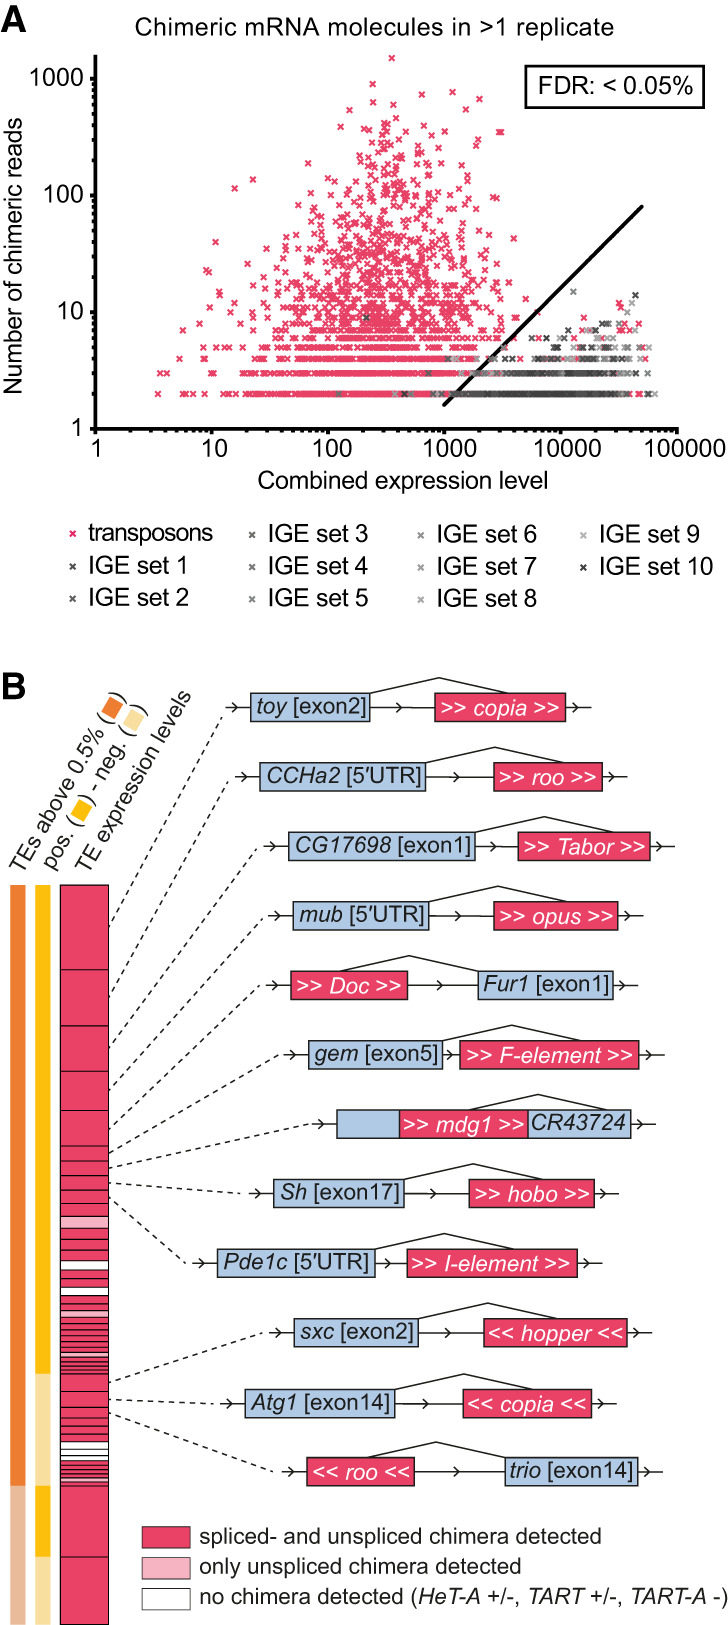
Chimeric transposon–gene mRNA is abundant in the midbrain. (A) Graph showing number of chimeric reads, combined expression levels of each transposon–gene pair (pink), and in 10 sets of IGE-gene pairs (gray). Combined expression levels are the square root of the product of reads in our bulk RNA data for both transcripts of a transposon/IGE-gene pair. IGEs were used to calculate a FDR<0.05%. (B) Examples of transposon–gene pairs for which chimeric mRNAs were detected. Pink bar represents total transposon expression in scRNA-seq data (as in Fig. 2B), grouped into sense and antisense, as well as contributing to >0.5% and <0.5% of total transposon expression. Dark pink bars indicate that both pre-mRNA and mature spliced mRNA chimeric fragments were detected. Light pink indicates only unspliced chimeras were found. Schematics show splice sites between transposon and the neighboring gene (gray and pink boxes are not to scale). For list of all chimeras, see Supplemental Table S5.
Many transposons introduce cryptic alternative splice sites into cellular genes
Transposon sequences could be removed from the unspliced chimeric pre-mRNAs to yield intact host mRNAs and full-length transposon sequences. However, for most transposon subfamilies, we found at least one neural gene where breakpoint-spanning reads indicate that specific sections of a transposon are spliced into host-gene transcripts (Fig. 3B; Supplemental Table S5, spliced insertions are labeled in column 2). Analysis of the breakpoints inside transposons at these 264 sites revealed that chimeras were formed at conserved locations in each transposon type. For example, where antisense roo resided within an intron, we found transcripts where the 3′ end of an upstream exon was fused to either a section of roo beginning at position 5460 (for 19 different loci) or 2094 (three loci), and also at several additional breakpoints with lower frequency (Fig. 4A,B). In addition, we identified transcripts where sections of roo were bound to the 5′ end of a downstream exon. 3′ Breakpoints at position 5191 of roo spliced into transcripts of 24 genes, two genes from position 2783 of roo, and several others from unique positions in roo. (Note numbering runs backward because it relates to forward orientation of roo.) Whereas intronic antisense roo provided gene-to-transposon breakpoints for 28 exons, and transposon-to-gene breakpoints for 33, intronic sense roo only introduced 4 and 1, respectively (Supplemental Table S5). Similarly, the LTR blood contributed more breakpoints when inserted in antisense orientation relative to the host gene (14 vs. six) (Fig. 4C; Supplemental Table S5).
Figure 4.

Transposons introduce splice sites at conserved locations. (A) Key for labeling scheme in B and C. Pink bar represents the transposon; light pink ends indicate LTRs, and dark pink indicates the core sequence. Positions of dots above the bar represent sites on the transposon where an upstream exon splice donor (SD) has merged. Every dot represents a different gene. Black lines in the top half of pink bar represent splice-acceptor (SA) motifs in the transposon. Dots below the pink bar indicate location of breakpoints on the transposon that splice to upstream exonic SA sites of different genes. Bars in the lower half indicate SD motifs. (B,C) Representations of antisense roo and blood (to scale), with all breakpoints to SA and SD sites of neighboring genes. The frequently used site on antisense roo at position 5191 is a nonconsensus SD site, lacking the expected GT motif at the immediate breakpoint. The sequence around 5191 resembles a consensus SD motif, although the GT is a GC. Compare TTTGGCAAGTT to motif in Supplemental Figure S5A. (D) Illustration of antisense roo insertion in the mustard (mtd) gene. Only one isoform of mtd is shown. Yellow box represents 5′ UTR, blue boxes are exons, orange box 3′ UTR, pink represents roo transposon with white arrows indicating LTRs. Breakpoint-spanning gDNA reads reveal target site duplication (TSD; inset). (E) Schematic of original mtd transcript and of three new splice isoforms.
We screened transposon sections around breakpoints for consensus splice-acceptor (SA) and donor (SD) sequence motifs. Often gene-to-transposon chimeras formed at SA consensus motifs, and transposon-to-gene chimeras at SD motifs (Supplemental Fig. S5; Supplemental Table S7; Stephens and Schneider 1992). For example, all breakpoints in antisense blood formed with more than one exon were precisely located at predicted SA and SD splice sites (see vertical lines in Fig. 4C). A consensus SD motif was not evident at position 5191 of antisense roo, although it frequently provided 5′ sequence to transposon-to-gene chimeric RNAs (Fig. 4B). However, sequence around position 5191 resembles the consensus, with exception of a GT-to-GC conversion (Supplemental Fig. S5). Taken together, our analysis revealed that transposons introduce many alternative splice sites, which are recognized by the host cell spliceosome to join cellular exons to sections of transposon.
We also identified alternative splicing to different sites within the same transposon insertion. Again using roo as an example, αβCherry flies harbor an intronic reverse orientation roo in the pan-neurally expressed mustard (mtd) gene, which to date has only been implicated in innate immunity (Fig. 4D; Wang et al. 2012). The wild-type mtd locus produces many splice variants, and RNA-seq revealed a complex collection of additional mtd splice variants that incorporated different roo fragments (Fig. 4E). SD sites upstream of this roo came from either mtd exon 11 or 13 (annotated exons are numbered backward), and these spliced to the SA at position 5462 within roo (Fig. 4E). Three different SD sites (at positions 641, 2784, and 5191) within roo spliced out to the closest downstream SA (exon 6) of mtd. This roo substantially increases the mtd mRNA isoform repertoire; without roo the locus can express 23 mtd isoforms, but with roo it can generate 68 differentially spliced mRNAs.
The transcript diversity of 263 other genes was similarly increased by a transposon. These transcripts incorporate 66 different transposon families with each introducing cryptic SA and/or SD sites into host genes (see Supplemental Table S5). For example, chimeric reads indicate that transcription of Dscam2, which encodes the transmembrane Down Syndrome cell adhesion molecule 2, is frequently initiated inside a sense insertion of blood that spliced into exon 33 (the second exon) of Dscam2. This splicing combines ORF2 of blood with the remaining Dscam2 exons and aligns the reading frames, generating a novel N terminus (Supplemental Fig. S6). We also found evidence of transposons resulting in exon skipping (e.g., 412 inside Tequila) (Supplemental Fig. S7). Most transposon chimeras resulted from intronic insertions. However, an exonic hobo in the CG31705 gene introduced a cryptic SA spliced to the upstream SD from the first CG31705 exon, creating a truncated mRNA (Supplemental Fig. S8). These data show that many Drosophila transposons are alternatively spliced into cellular mRNAs increasing the isoforms of a large number of neurally expressed genes.
Alternative splicing into and out of transposons can be highly penetrant
Chimeric transcripts could be inconsequential if they only constitute a small percentage of the overall transcript repertoire of a gene. To quantify how frequently a transposon-harboring gene produces chimeric mRNAs, we analyzed loci where a transposon splices into an exon–intron junction. For each gene we counted the number of reads spanning the transposon-exon boundary, and the number spanning the exon immediately upstream of and downstream from the transposon. For some genes, most mRNAs contained transposon sequences. For example, 95.3% of all Rhodopsin 7 transcripts included micropia in the 3′ UTR (Fig. 5A), and all mRNAs of the Allatostatin C receptor 1 (AstC-R1) contained a section of F-element, spliced into one of two different SA sites in the gene (Fig. 5B). In addition to the blood insertion in Dscam2 mentioned above, we also found a Doc insertion in Dscam2, which contributed to around a third of all transcripts initiated at the Dscam2 transcription start site (Fig. 5C). We also found a sense-orientation flea in the X-linked cacophony (cac), which encodes a voltage-gated calcium channel (Smith et al. 1996). This flea insertion truncated 12.4% of cac transcripts, potentially deleting the last 8–11 coding exons and suggesting that many αβCherry males are likely mutant for the cac gene (Supplemental Fig. S9). Another interesting example on the X Chromosome of αβCherry flies is a sense opus insertion in Beadex (Bx), which encodes a long-term memory relevant LIM-type transcription factor (Hirano et al. 2016). This opus produces at least two new Bx mRNAs (Supplemental Fig. S10), which constitute 4.9% of all Bx transcripts. On average, transposons contributed 11.6% of transcripts derived from a gene (Supplemental Table S5).
Figure 5.
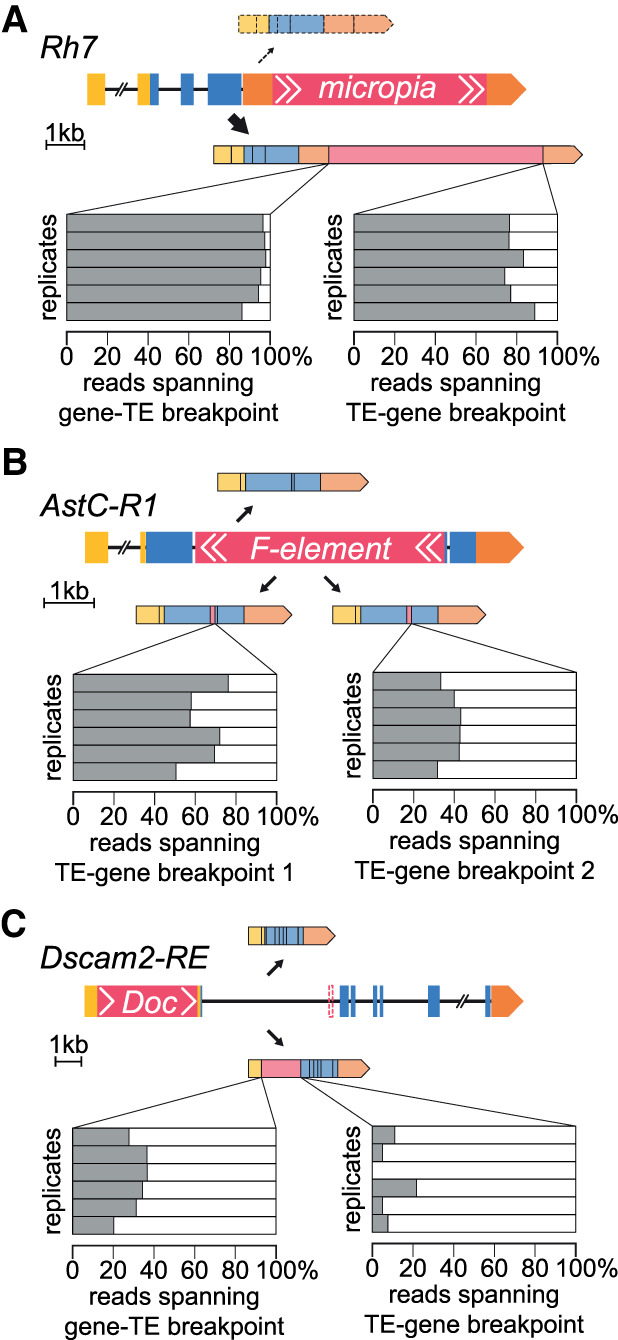
High penetrance of transposon-containing splice isoforms. (A) Schematic showing Rhodopsin 7 locus harboring a sense micropia in the 3′ UTR and two splice isoforms. Gray bars show percentage of reads spanning the gene-TE (left) and TE-gene (right) breakpoint in each of the six tested replicates. (B) The AstC-R1 gene harbors an antisense F-element immediately upstream of the second exon that introduces cryptic splice sites. Three spliced isoforms are shown. (C) Dscam2 harbors a sense Doc in its 5′ UTR (in addition to a blood insertion in its first intron) (Supplemental Fig. S6). For ease of visualization, only the shortest Dscam2 isoform, RE, is depicted. The blood insertion is indicated with a dashed box. See Supplemental Table S5 for complete list.
Splicing into transposons is common and varies between strains
Transposons are highly variable between fly strains. We therefore analyzed three previously published mRNA sequencing data sets from other fly strains for chimeric transposon–gene mRNAs (MacKay et al. 2012; Croset et al. 2018; Hemphill et al. 2018). Although these prior studies generated shorter paired-end RNA-seq reads, we still found chimeric mRNAs in all three data sets (Supplemental Table S8). Some chimeras were conserved across all strains, whereas others appeared to be strain specific. Of the 1332 chimeras identified in at least two samples of αβCherry flies, 466 were present in at least one of the three other strains and 92 occurred in all four strains. Chimeras that were not detected in other strains could indicate genomic heterogeneity between strains or absence of evidence resulting from lower sequencing coverage. Nevertheless, these results show the prevalence of cellular mRNAs containing transposon sequence.
Transposon expression is predominantly nonautonomous
Finding that neural expression of consensus transposon sequences is highly correlated with at least one neighboring gene, and that most transposon sequence is part of spliced chimeric mRNAs, implies that expression is largely driven by neighboring genes. Testing this hypothesis further requires comparing the number of reads mapping to a specific transposon with the abundance of breakpoint-spanning reads for that same transposon. However, most transposons are multicopy (six is the median copy number in αβCherry flies) (Supplemental Table S3), so a read mapping inside a transposon cannot be assigned to a specific copy. To overcome these challenges, we quantified the average number of reads that only map to a given transposon consensus sequence (TE-only) per nucleotide for each transposon across our six biological replicates. Next, we counted the number of locus-specific reads that span each transposon and a genomic region (TE-gene). We reasoned that autonomous transposon expression should exclusively generate TE-only reads, whereas nonautonomous expression driven by a neighboring gene should generate similar numbers of TE-only and TE-gene reads. The number of TE-gene reads was higher than the average number of TE-only reads (normalized to transposon length) for every transposon tested (Fig. 6A; Supplemental Table S9), suggesting expression is nonautonomous. We also tested autonomous versus nonautonomous expression by analyzing transposons with LTRs at both ends. Autonomous expression of LTR elements should not result in reads upstream of the element's 5′ LTR (5′-gene-LTR-3′ reads). Quantifying the ratio of 5′-gene-LTR-3′ reads and 5′-LTR-TE-3′ reads revealed that most LTR retrotransposons expressed in the head generate roughly equivalent numbers of each fragment. Breakpoint-spanning reads at the 3′ ends of LTR retrotransposons revealed a similar situation (Fig. 6B; Supplemental Table S10). These analyses provide further evidence that LTR transposons are predominantly expressed as chimeric mRNAs with cellular genes, rather than as autonomous elements.
Figure 6.

LTR retrotransposon expression is predominantly nonautonomous. (A) Plot showing the average number of reads per nucleotide (x-axis) and total number of transposon–gene spanning reads (y-axis) for every tested transposon. Number of spanning reads is higher for every transposon. (B) List of all LTR retrotransposons analyzed in mRNA data. LTR-gene spanning reads were identified for every LTR transposon expressed in the midbrain. Numbers represent percentage of reads spanning LTR-gene versus LTR-TE breakpoints. Values are capped at 100%, but some transposons produced more LTR-gene than LTR-TE reads (Supplemental Table S10). Error bars represent standard deviation. (*) Transposon reference sequences did not contain LTR sections for the five transposons.
Discussion
Combining single-cell expression data from the Drosophila midbrain with high-coverage gDNA sequence of the same fly strain revealed that most transposons are expressed as parts of chimeric mRNAs with cellular genes.
Several prior studies have documented that transposons are transcriptionally active in somatic tissue. These reports used methods that either generate cDNA fragments (RNA-seq) (e.g., De Cecco et al. 2013) or amplify short sections of transposon mRNAs (RT-qPCR) (e.g., Li et al. 2013; Guo et al. 2018; Sun et al. 2018). However, these approaches cannot distinguish between autonomous transposon expression and chimeric transposon–gene mRNAs investigated in this study. Baseline and changing cell-specific expression of host genes that produce chimeric transcripts with transposons could therefore be misinterpreted as cell-restricted autonomous transposon expression with potential for mobilization.
Some studies of transposon expression use cap analysis gene expression (CAGE) to distinguish pre-mRNA from 5′ ends of mature mRNAs (Faulkner et al. 2009). Although CAGE reads mapped to transposons represent transcripts where transcription started within a transposon, we identified 243 chimeras that initiated inside (or at the start of) a transposon and spliced into a downstream exon of a gene (Supplemental Table S5). Short 5′ end CAGE reads would rarely identify such chimeric transcripts. In theory, a combination of long-read sequencing—for example, Pacific Biosciences (PacBio) (Rhoads and Au 2015) or nanopore (Deamer et al. 2016)—and ways to identify 5′ caps and 3′ poly(A) tails could discover full-length transposon mRNAs.
Our study illustrates the utility of the Drosophila brain to study genome-wide expression of transposons. The single-cell atlases of the entire brain allow transposon expression to be assigned to specific cell types (Croset et al. 2018; Davie et al. 2018; Konstantinides et al. 2018; Allen et al. 2020). This is made easier by transposon subfamilies in Drosophila being very discrete, with even related elements having different sequence. In addition, some of these transposons are low copy and even detected within one gene (Supplemental Table S3). This makes it simple to map their expression to cells and to significantly correlate their expression to that of a neighboring gene. In contrast, for a high copy number transposon resident in more than 10,000 genes (cf. LINE-1 in most mammalian genomes), it becomes impossible to distinguish a correlation from chance, because the transposon expression would also be correlated with at least one of 10,000 randomly chosen genes.
We complemented scRNA-seq analyses of transposon coexpression with neighboring genes with discovery of more than 833 chimeric transposon–gene transcripts using bulk RNA-seq. Chimeric transposon–gene fragments were identified in previous studies, with some focusing on individual genes and others analyzing exonized transposons genome-wide (Nekrutenko and Li 2001; Van De Lagemaat et al. 2003; Kapusta et al. 2013). However, to our knowledge, no other study investigated the proportion of transposon expression in somatic cells that comprises exonized transposon fragments. We found that transposon exonization is highly prevalent in the Drosophila brain and is likely the main driver of somatic transposon expression. Because we mapped reads to consensus transposon sequences, we may have missed exonization of older transposons that have accumulated many mutations.
We introduce three new pieces of software that should be helpful to other researchers in the field. Although they were developed to analyze Drosophila data, they can be readily adapted for sequence data from other species. The three main components are (1) scTE-seq, a tool to map scRNA-seq data onto a masked reference genome and consensus transposon sequences, (2) scRNA-seq-Hardy-Weinberg (scHW), which implements the new method presented here to analyze expression correlations, and (3) TEchim, which combines all analysis steps for identification, characterization, and quantification of chimeric transcripts in bulk mRNA sequencing data and includes IGE analysis to determine the rate of amplification artifacts for each sample.
We found the expression of many transposons to be restricted to small groups of cells. For example, blood was highly expressed in most glia, but silent in neurons. In contrast, gypsy was detected in some neurons but was absent in glia. Somatic transposition in neurons and glia has been implicated in age-dependent neuronal decline in wild-type and disease models of Drosophila (Li et al. 2013; Guo et al. 2018; Sun et al. 2018). Our results constrain these models because mobilization can only occur in cells that express full-length elements or transposon mRNAs that encode enzymes permitting other elements to move in trans. Therefore, the gypsy retrotransposon is only likely to mobilize in glia if the fly strain studied harbors a copy of gypsy in a glial-expressed gene (Krug et al. 2017). Expression below that typically detectable using scRNA-seq could generate full-length transposon mRNAs that reintegrate in the genome. For example, two LINE-1 elements on human Chromosomes 8 and 13 were shown to mobilize in the human brain (Evrony et al. 2015; Sanchez-Luque et al. 2019). However, data in this study, which include higher coverage bulk sequencing data, and our earlier study of the rate of somatic transposition (Treiber and Waddell 2017) indicate that transposon transcripts in the fly brain most frequently represent diversification of the neural transcriptome rather than mobilization.
At this stage we are unable to conclusively show the biological impact of transposon–gene chimeras. The process of transposable elements acquiring new cellular functions that benefit the host cell has been coined transposon “exaptation” (Gould and Vrba 1982). A striking example of this is the neuronally expressed Drosophila and rodent Arc proteins, which resemble Ty3/gypsy retrotransposon-encoded gag. Arc also forms virus-like capsids and binds sequences in the 3′ UTR of Arc mRNAs, which enables their intercellular transport (Zhang et al. 2015; Ashley et al. 2018; Pastuzyn et al. 2018). We found a broad range of neural genes for which a substantial proportion of their mature mRNA transcript pool contained transposon sequences. Sometimes transposon sequence is within the open reading frame, and other times it is positioned in 5′ or 3′ UTRs where it could alter traffic and/or translation. However, it is difficult to determine the whole-genome functional consequence of splicing into transposons because we often only retrieve the sequence across the splice junctions. Furthermore, although each transposon has a known consensus sequence, individual copies are polymorphic. Nevertheless, our sequencing shows that transposon exonization often truncates and/or changes the amino acid sequence of the encoded proteins, potentially changing structure and function. We also identified several examples in which inclusion of transposon sequence conserved the reading frame of the host gene and may generate a novel chimeric protein. Among the 264 transposon-harboring genes identified in this study, there are several that we have described in detail for which disruption and altered expression of the locus would be expected to have significant consequences for neural function. Flies harboring hobo in Sh and flea in cac might show altered voltage-gated currents, whereas those with roo in AstA-R1 will respond differently to the modulatory Allatostatin A neuropeptide (Smith et al. 1996; Larsen et al. 2001). We also described insertions of 412 in teq and opus in Bx, two genes which have been implicated in long-term memory formation (Didelot et al. 2006; Hirano et al. 2016). The 412 insertion in teq is particularly interesting in light of several behavioral studies that have used a mutant fly strain in which teq function is apparently impaired by a piggyBac transposon in the 3′ UTR (Thibault et al. 2004; Didelot et al. 2006). It seems likely that a 412 in the coding region will have at least as disruptive an effect on teq function as a 3′ UTR insertion.
We also discovered many cases in which a single intronic transposon introduced several cryptic splice sites, and thereby increased the transcript repertoire of the host gene. For example, the antisense roo inside the innate-immunity gene mtd resulted in many new predicted protein isoforms. This roo insertion could increase allele diversity and enable the innate immune system to broaden its effectiveness against a wider range of pathogens.
RNA-seq data from other fly strains suggests that more than half of the chimeric transposon transcripts identified in αβCherry flies are unique to this strain. This finding alone shows the incredible heterogeneity of transposons between strains. In addition, our prior genome sequencing revealed large differences between individual αβCherry flies (Treiber and Waddell 2017). It seems likely that polymorphic transposons and differential distribution across the genome could contribute toward heterogeneity of neural function, and neurological pathology, between individual animals.
Methods
Fly strains
All experiments used αβCherry flies, which were generated by crossing MB008b females (Aso et al. 2014) with w1118; +; UAS-mCherry males. Flies were raised on standard molasses food at 25°C, 40%–50% humidity, and 12 h:12 h light-dark cycles.
Bulk mRNA sequencing
For RNA extraction, groups of about 50 flies were frozen in liquid nitrogen and vortexed for 6 × 30 sec to separate body segments. Heads were isolated using a sieve. To avoid gDNA contamination, mRNA was purified with a combination of protocols. Samples were first processed with a column-based kit (RNeasy Mini kit, Qiagen), including on-column DNase I digestion. Next, mRNA was extracted from total RNA using oligo(dT) magnetic beads (NEB), and mRNA was purified again using RNA columns. Finally, sequencing libraries were generated using oligo(dT) magnetic beads from a strand-specific mRNA library preparation kit (TruSeq, Illumina), with 17 cycles of PCR amplification. Fragmentation was optimized to obtain ∼350-nt-long fragments. Whole-genome sequencing was performed on a HiSeq 2500, with 250-nt paired-end reads.
Single-cell read alignments
The Drosophila melanogaster reference genome release 6.25 was used for all sequence alignments (Hoskins et al. 2015). Transposon reference sequences were from Repbase (Jurka 2000; Kaminker et al. 2002). Repetitive sequences in the Drosophila reference genome were masked using RepeatMasker (Smit et al. 2015), and a single consensus sequence copy of each transposon was added to the reference genome. Consequently, each transposon was treated as a separate “chromosome” by the downstream analysis software. Single-cell sequencing data was processed with the Drop-seq pipeline, as described (Macosko et al. 2015; Croset et al. 2018), and Digital Gene Expression (DGE) matrices were processed using Seurat in R (R Core Team 2017; Butler et al. 2018). A detailed protocol is provided in the Supplemental Methods. The modified reference genome and refFlat file are provided as Supplemental Files 1 and 2. Mapping efficiency was assessed by comparing the number of reads mapped to consensus transposon sequences with fractional read counts estimated by RepEnrich2. Consensus reads were quantified using SAMtools idxstats on the sorted and indexed output BAM files following STAR alignment in the scTE-seq pipeline. Fractional read counts were computed using standard RepEnrich2 parameters and the most recent transposon insertion library downloaded from RepeatMasker (db20140131) for each of the eight biological replicates. Least-square linear regression was computed using GraphPad Prism (version 8) with default parameters.
Coexpression analysis
Expression levels of every annotated gene and transposon (i.e., feature) were binarized (expression ON/OFF) in the scRNA-seq data using a dynamic threshold for UMI counts. The threshold was chosen to separate the lower third of UMI counts (OFF) from the rest (ON). Next, the coexpression disequilibrium (CD) was calculated for each transposon–gene pair as described in the main text and Figure 2A, resulting in a CD-matrix. Normalized CD values of each transposon with every feature were ranked in each replicate. For coexpression analysis, the mean ranks across all eight replicates of all features were first calculated. Next, a one-sample t-test was conducted with each CD value and with the expected value µ set to the mean ranks. P-values were corrected for multiple comparisons using Benjamini–Hochberg correction. This process was repeated with a set of 10 randomly assigned features for each transposon. Finally, a χ2 test was performed with the number of correlated features between each transposon and a randomly assigned feature as the expected value. Statistical analyses were performed in R.
Mapping transposon insertions (gDNA and mRNA)
Germline transposon insertions were mapped with single-nucleotide resolution using previously published gDNA data from αβCherry flies (Treiber and Waddell 2017). Chimeric transcripts were detected by analyzing bulk mRNA data generated for this study. A new, purpose-built, multifunctional sequence analysis pipeline called TEchim was developed for both these tasks. TEchim has six key functions: (1) generation of support files, including a masked reference genome and endogenous intron–exon junctions (input files: reference genome, list of genes, list of transposon sequences); (2) alignment of unstranded genomic DNA sequence data of multiple sequencing lanes and multiple biological replicates, detection of chimeric sequence fragments with single-nucleotide resolution, the sequencing coverage around insertion sites, and the generation of summary output tables; (3) alignment of stranded cDNA data, detection of chimeric fragments, and quantification of reads; (4) generation of matching immobile genetic elements (IGEs, see main text) and analysis of these IGEs (these data are then used to determine sample-specific detection thresholds); (5) quantification of LTR-gene and LTR-transposon reads (Fig. 6B); and (6) quantification of locus-specific breakpoint-spanning reads. For key function 1, the reference genome was first masked using RepeatMasker (Smit et al. 2015) [parameters: -no_is -s] using the same library of transposon consensus sequences as for mapping the scRNA-seq data (see above). In addition, several files were created that contain information about gene features and that were required for subsequent TEchim analysis steps. For key functions 2 and 3, paired-end sequencing reads were first merged using FLASH (Magoč and Salzberg 2011) [parameters: -x 0.15 (maximum allowed ratio between the number of mismatched base pairs and the overlap length) -M 170 (maximum overlap)]. Next, in silico paired-end reads were generated from contiguous sequences. For cDNA input, the strandedness was preserved throughout the analysis. In silico reads were aligned using the STAR aligner (Dobin et al. 2013) and the masked genome (described above) [parameters: ‐‐chimSegmentMin 20 ‐‐chimOutType WithinBAM ‐‐outSAMtype BAM SortedByCoordinate]. For those in silico read pairs in which one read mapped onto a transposon sequence and their mate read mapped to a genomic locus in the masked reference genome, long-read contigs were taken and aligned to (1) the masked reference genome and (2) to consensus transposon sequences using BLAST (Altschul et al. 1990). Reads for which BLAST successfully identified alignments for both the gene and transposon breakpoint were further processed. For those cases in which only the genomic locus could be mapped, the transposon breakpoint was computed from the STAR alignment and the size of the fragment. Pooled results were filtered to ensure that each read was only counted once. These steps were repeated for each sample and sequencing lane separately and individual results were combined by merging breakpoint-spanning reads based on the genomic locus with BEDTools (Quinlan and Hall 2010), with a window of 20 nt, and preserving single-nucleotide breakpoint information on the gene- and transposon sequence. For cDNA data, transposon-to-gene and gene-to-transposon reads and for gDNA data, upstream and downstream reads were recorded separately. Pooled hits were intersected with annotated genes, gene features (5′ and 3′ UTRs, exons, introns), and splice sites. Finally, for cDNA data, gene and transposon expression levels are added to each breakpoint using SAMtools (Li et al. 2009). Key functions 4–6 are described in the Supplemental Methods. All step-by-step code and a more detailed manual are available on GitHub (https://github.com/charliefornia/TEchim). FlyBase was used for candidate-based gene searches (Thurmond et al. 2019).
Data from previously published studies
Raw single-cell sequencing reads from Croset et al. (2018) (PRJNA428955), Hemphill et al. (2018) (PRJNA412381), and Mackay et al. (2012) (PRJNA280097) were obtained from the NCBI Short Read Archive (SRA; https://www.ncbi.nlm.nih.gov/sra). Genomic DNA data from Treiber and Waddell (2017) was obtained from the Dryad Digital Repository (https://doi.org/10.5061/dryad.fd930).
Data access
All processed data are presented in Supplemental Tables S1–S10. FASTQ files and wiggle tracks of the bulk RNA sequencing data have been submitted to the NCBI BioProject Database (https://www.ncbi.nlm.nih.gov/bioproject/) under accession number PRJNA588978. Scripts are provided as Supplemental Code and can also be accessed via GitHub (https://github.com/charliefornia/TEchim and https://github.com/charliefornia/scHardyWeinberg).
Competing interest statement
The authors declare no competing interests.
Supplementary Material
Acknowledgments
We thank other members of the Waddell group for discussion. C.D.T. was supported by a Wellcome Trust DPhil studentship. S.W. is funded by a Wellcome Principal Research Fellowship (200846/Z/16/Z), European Research Council Advanced Grant (789274), and the Bettencourt–Schueller Foundation.
Author contributions: C.D.T. and S.W. conceived the project and wrote the manuscript. C.D.T. performed and analyzed all experiments.
Footnotes
[Supplemental material is available for this article.]
Article published online before print. Article, supplemental material, and publication date are at http://www.genome.org/cgi/doi/10.1101/gr.259200.119.
Freely available online through the Genome Research Open Access option.
References
- Allen AM, Neville MC, Birtles S, Croset V, Treiber CD, Waddell S, Goodwin SF. 2020. A single-cell transcriptomic atlas of the adult Drosophila ventral nerve cord. eLife 9: e54074 10.7554/eLife.54074 [DOI] [PMC free article] [PubMed] [Google Scholar]
- Altschul SF, Gish W, Miller W, Myers EW, Lipman DJ. 1990. Basic local alignment search tool. J Mol Biol 215: 403–410. 10.1016/S0022-2836(05)80360-2 [DOI] [PubMed] [Google Scholar]
- Ashley J, Cordy B, Lucia D, Fradkin LG, Budnik V, Thomson T. 2018. Retrovirus-like gag protein Arc1 binds RNA and traffics across synaptic boutons. Cell 172: 262–274 10.1016/j.cell.2017.12.022 [DOI] [PMC free article] [PubMed] [Google Scholar]
- Aso Y, Hattori D, Yu Y, Johnston RM, Iyer NA, Ngo TTB, Dionne H, Abbott LF, Axel R, Tanimoto H, et al. 2014. The neuronal architecture of the mushroom body provides a logic for associative learning. eLife 3: e04577 10.7554/eLife.04577 [DOI] [PMC free article] [PubMed] [Google Scholar]
- Babaian A, Thompson IR, Lever J, Gagnier L, Karimi MM, Mager DL. 2019. LIONS: analysis suite for detecting and quantifying transposable element initiated transcription from RNA-seq. Bioinformatics 35: 3839–3841. 10.1093/bioinformatics/btz130 [DOI] [PubMed] [Google Scholar]
- Baillie JK, Barnett MW, Upton KR, Gerhardt DJ, Richmond TA, De Sapio F, Brennan P, Rizzu P, Smith S, Fell M, et al. 2011. Somatic retrotransposition alters the genetic landscape of the human brain. Nature 479: 534–537. 10.1038/nature10531 [DOI] [PMC free article] [PubMed] [Google Scholar]
- Bourque G, Burns KH, Gehring M, Gorbunova V, Seluanov A, Hammell M, Imbeault M, Izsvák Z, Levin HL, Macfarlan TS, et al. 2018. Ten things you should know about transposable elements. Genome Biol 19: 199 10.1186/s13059-018-1577-z [DOI] [PMC free article] [PubMed] [Google Scholar]
- Britten RJ, Kohne DE. 1968. Repeated sequences in DNA. Hundreds of thousands of copies of DNA sequences have been incorporated into the genomes of higher organisms. Science 161: 529–540. 10.1126/science.161.3841.529 [DOI] [PubMed] [Google Scholar]
- Butler A, Hoffman P, Smibert P, Papalexi E, Satija R. 2018. Integrating single-cell transcriptomic data across different conditions, technologies, and species. Nat Biotechnol 36: 411–420. 10.1038/nbt.4096 [DOI] [PMC free article] [PubMed] [Google Scholar]
- Chung N, Jonaid GM, Quinton S, Ross A, Sexton CE, Alberto A, Clymer C, Churchill D, Navarro Leija O, Han MV. 2019. Transcriptome analyses of tumor-adjacent somatic tissues reveal genes co-expressed with transposable elements. Mob DNA 10: 39 10.1186/s13100-019-0180-5 [DOI] [PMC free article] [PubMed] [Google Scholar]
- Coufal NG, Garcia-Perez JL, Peng GE, Yeo GW, Mu Y, Lovci MT, Morell M, O'Shea KS, Moran JV, Gage FH. 2009. L1 retrotransposition in human neural progenitor cells. Nature 460: 1127–1131. 10.1038/nature08248 [DOI] [PMC free article] [PubMed] [Google Scholar]
- Criscione SW, Zhang Y, Thompson W, Sedivy JM, Neretti N. 2014. Transcriptional landscape of repetitive elements in normal and cancer human cells. BMC Genomics 15: 583 10.1186/1471-2164-15-583 [DOI] [PMC free article] [PubMed] [Google Scholar]
- Croset V, Treiber CD, Waddell S. 2018. Cellular diversity in the Drosophila midbrain revealed by single-cell transcriptomics. eLife 7: e34550 10.7554/eLife.34550 [DOI] [PMC free article] [PubMed] [Google Scholar]
- Davie K, Janssens J, Koldere D, De Waegeneer M, Pech U, Kreft Ł, Aibar S, Makhzami S, Christiaens V, Bravo González-Blas C, et al. 2018. A single-cell transcriptome atlas of the aging Drosophila brain. Cell 174: 982–998.e20. 10.1016/j.cell.2018.05.057 [DOI] [PMC free article] [PubMed] [Google Scholar]
- Deamer D, Akeson M, Branton D. 2016. Three decades of nanopore sequencing. Nat Biotechnol 34: 518–524. 10.1038/nbt.3423 [DOI] [PMC free article] [PubMed] [Google Scholar]
- De Cecco M, Criscione SW, Peterson AL, Neretti N, Sedivy JM, Kreiling JA. 2013. Transposable elements become active and mobile in the genomes of aging mammalian somatic tissues. Aging (Albany NY) 5: 867–883. 10.18632/aging.100621 [DOI] [PMC free article] [PubMed] [Google Scholar]
- Deininger P. 2011. Alu elements: know the SINEs. Genome Biol 12: 236 10.1186/gb-2011-12-12-236 [DOI] [PMC free article] [PubMed] [Google Scholar]
- Didelot G, Molinari F, Tchénio P, Comas D, Milhiet E, Munnich A, Colleaux L, Preat T. 2006. Tequila, a neurotrypsin ortholog, regulates long-term memory formation in Drosophila. Science 313: 851–853. 10.1126/science.1127215 [DOI] [PubMed] [Google Scholar]
- Dobin A, Davis CA, Schlesinger F, Drenkow J, Zaleski C, Jha S, Batut P, Chaisson M, Gingeras TR. 2013. STAR: ultrafast universal RNA-seq aligner. Bioinformatics 29: 15–21. 10.1093/bioinformatics/bts635 [DOI] [PMC free article] [PubMed] [Google Scholar]
- Evrony GD, Cai X, Lee E, Hills LB, Elhosary PC, Lehmann HS, Parker JJ, Atabay KD, Gilmore EC, Poduri A, et al. 2012. Single-neuron sequencing analysis of l1 retrotransposition and somatic mutation in the human brain. Cell 151: 483–496. 10.1016/j.cell.2012.09.035 [DOI] [PMC free article] [PubMed] [Google Scholar]
- Evrony GD, Lee E, Mehta BK, Benjamini Y, Johnson RM, Cai X, Yang L, Haseley P, Lehmann HS, Park PJ, et al. 2015. Cell lineage analysis in human brain using endogenous retroelements. Neuron 85: 49–59. 10.1016/j.neuron.2014.12.028 [DOI] [PMC free article] [PubMed] [Google Scholar]
- Evrony GD, Lee E, Park PJ, Walsh CA. 2016. Resolving rates of mutation in the brain using single-neuron genomics. eLife 5: e12966 10.7554/eLife.12966 [DOI] [PMC free article] [PubMed] [Google Scholar]
- Faulkner GJ, Kimura Y, Daub CO, Wani S, Plessy C, Irvine KM, Schroder K, Cloonan N, Steptoe AL, Lassmann T, et al. 2009. The regulated retrotransposon transcriptome of mammalian cells. Nat Genet 41: 563–571. 10.1038/ng.368 [DOI] [PubMed] [Google Scholar]
- Gould SJ, Vrba ES. 1982. Exaptation—a missing term in the science of form. Paleobiology 8: 4–15. 10.1017/S0094837300004310 [DOI] [Google Scholar]
- Guo C, Jeong HH, Hsieh YC, Klein HU, Bennett DA, De Jager PL, Liu Z, Shulman JM. 2018. Tau activates transposable elements in Alzheimer's disease. Cell Rep 23: 2874–2880. 10.1016/j.celrep.2018.05.004 [DOI] [PMC free article] [PubMed] [Google Scholar]
- Hemphill W, Rivera O, Talbert M. 2018. RNA-sequencing of Drosophila melanogaster head tissue on high-sugar and high-fat diets. G3 Genes, Genomes, Genet 8: 279–290. 10.1534/g3.117.300397 [DOI] [PMC free article] [PubMed] [Google Scholar]
- Hirano Y, Ihara K, Masuda T, Yamamoto T, Iwata I, Takahashi A, Awata H, Nakamura N, Takakura M, Suzuki Y, et al. 2016. Shifting transcriptional machinery is required for long-term memory maintenance and modification in Drosophila mushroom bodies. Nat Commun 7: 13471 10.1038/ncomms13471 [DOI] [PMC free article] [PubMed] [Google Scholar]
- Hoskins RA, Carlson JW, Wan KH, Park S, Mendez I, Galle SE, Booth BW, Pfeiffer BD, George RA, Svirskas R, et al. 2015. The release 6 reference sequence of the Drosophila melanogaster genome. Genome Res 25: 445–458. 10.1101/gr.185579.114 [DOI] [PMC free article] [PubMed] [Google Scholar]
- International Human Genome Sequencing Consortium. 2001. Initial sequencing and analysis of the human genome. Nature 409: 860–921. 10.1038/35057062 [DOI] [PubMed] [Google Scholar]
- Izquierdo M. 1994. Ubiquitin genes and ubiquitin protein location in polytene chromosomes of Drosophila. Chromosoma 103: 193–197. 10.1007/BF00368012 [DOI] [PubMed] [Google Scholar]
- Jurka J. 2000. Repbase update: a database and an electronic journal of repetitive elements. Trends Genet 16: 418–420. 10.1016/S0168-9525(00)02093-X [DOI] [PubMed] [Google Scholar]
- Kaminker JS, Bergman CM, Kronmiller B, Carlson J, Svirskas R, Patel S, Frise E, Wheeler DA, Lewis SE, Rubin GM, et al. 2002. The transposable elements of the Drosophila melanogaster euchromatin: a genomics perspective. Genome Biol 3: research0084.1 10.1186/gb-2002-3-12-research0084 [DOI] [PMC free article] [PubMed] [Google Scholar]
- Kaplan WD, Trout WE. 1969. The behavior of four neurological mutants of Drosophila. Genetics 61: 399–409. [DOI] [PMC free article] [PubMed] [Google Scholar]
- Kapusta A, Kronenberg Z, Lynch VJ, Zhuo X, Ramsay LA, Bourque G, Yandell M, Feschotte C. 2013. Transposable elements are major contributors to the origin, diversification, and regulation of vertebrate long noncoding RNAs. PLoS Genet 9: e1003470 10.1371/journal.pgen.1003470 [DOI] [PMC free article] [PubMed] [Google Scholar]
- Kazazian HH. 2011. Mobile DNA transposition in somatic cells. BMC Biol 9: 2–5. 10.1186/1741-7007-9-62 [DOI] [PMC free article] [PubMed] [Google Scholar]
- Kazazian HH, Moran JV. 2017. Mobile DNA in health and disease. N. Engl. J. Med 377: 361–370. 10.1056/NEJMra1510092 [DOI] [PMC free article] [PubMed] [Google Scholar]
- Ketchum K, Hoskins R, Wang X, Smith T, Gocayne J, Skupski M, Wei M, Smith H, Kennison J, Nixon K, et al. 2000. The genome sequence of Drosophila melanogaster. Science 287: 2185–2195. 10.1126/science.287.5461.2185 [DOI] [PubMed] [Google Scholar]
- Konstantinides N, Kapuralin K, Fadil C, Barboza L, Satija R, Desplan C. 2018. Phenotypic convergence: distinct transcription factors regulate common terminal features. Cell 174: 622–635.e13. 10.1016/j.cell.2018.05.021 [DOI] [PMC free article] [PubMed] [Google Scholar]
- Krug L, Chatterjee N, Borges-Monroy R, Hearn S, Liao W-W, Morrill K, Prazak L, Rozhkov N, Theodorou D, Hammell M, et al. 2017. Retrotransposon activation contributes to neurodegeneration in a Drosophila TDP-43 model of ALS. PLoS Genet 13: e1006635 10.1371/journal.pgen.1006635 [DOI] [PMC free article] [PubMed] [Google Scholar]
- Lanciano S, Cristofari G. 2020. Measuring and interpreting transposable element expression. Nat Rev Genet 10.1038/s41576-020-0251-y [DOI] [PubMed] [Google Scholar]
- Larsen MJ, Burton KJ, Zantello MR, Smith VG, Lowery DL, Kubiak TM. 2001. Type A allatostatins from Drosophila melanogaster and Diplotera puncata activate two Drosophila allatostatin receptors, DAR-1 and DAR-2, expressed in CHO cells. Biochem. Biophys. Res. Commun 286: 895–901. 10.1006/bbrc.2001.5476 [DOI] [PubMed] [Google Scholar]
- Lewontin RC, Kojima K. 1960. The evolutionary dynamics of complex polymorphisms. Evolution (NY) 14: 458–472. 10.1111/j.1558-5646.1960.tb03113.x [DOI] [Google Scholar]
- Li H, Handsaker B, Wysoker A, Fennell T, Ruan J, Homer N, Marth G, Abecasis G, Durbin R, 1000 Genome Project Data Processing Subgroup. 2009. The Sequence Alignment/Map format and SAMtools. Bioinformatics 25: 2078–2079. 10.1093/bioinformatics/btp352 [DOI] [PMC free article] [PubMed] [Google Scholar]
- Li W, Jin Y, Prazak L, Hammell M, Dubnau J. 2012. Transposable elements in TDP-43-mediated neurodegenerative disorders. PLoS One 7: e44099 10.1371/journal.pone.0044099 [DOI] [PMC free article] [PubMed] [Google Scholar]
- Li W, Prazak L, Chatterjee N, Grüninger S, Krug L, Theodorou D, Dubnau J. 2013. Activation of transposable elements during aging and neuronal decline in Drosophila. Nat Neurosci 16: 529–531. 10.1038/nn.3368 [DOI] [PMC free article] [PubMed] [Google Scholar]
- MacKay TFC, Richards S, Stone EA, Barbadilla A, Ayroles JF, Zhu D, Casillas S, Han Y, Magwire MM, Cridland JM, et al. 2012. The Drosophila melanogaster genetic reference panel. Nature 482: 173–178. 10.1038/nature10811 [DOI] [PMC free article] [PubMed] [Google Scholar]
- Macosko EZ, Basu A, Satija R, Nemesh J, Shekhar K, Goldman M, Tirosh I, Bialas AR, Kamitaki N, Martersteck EM, et al. 2015. Highly parallel genome-wide expression profiling of individual cells using nanoliter droplets. Cell 161: 1202–1214. 10.1016/j.cell.2015.05.002 [DOI] [PMC free article] [PubMed] [Google Scholar]
- Magoč T, Salzberg SL. 2011. FLASH: fast length adjustment of short reads to improve genome assemblies. Bioinformatics 27: 2957–2963. 10.1093/bioinformatics/btr507 [DOI] [PMC free article] [PubMed] [Google Scholar]
- Makałowski W, Mitchell GA, Labuda D. 1994. Alu sequences in the coding regions of mRNA: a source of protein variability. Trends Genet 10: 188–193. 10.1016/0168-9525(94)90254-2 [DOI] [PubMed] [Google Scholar]
- Muotri AR, Chu VT, Marchetto MCN, Deng W, Moran JV, Gage FH. 2005. Somatic mosaicism in neuronal precursor cells mediated by L1 retrotransposition. Nature 435: 903–910. 10.1038/nature03663 [DOI] [PubMed] [Google Scholar]
- Nekrutenko A, Li WH. 2001. Transposable elements are found in a large number of human protein-coding genes. Trends Genet 17: 619–621. 10.1016/S0168-9525(01)02445-3 [DOI] [PubMed] [Google Scholar]
- Nelson MG, Linheiro RS, Bergman CM. 2017. McClintock: An integrated pipeline for detecting transposable element insertions in whole-genome shotgun sequencing data. G3 (Bethesda) 7: 2763–2778. 10.1534/g3.117.043893 [DOI] [PMC free article] [PubMed] [Google Scholar]
- Pastuzyn ED, Day CE, Kearns RB, Kyrke-Smith M, Taibi AV, McCormick J, Yoder N, Belnap DM, Erlendsson S, Morado DR, et al. 2018. The neuronal gene Arc encodes a repurposed retrotransposon Gag protein that mediates intercellular RNA transfer. Cell 172: 275–288.e18. 10.1016/j.cell.2017.12.024 [DOI] [PMC free article] [PubMed] [Google Scholar]
- Perrat PN, DasGupta S, Wang J, Theurkauf W, Weng Z, Rosbash M, Waddell S. 2013. Transposition-driven genomic heterogeneity in the Drosophila brain. Science 340: 91–95. 10.1126/science.1231965 [DOI] [PMC free article] [PubMed] [Google Scholar]
- Philippe C, Vargas-Landin DB, Doucet AJ, Van Essen D, Vera-Otarola J, Kuciak M, Corbin A, Nigumann P, Cristofari G. 2016. Activation of individual L1 retrotransposon instances is restricted to cell-type dependent permissive loci. eLife 5: e13926 10.7554/eLife.13926 [DOI] [PMC free article] [PubMed] [Google Scholar]
- Pinson ME, Pogorelcnik R, Court F, Arnaud P, Vaurs-Barrière C. 2018. CLIFinder: identification of LINE-1 chimeric transcripts in RNA-seq data. Bioinformatics 34: 688–690. 10.1093/bioinformatics/btx671 [DOI] [PubMed] [Google Scholar]
- Quinlan AR, Hall IM. 2010. BEDTools: a flexible suite of utilities for comparing genomic features. Bioinformatics 26: 841–842. 10.1093/bioinformatics/btq033 [DOI] [PMC free article] [PubMed] [Google Scholar]
- Rangwala SH, Zhang L, Kazazian HH. 2009. Many LINE1 elements contribute to the transcriptome of human somatic cells. Genome Biol 10: R100 10.1186/gb-2009-10-9-r100 [DOI] [PMC free article] [PubMed] [Google Scholar]
- R Core Team. 2017. R: a language and environment for statistical computing. R; Foundation for Statistical Computing, Vienna: https://www.R-project.org/. [Google Scholar]
- Rhoads A, Au KF. 2015. PacBio sequencing and its applications. Genomics Proteomics Bioinformatics 13: 278–289. 10.1016/j.gpb.2015.08.002 [DOI] [PMC free article] [PubMed] [Google Scholar]
- Roebroek AJM, Pauli IGL, Zhang Y, van de Ven WJM. 1991. cDNA sequence of a Drosophila melanogaster gene, Dfur1, encoding a protein structurally related to the subtilisin-like proprotein processing enzyme furin. FEBS Lett 289: 133–137. 10.1016/0014-5793(91)81052-A [DOI] [PubMed] [Google Scholar]
- Sanchez-Luque FJ, Kempen MJHC, Gerdes P, Vargas-Landin DB, Richardson SR, Troskie RL, Jesuadian JS, Cheetham SW, Carreira PE, Salvador-Palomeque C, et al. 2019. LINE-1 evasion of epigenetic repression in humans. Mol. Cell 75: 590–604.e12. 10.1016/j.molcel.2019.05.024 [DOI] [PubMed] [Google Scholar]
- Schauer SN, Carreira PE, Shukla R, Gerhardt DJ, Gerdes P, Sanchez-Luque FJ, Nicoli P, Kindlova M, Ghisletti S, Dos Santos AD, et al. 2018. L1 retrotransposition is a common feature of mammalian hepatocarcinogenesis. Genome Res 28: 639–653. 10.1101/gr.226993.117 [DOI] [PMC free article] [PubMed] [Google Scholar]
- Sienski G, Dönertas D, Brennecke J. 2012. Transcriptional silencing of transposons by piwi and maelstrom and its impact on chromatin state and gene expression. Cell 151: 964–980. 10.1016/j.cell.2012.10.040 [DOI] [PMC free article] [PubMed] [Google Scholar]
- Smit AFA, Hubley R, Green P. 2015. RepeatMasker Open-4.0. http://www.repeatmasker.org/.
- Smith LA, Wang XJ, Peixoto AA, Neumann EK, Hall LM, Hall JC. 1996. A Drosophila calcium channel α1 subunit gene maps to a genetic locus associated with behavioral and visual defects. J. Neurosci 16: 7868–7879. 10.1523/JNEUROSCI.16-24-07868.1996 [DOI] [PMC free article] [PubMed] [Google Scholar]
- Stephens RM, Schneider TD. 1992. Features of spliceosome evolution and function inferred from an analysis of the information at human splice sites. J. Mol. Biol 228: 1124–1136. 10.1016/0022-2836(92)90320-J [DOI] [PubMed] [Google Scholar]
- Sun W, Samimi H, Gamez M, Zare H, Frost B. 2018. Pathogenic tau-induced piRNA depletion promotes neuronal death through transposable element dysregulation in neurodegenerative tauopathies. Nat Neurosci 21: 1038–1048. 10.1038/s41593-018-0194-1 [DOI] [PMC free article] [PubMed] [Google Scholar]
- Thibault ST, Singer MA, Miyazaki WY, Milash B, Dompe NA, Singh CM, Buchholz R, Demsky M, Fawcett R, Francis-Lang HL, et al. 2004. A complementary transposon tool kit for Drosophila melanogaster using P and piggyBac. Nat Genet 36: 283–287. 10.1038/ng1314 [DOI] [PubMed] [Google Scholar]
- Thurmond J, Goodman JL, Strelets VB, Attrill H, Gramates LS, Marygold SJ, Matthews BB, Millburn G, Antonazzo G, Trovisco V, et al. 2019. Flybase 2.0: the next generation. Nucleic Acids Res 47: D759–D765. 10.1093/nar/gky1003 [DOI] [PMC free article] [PubMed] [Google Scholar]
- Treiber CD, Waddell S. 2017. Resolving the prevalence of somatic transposition in Drosophila. eLife 6: e28297 10.7554/eLife.28297 [DOI] [PMC free article] [PubMed] [Google Scholar]
- Upton KR, Gerhardt DJ, Jesuadian JS, Richardson SR, Sánchez-Luque FJ, Bodea GO, Ewing AD, Salvador-Palomeque C, van der Knaap MS, Brennan PM, et al. 2015. Ubiquitous L1 mosaicism in hippocampal neurons. Cell 161: 228–239. 10.1016/j.cell.2015.03.026 [DOI] [PMC free article] [PubMed] [Google Scholar]
- Van de Lagemaat LN, Landry JR, Mager DL, Medstrand P. 2003. Transposable elements in mammals promote regulatory variation and diversification of genes with specialized functions. Trends Genet 19: 530–536. 10.1016/j.tig.2003.08.004 [DOI] [PubMed] [Google Scholar]
- Wan HI, DiAntonio A, Fetter RD, Bergstrom K, Strauss R, Goodman CS. 2000. Highwire regulates synaptic growth in Drosophila. Neuron 26: 313–329. 10.1016/S0896-6273(00)81166-6 [DOI] [PubMed] [Google Scholar]
- Wang Z, Berkey CD, Watnick PI. 2012. The Drosophila protein mustard tailors the innate immune response activated by the immune deficiency pathway. J. Immunol 188: 3993–4000. 10.4049/jimmunol.1103301 [DOI] [PMC free article] [PubMed] [Google Scholar]
- Wang T, Santos JH, Feng J, Fargo DC, Shen L, Riadi G, Keeley E, Rosh ZS, Nestler EJ, Woychik RP. 2016. A novel analytical strategy to identify fusion transcripts between repetitive elements and protein coding-exons using RNA-Seq. PLoS One 11: e0159028 10.1371/journal.pone.0159028 [DOI] [PMC free article] [PubMed] [Google Scholar]
- Zhang W, Wu J, Ward MD, Yang S, Chuang YA, Xiao M, Li R, Leahy DJ, Worley PF. 2015. Structural basis of arc binding to synaptic proteins: implications for cognitive disease. Neuron 86: 490–500. 10.1016/j.neuron.2015.03.030 [DOI] [PMC free article] [PubMed] [Google Scholar]
Associated Data
This section collects any data citations, data availability statements, or supplementary materials included in this article.