

Abstract
Histone H3 lysine 36 methylation (H3K36me) is a conserved histone modification associated with transcription and DNA repair. Although the effects of H3K36 methylation have been studied, the genome-wide dynamics of H3K36me deposition and removal are not known. We established rapid and reversible optogenetic control for Set2, the sole H3K36 methyltransferase in yeast, by fusing the enzyme with the light-activated nuclear shuttle (LANS) domain. Light activation resulted in efficient Set2-LANS nuclear localization followed by H3K36me3 deposition in vivo, with total H3K36me3 levels correlating with RNA abundance. Although genes showed disparate levels of H3K36 methylation, relative rates of H3K36me3 accumulation were largely linear and consistent across genes, suggesting that H3K36me3 deposition occurs in a directed fashion on all transcribed genes regardless of their overall transcription frequency. Removal of H3K36me3 was highly dependent on the demethylase Rph1. However, the per-gene rate of H3K36me3 loss weakly correlated with RNA abundance and followed exponential decay, suggesting H3K36 demethylases act in a global, stochastic manner. Altogether, these data provide a detailed temporal view of H3K36 methylation and demethylation that suggests transcription-dependent and -independent mechanisms for H3K36me deposition and removal, respectively.
Histone post-translational modifications (PTMs) contribute to both chromatin packaging and gene regulation (Strahl and Allis 2000; Venkatesh and Workman 2015). Addition and removal of PTMs must be carefully choreographed to regulate engagement of chromatin remodeling complexes and grant cellular machinery access to DNA for transcription, replication, recombination, and DNA repair (Kouzarides 2007). In particular, dynamic regulation of histone methylation and demethylation has been implicated in these processes, ultimately controlling cell fate and differentiation (Klose and Zhang 2007; Greer and Shi 2012).
Histone H3 lysine 36 methylation (H3K36me) is present across eukaryotic organisms and in yeast is generated by the methyltransferase Set2 (Wagner and Carpenter 2012; McDaniel and Strahl 2017). As the sole H3K36 methyltransferase in Saccharomyces cerevisiae (S. cerevisiae), Set2 cotranscriptionally deposits up to three methyl groups, resulting in mono-, di-, or trimethylated H3K36 (H3K36me1, H3K36me2, and H3K36me3, respectively) (Strahl et al. 2002; Li et al. 2003; Xiao et al. 2003; Keogh et al. 2005; Kizer et al. 2005; Govind et al. 2010). These modifications regulate chromatin structure through diverse pathways, including activation of the histone deacetylase complex Rpd3S (Carrozza et al. 2005; Joshi and Struhl 2005; Keogh et al. 2005; Govind et al. 2010) and regulation of histone exchange and transcription elongation (Maltby et al. 2012; Smolle et al. 2012; Venkatesh et al. 2012; Gilbert et al. 2014). These pathways prevent aberrant transcription from cryptic promoters and maintain transcriptional fidelity and genomic stability (Neil et al. 2009; Churchman and Weissman 2011; Jha and Strahl 2014; Sen et al. 2015; Kim et al. 2016; McDaniel et al. 2017). In addition to its role in transcription, H3K36 methylation has also been linked to DNA damage repair, splicing, and cell cycle regulation (McDaniel and Strahl 2017).
H3K36me is primarily removed by two Jumonji domain-containing histone demethylases, Rph1 and Jhd1 in yeast, which target H3K36me3 and H3K36me2 (Tsukada et al. 2006; Kim and Buratowski 2007; Klose et al. 2007; Tu et al. 2007). Rph1 was first identified as a damage-responsive repressor of the DNA photolyase PHR1 (Jang et al. 1999; Kim et al. 2002; Liang et al. 2011), but later as a H3K36 demethylase. Rph1 and Jhd1 show demethylase activity in vitro and have been linked to demethylation of H3K36 during transcription elongation in vivo (Chang et al. 2011; Kwon and Ahn 2011). Although these demethylases are presumed to function during transcription elongation and in opposition of Set2-dependent H3K36 methylation, recent studies point to at least the ability of Rph1 to function in a nontranscriptional manner to regulate the balance of H3K36me2/3 for processes involved in metabolism and amino acid biosynthesis (Ye et al. 2017). Thus, further investigation of H3K36 demethylation is warranted.
A limitation of studies into H3K36 methylation and demethylation has been the lack of an experimental strategy that uses a method that is both reversible and that matches the kinetics of deposition and removal of H3K36 methylation. Previous studies have examined turnover of histone acetylation using the translation inhibitor cycloheximide or turnover of H3K36 methylation at an induced locus (Nelson 1982; Waterborg 2001; Sein et al. 2015). New approaches in optogenetics—the use of genetically encoded, light-responsive proteins to regulate biological processes—offer the minimal latency and rapid reversibility needed to study chromatin state changes (Kim et al. 2017; Liu and Tucker 2017). Several enabling optogenetic tools based on the LOV2 domain of Avena sativa phototropin 1 (AsLOV2) have been developed to date (Niopek et al. 2014, 2016; Yumerefendi et al. 2015, 2016; Di Ventura and Kuhlman 2016). Previously, we engineered LOV2 to control protein translocation into and out of the nucleus using light. We used the light-activated nuclear shuttle (LANS) to control cell fate through regulation of a transcription factor (Yumerefendi et al. 2015) and the light-induced nuclear exporter (LINX) to examine the rapid kinetics of deposition and removal of H2B monoubiquitylation, which controls the trans-histone-regulated methylation events of H3K4 and H3K79 and is deposited and removed to steady-state levels with half-lives of ∼6 and 1 min, respectively (Yumerefendi et al. 2016). In this study, we applied LANS to precisely control Set2 localization, and consequently its activity, to quantitatively evaluate the genome-wide dynamics of H3K36 methylation and demethylation. This work shows the potential for optogenetic tools, coupled with high-throughput genomics and computational analytics, to uncover key insights into the regulatory dynamics of histone PTMs.
Results
Optogenetic control of Set2 subcellular localization
To quantitatively explore methylation dynamics, we sought to generate a photoresponsive variant of Set2 (LANS-Set2) capable of reversible translocation into and out of the nucleus in response to blue light (Fig. 1A). We inactivated a putative bipartite nuclear localization signal (NLS) in Set2 (residues 538–539 and 549–551) by mutating the lysines and arginines in the motif to glycines and serines to generate Set2NLSΔ (Kosugi et al. 2009). We reasoned that these mutations, distal from the functional SET and SRI (Set2-Rpb1 interacting) domains (Supplemental Fig. S1A), would impact Set2 localization without affecting its catalytic activity. We then tested whether Set2 could be constitutively inactivated by fusing it to a nuclear export signal (NES) sequence (Supplemental Fig. S1B; Yumerefendi et al. 2015). Expressing these proteins in a SET2 deletion strain (set2Δ) (Supplemental Fig. S1C) resulted in reduced H3K36 trimethylation and varying H3K36 dimethylation depending on the NES. Fusion of Set2NLSΔ with the NLS in LANS (NLS-Set2NLSΔ) restored H3K36 methylation, although to levels less than wild-type (Supplemental Fig. S1C). All NES and NLS sequences were fused to the N terminus of Set2.
Figure 1.

Optogenetic control of Set2 subcellular localization. (A) Schematic of histone H3 lysine 36 (H3K36) methylation triggered by light-induced translocation of LANS-Set2 into the nucleus as well as demethylation by Rph1. (B) Confocal images from Supplemental Movie S1 demonstrating reversible control of mVenus-tagged LANS-Set2 localization in yeast cells with histone H2B endogenously tagged with mCherry (scale bar, 3 μm). (C) Quantification of nuclear/cytoplasmic fluorescence intensity change before, during, and after light activation. Mean ± SEM was calculated from the activation of multiple cells (n = 3) shown in B and Supplemental Movie S1.
We then expressed fluorescently and N-terminally tagged Set2, Set2NLSΔ, NES1-Set2NLSΔ, or NLS-Set2NLSΔ in H2B-mCherry expressing cells to visualize subcellular localization of these static, nonshuttling constructs (Supplemental Fig. S1D). In contrast to wild-type Set2, which is nuclear, NLS-inactivated Set2 localized throughout the cell. NES1-Set2NLSΔ localized outside of the nucleus, and NLS-Set2NLSΔ restored nuclear localization. These results further supported successful identification and elimination of the Set2 NLS and identified both an NES and NLS suitable for optogenetic control. Next, we combined these elements to generate a functional photoswitch. We expressed the NLS-mutated Set2 fused C terminally to a LANS variant using NES1 (mVenus-LANS-Set2) in the H2B-mCherry yeast strain and monitored nucleocytoplasmic ratios upon blue light exposure using confocal microscopy. Light exposure produced, on average, a 3.5-fold change in nucleocytoplasmic ratio (Fig. 1B,C; Supplemental Movie S1) with most Set2 entering the nucleus in <5 min and most Set2 exiting the nucleus in <7 min. Thus, we identified NES1 as suitable for use in LANS-Set2 to achieve optimal light-induced nuclear translocation.
LANS-Set2 regulates H3K36 methylation levels and Set2-associated phenotypes
Following removal of mVenus, which resulted in more stable Set2 protein levels (Supplemental Fig. S1E), LANS-Set2 was expressed in set2Δ cells. H3K36 methylation was evaluated following growth in the dark or light (Fig. 2A). H3K36me3 and H3K36me2 were increased six- and fourfold, respectively, from the dark to light, whereas H3K36me1 levels were unchanged (Fig. 2B; Supplemental Fig. S1E).
Figure 2.
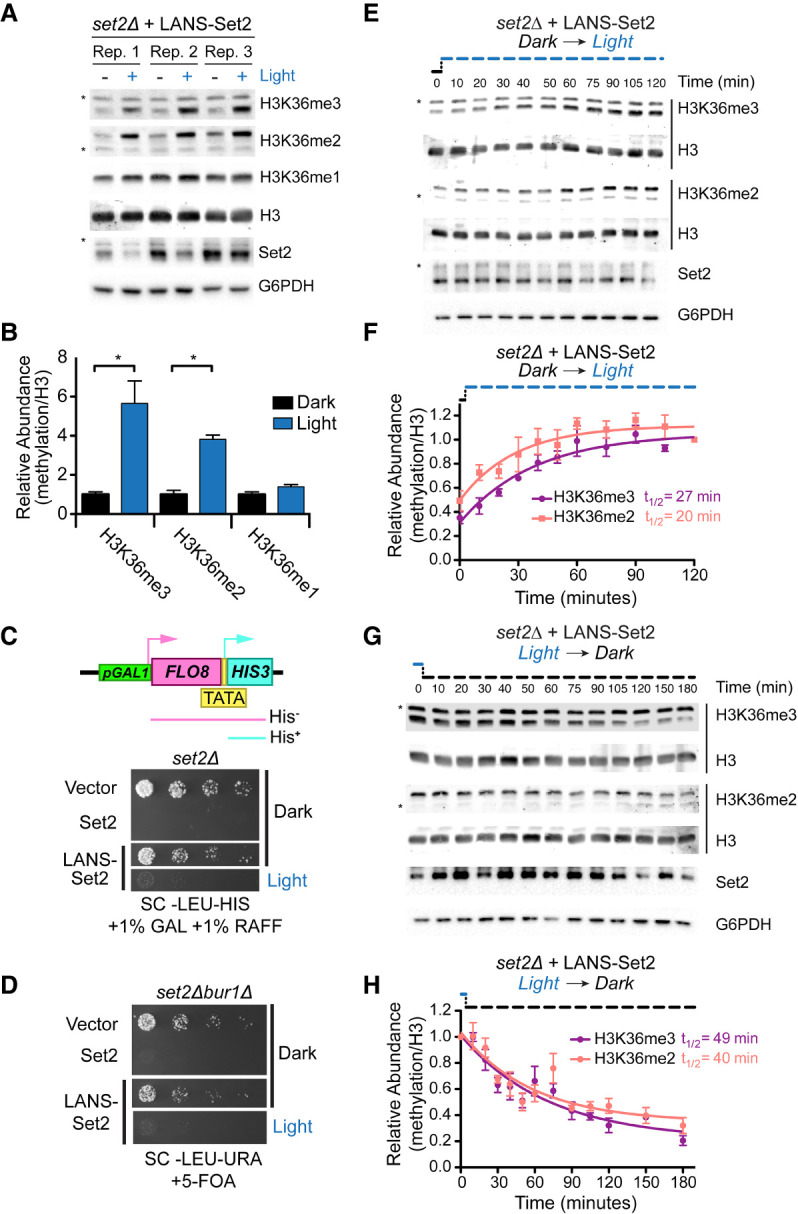
LANS-Set2 regulates H3K36 methylation levels and Set2-associated phenotypes. (A) Western blot analysis comparing levels of H3K36 methylation in whole-cell lysates prepared from log-phase cultures grown continuously in the dark or light. Asterisks indicate nonspecific bands. (B) Quantification of histone modifications from immunoblots in A. Data represent mean values ± SD (n = 3). (*) P < 0.05. (C, top) Diagram of the FLO8-HIS3 reporter. The promoter upstream of the FLO8 gene has been replaced by a galactose-inducible promoter and a HIS3 cassette has been inserted out of frame from the FLO8+1 ATG such that growth in the absence of histidine can only occur when transcription initiates from an internal TATA located at FLO8+1626. (Bottom) Fourfold serial dilutions of overnight set2Δ cultures expressing one of several constructs were spotted on the indicated solid media, which were incubated in the dark or light for 4 d before imaging (for original images, see Supplemental Fig. S1F). LANS-Set2 phenocopies set2Δ in the dark and wild-type Set2 in the light. (D) Fivefold serial dilutions of overnight cultures of wild-type BY4742 and BUR1 plasmid shuffling strains were spotted on the indicated solid media, which were incubated in the dark or light for 3 d before imaging (for original images, see Supplemental Fig. S1G). LANS-Set2 phenocopies set2Δbur1Δ in the dark and wild-type Set2 in the light. (E) Representative western blot analysis of whole-cell lysates probing gain of H3K36 methylation over time using LANS-Set2 in set2Δ after the transition of log-phase cultures from dark to light (for replicates, see Supplemental Fig. S2A). Asterisks indicate nonspecific bands. (F) Quantification of H3K36 modifications as a function of time from triplicate immunoblots shown in E and Supplemental Figure S2A. n = 3 and data represent mean ± SEM. (G) Representative western blot analysis of whole-cell lysates probing loss of H3K36 methylation over time using LANS-Set2 in set2Δ after the transition of log-phase cultures from light to dark (for replicates, see Supplemental Fig. S2B). Asterisks indicate nonspecific bands. (H) Quantification of H3K36 modifications as a function of time from triplicate immunoblots shown in G and Supplemental Figure S2B. n = 3 and data represent mean ± SEM. Half-lives were calculated from single exponential fits to the H3K36me3 and H3K36me2 relative abundance data using GraphPad Prism 5.
We then evaluated the functional effects of LANS-Set2. LANS-Set2 was introduced into the KLY78 set2Δ strain in which HIS3 was placed under the control of a cryptic promoter at FLO8+1626. Survival of these cells on solid media lacking histidine is dependent on conditions that enable aberrant transcriptional initiation from the cryptic promoter (Fig. 2C; Silva et al. 2012). Set2 loss promotes cryptic initiation at the FLO8 locus. Colony growth assays showed that cells expressing LANS-Set2 grown in the dark phenocopy a set2Δ strain, whereas the same cells grown in the light phenocopy wild-type SET2, with some residual growth (Fig. 2C; Supplemental Fig. S1F). We also characterized LANS-Set2 in the set2Δbur1Δ BUR1 shuffle strain wherein growth on solid media with 5-fluoroorotic acid (5-FOA), which selects against the BUR1/URA3 plasmid, indicates the bypass of the requirement for Bur1 kinase (Keogh et al. 2003, 2005). The bur1Δ bypass spotting assay showed that cells expressing LANS-Set2 grown in the dark phenocopy a set2Δ strain, whereas these cells grown in the light phenocopy wild-type SET2 (Fig. 2D; Supplemental Fig. S1G). Taken together, these data indicate that LANS-Set2 modulates phenotypic effects associated with Set2 status.
We next interrogated the dynamics of H3K36 methylation and demethylation by LANS-Set2 in set2Δ cells. Cells were cultured in the dark or light until log phase growth. Light conditions were then reversed, and cells were collected over time to quantify H3K36me2 and H3K36me3. Following dark-to-light transition, in which LANS-Set2 localizes to the nucleus, we observed accumulation of H3K36me2 (t1/2 = 20 min) and H3K36me3 (t1/2 = 27 min) (Fig. 2E,F; Supplemental Fig. S2A). Following light-to-dark transition, leading to export of LANS-Set2 from the nucleus, we observed loss of H3K36me2 (t1/2 = 40 min) and H3K36me3 (t1/2 = 49 min) (Fig. 2G,H; Supplemental Fig. S2B). To validate these kinetics, we used a different method for nuclear depletion (Haruki et al. 2008). Anchor-away (AA) fuses a C-terminal FRB domain to Set2 at its native locus. Exposure to rapamycin results in the nuclear export of Set2-FRB. We probed for steady-state H3K36me levels with and without rapamycin. We also evaluated methylation over time following addition of rapamycin (Supplemental Fig. S2C–F). Although differences in steady-state H3K36me2 and H3K36me3 levels were greater for the AA method than for LANS-Set2 (Fig. 2B; Supplemental Fig. S2F), kinetics for loss of each mark were similar or slower for the AA method (Supplemental Fig. S2G,H). Despite overexpression of LANS-Set2 compared to Set2-FRB (Supplemental Fig. S2I,J), our optogenetic switch shows rapid kinetics and reversibility (Supplemental Movie S1), although with a lower dynamic range than the AA method. We observed wide variability in Set2/G6PDH levels over our time courses, underscoring the importance of blotting for histone methylation and histones on the same membrane for accurate normalization.
Thus, our photoactivatable LANS-Set2 provides a rapid and reversible tool with which to probe dynamics of H3K36me gain and loss. Herein, LANS-Set2 activation refers to nuclear localization of LANS-Set2 (dark-to-light transition), and LANS-Set2 inactivation refers to cytoplasmic localization of LANS-Set2 (light-to-dark transition).
Optogenetic control of LANS-Set2 reveals genome-wide H3K36 methylation and demethylation kinetics
To interrogate the genome-wide dynamics of H3K36me3 gain and loss, we performed chromatin immunoprecipitation for H3K36me3 and H3 followed by high-throughput sequencing (ChIP-seq) in set2Δ cells expressing LANS-Set2. Cells were collected at multiple time points following either LANS-Set2 activation (0, 20, 40, 60 min) or LANS-Set2 inactivation (0, 30, 60, 90 min), as determined from the methylation kinetics detected by immunoblot (Fig. 2F,H), constituting a longitudinal study design with replicate observations (n = 3). To enable quantitative normalization for subsequent analyses, ChIP-seq experiments were spiked-in with Schizosaccharomyces pombe (S. pombe) chromatin, H3K36me3 signal was normalized to H3 signal, and H3K36me3 signal was scaled by the S. pombe reads. Given the use of genomic approaches to examine H3K36me3 kinetics, the signals we report reflect the combined effects of a variety of factors, including cells at various stages with different gene expression profiles and demethylase activity, neighboring nucleosomes with multiple tails, and different fragment sizes and immunoprecipitation efficiencies.
With these underlying parameters in mind, we excluded overlapping genes from the analyses because ChIP-seq signal could not be confidently attributed to an individual gene. To assess whether introns had significantly different H3K36 methylation patterns that could bias downstream analyses, we compared the mean signal of each intron to its flanking exons. Although median intronic signal was lower than median exonic signal, this difference did not reach significance at any time point across all replicates in LANS-Set2 activation (Supplemental Fig. S3A–D). Fold change between intronic and pre-exonic signal also lacked a clear trend, appearing evenly distributed with a mean around 0 (Supplemental Fig. S3E–H). This pattern was consistent in the context of LANS-Set2 inactivation (Supplemental Fig. S3I–P). Based on these results, intron-containing genes were not excluded from subsequent analyses.
As expected, H3K36me3 signal primarily localized over gene bodies, rather than the transcription start sites (TSSs) of genes (Fig. 3A). There was also a clear increase and decrease in H3K36me3 levels following LANS-Set2 activation and inactivation, respectively (Fig. 3A). To determine how H3K36me3 temporal dynamics varied across the genome, we first calculated the average H3K36me3 signal at each time point for every gene across each of the replicates (n = 3) following LANS-Set2 activation and inactivation. Consistent with our western blots, H3K36me3 signal increased and decreased at genes following LANS-Set2 activation and inactivation, respectively (Fig. 3B,C). H3K36me3 changes occurred relatively equally over genes without a 5′ or 3′ preference (Supplemental Fig. S3Q,R). Per-gene H3K36me3 signal increased at an approximately linear rate following LANS-Set2 activation (Fig. 3B). In contrast, H3K36me3 signal loss was less linear; individual gene H3K36me3 signal loss following LANS-Set2 inactivation occurred largely within the first 60 min.
Figure 3.

Optogenetic control of LANS-Set2 reveals genome-wide H3K36 methylation and demethylation kinetics. (A) Genome browser ChIP-seq signal track of a representative example of LANS-Set2 activation (green) and inactivation (purple) over the time course experiment. Signal is normalized by H3 ChIP-seq signal and scaled by the internal spike-in S. pombe DNA. (B,C) Distribution of mean, per-gene normalized LANS-Set2 activation (B) or LANS-Set2 inactivation (C). ChIP-seq signal represented as interquartile range box plots over the time course. Each line represents the mean of the replicates for a specific gene over time. (D,E) Distribution of the relative LANS-Set2 activation (D) or LANS-Set2 inactivation (E) ChIP-seq signal over time. To highlight relative H3K36me3 changes for each gene, the maximum signal value over all time points was set to 1, and subsequent time points became a fraction of that maximum.
Previous studies (Pokholok et al. 2005) identified an association between H3K36me3 levels at genes and RNA abundance, which may explain the variations seen in mean H3K36me3 ChIP-seq levels. The broad differences in H3K36me3 levels between genes obscured our ability to discern changes in the subtle patterns and/or trends of H3K36me3 deposition or removal over time (Fig. 3C). To account for this, we scaled the H3K36me3 signal for each gene relative to the gene maximum H3K36me3 signal per replicate, resulting in H3K36me3 signal represented as a fraction of maximum H3K36me3 signal. By doing this, we created an internally normalized, per-gene H3K36me3 signal for each time point (henceforth referred to as relative H3K36me3 signal). Normalizing each gene relative to itself allowed us to directly compare the rates of H3K36me3 deposition or removal between genes independent of overall H3K36me3 levels.
As expected, the maximum H3K36me3 signal for most genes was observed at the final time point (for LANS-Set2 activation) and initial time point (for LANS-Set2 inactivation, represented as a fractional value of 1) (Fig. 3D–E). This approach revealed the linearity of H3K36me3 signal gain upon LANS-Set2 activation. In contrast, H3K36me3 loss was nonlinear with a rapid decrease over the initial 0–60 min, slowing over the subsequent 30 min. Although the final H3K36me3 levels for a specific gene reflects transcript abundance, these data suggest that the relative gain of methylation occurs at a consistent rate for most genes. In contrast, loss of methylation resembles an exponential decay trend. Considering H3K36 methylation state as the product of enzymatic activities suggests that H3K36me3 deposition and removal rates are governed by discrete mechanisms.
A statistical model of H3K36me3 dynamics defines fixed and stochastic properties of H3K36me3 gain and loss
We next sought to determine whether H3K36me3 dynamics were influenced by known biological features using a statistical model that accounted for variability across replicates in the relative H3K36me3 gain and loss over time. Specifically, we used a Bayesian generalized linear mixed effect model (GLMM), accommodating the non-normality of the H3K36me3 signal (as either absolute or relative quantities) and the longitudinal and replicate study design, and identified genes with significant rates of H3K36me3 signal gain or loss with time (Fig. 4A; Supplemental Fig. S4A,B). The GLMM estimates are not simple summary rates; instead they are the coefficients of time from the model, which implicitly accounts for the dynamic rate that is expected for non-normal data (e.g., H3K36me3 change flattening with time). More extreme values for the GLMM estimate represent greater H3K36me3 change over time.
Figure 4.

A statistical model of H3K36me3 dynamics defines fixed and stochastic properties of H3K36me3 gain and loss. (A) Posterior H3K36me3 rates from Bayesian generalized linear mixed model (GLMM) for normalized ChIP-seq signal (left) and relative H3K36me3 ChIP-seq signal (right) for the gene CDS1 (YBR029C) throughout the time courses of LANS-Set2 activation (green) and LANS-Set2 inactivation (purple). Dashed lines represent individual ChIP-seq replicates, and bold lines represent the GLMM posterior mean of the rate. Shaded regions indicate the 95% credible interval on the rate parameter. (B) Venn diagram of the high-confidence genes identified within LANS-Set2 activation (green) and LANS-Set2 inactivation (purple). High-confidence genes had a clear positive or negative rate, defined as having 95% credible intervals that never include zero (on the linear predictor). (C) Per-gene GLMM rates for normalized H3K36me3 ChIP-seq signal and relative H3K36me3 ChIP-seq signal for both LANS-Set2 activation (green) and LANS-Set2 inactivation (purple). Solid circles signify high-confidence genes, whereas hollow circles represent low-confidence genes. (D) Histogram of GLMM rates within the shared high-confidence gene set between LANS-Set2 activation (green) and LANS-Set2 inactivation (purple) (n = 4117). (E) LANS-Set2 activation GLMM rates compared to average, normalized H3K36me3 ChIP-seq levels at t = 60 min for each gene in the shared, high-confidence gene set. Each gene is colored by mean RNA abundance levels (log TPM) at the same time point. (F) LANS-Set2 inactivation GLMM rates compared to average, normalized H3K36me3 ChIP-seq levels at t = 0 min for each gene in the shared, high-confidence gene set. Each gene is colored by mean RNA abundance levels (log TPM) at the same time point. (G) LANS-Set2 activation GLMM rates compared to mean RNA abundance levels (log TPM) at t = 60 min for genes that were high confidence for both LANS-Set2 activation and inactivation. The Pearson correlation coefficient is r = 0.055. The dashed lines represent the line of best fit. (H) LANS-Set2 inactivation GLMM rates compared to mean RNA abundance levels (log TPM) at t = 0 min for genes that were high-confidence gene in both sets. Pearson correlation coefficient is r = 0.206. Dashed line represents the line of best fit.
We defined a class of high-confidence genes with significant temporal dynamics based on the 95% highest posterior interval on the time rate parameter from the GLMM not covering 0. Genes with positive rate parameters had H3K36me3 signal increase over time, and those with negative rates had a decrease in H3K36me3 signal over time. For relative H3K36me3 signal, we found 4231 (79%) and 5142 (96%) high-confidence genes (out of 5355 total genes) following LANS-Set2 activation and inactivation, respectively. A strong majority of these (4117) were high confidence in both conditions (Fig. 4B; Supplemental Fig. S4C). The GLMM found consistent trends in H3K36me3 dynamics whether either relative or absolute H3K36me3 signal (quasi-counts) (Methods) was fit, suggesting that our findings were not biased based on data transformation (Fig. 4C; Supplemental Fig. S4D). LANS-Set2 activation rates were more extreme than inactivation rates suggesting, across genes, H3K36me3 is deposited at a faster rate than it is lost (Fig. 4D; Supplemental Fig. S4E), consistent with the western blots (Fig. 2F,H). Furthermore, the magnitude of H3K36me3 gain and loss rates were correlated (r = 0.438), implying that genes with faster methylation also had faster demethylation (Supplemental Fig. S4F).
We investigated the relationship of rates of H3K36me3 gain and loss to gene length, average H3K36me3 levels, and RNA abundance levels. We first evaluated how they related to maximum LANS-Set2 levels at t = 60 for activation and t = 0 for inactivation, which most closely resemble wild-type conditions. RNA-seq (n = 3) was performed at each ChIP-seq time point in both LANS-Set2 activation and inactivation conditions (however, one replicate failed at the 60-min time point in LANS-Set2 activation). Consistent with previous studies (Kemmeren et al. 2014; McDaniel et al. 2017), the loss of Set2 had a negligible impact on RNA abundance (Supplemental Fig. S4G). The RNA abundance for 445 genes (out of 6692) was significantly different after LANS-Set2 activation (Supplemental Fig. S4H). LANS-Set2 inactivation affected the RNA abundance of 313 genes (Supplemental Fig. S4I). LANS-Set2 activation was associated predominantly with increased RNA abundance (313 genes with increased levels vs. 132 decreased), whereas LANS-Set2 inactivation decreased more (245 genes decreased vs. 68 increased). Following LANS-Set2 activation, enriched RNA ontologies included “oxidoreductase activity” (adjusted P ≤ 4.96 × 10⁻¹¹) for genes with decreased RNA abundance, and “structural constituent of ribosome” (adjusted P ≤ 2.40 × 10−73) for genes with increased abundance. Genes with increased RNA abundance after LANS-Set2 inactivation were not significantly enriched for any specific ontologies; however, genes that decreased had one significant ontology, “oxidoreductase activity” (adjusted P ≤ 1.78 × 10⁻⁶).
Before associating relative H3K36me3 rates of change with genomic features, we explored the relationship between H3K36me3 levels and RNA abundance. Maximum LANS-Set2 levels (t = 60 min in LANS-Set2 activation, t = 0 min in LANS-Set2 inactivation) were highly concordant with RNA abundance (r = 0.467 and r = 0.486, respectively) (Supplemental Fig. S4J) in the high-confidence gene set, consistent with previous studies (McDaniel et al. 2017). We also compared gene length to both mean H3K36me3 signal and RNA abundance at time points most closely resembling wild-type conditions and found limited (Supplemental Fig. S4K) to no (Supplemental Fig. S4L) association for both Set2 activation and inactivation conditions.
We then asked whether gene length or H3K36me3 levels associated with the relative rate of H3K36me3 change and found that neither feature was predictive of relative H3K36me3 rates of change after LANS-Set2 activation (Fig. 4E; Supplemental Fig. S4M–P) or inactivation (Fig. 4F; Supplemental Fig. S4Q–T). We therefore hypothesized that H3K36me3 rates of change may be regulated through transcriptional processes and specifically investigated whether H3K36me3 change was associated with RNA abundance. We found that RNA abundance was not strongly correlated with the relative rate of H3K36me3 gain upon Set2 activation (r = 0.055) (Fig. 4G), although the magnitude of relative H3K36me3 loss rates with LANS-Set2 inactivation were slightly correlated (r = 0.206) (Fig. 4H). Thus, although final H3K36me2/3 levels correlate with increased RNA abundance, as expected, the relative H3K36me3 rate of deposition over time is consistent between genes, regardless of transcriptional frequency.
H3K36me3/2 removal is largely mediated by Rph1
We next investigated the relative impact of putative demethylases on H3K36 dynamics. In a LANS-Set2 expressing set2Δ strain, we deleted putative demethylases in yeast (Rph1, Jhd1, Ecm5, Gis1) (Tu et al. 2007). Cells were grown in the light and probed for H3K36me3 and H3K36me2. RPH1 deletion had the largest effect on H3K36me3, increasing global levels by approximately twofold (Fig. 5A,B; Supplemental Fig. S5A,B). To compare methylation levels between wild-type and the rph1Δ mutant without using LANS-Set2, we probed for H3K36me3 in both wild-type cells and after deletion of RPH1 or deletion of SET2 and found that deletion of RPH1 increases H3K36me3 by ∼1.3-fold (Supplemental Fig. S5C,D).
Figure 5.

H3K36me3/2 removal is largely mediated by Rph1. (A) Representative western blot analysis of whole-cell lysates prepared from log-phase cultures of the indicated strains transformed with LANS-Set2 and grown continuously in the light. Asterisks indicate nonspecific bands. (B) Quantification of H3K36me3 from triplicate immunoblots shown in A and Supplemental Figure S5A. Data represent mean values ± SD (n = 3). (*) P < 0.05. (C) Representative western blot analysis of whole-cell lysates probing loss of H3K36me3 over time using LANS-Set2 in set2Δrph1Δ after the transition of log-phase cultures from light to dark (for replicates, see Supplemental Fig. S5E). Asterisks indicate nonspecific bands. (D) Quantification of H3K36me3 as a function of time from triplicate immunoblots shown in Figure 2G and Supplemental Figure S2B (set2Δ) and Figure 5C and Supplemental Figure S5E (set2Δrph1Δ). n = 3 and data represent mean ± SEM.
The dynamics of H3K36 demethylation were then evaluated following LANS-Set2 inactivation. We found that the rate of H3K36me3 loss was most impacted in the set2Δrph1Δ strain (Fig. 5C,D; cf. Fig. 2H to Supplemental Fig. S5F,H,J,L). The rate of loss of H3K36me2 was most impacted in the set2Δjhd1Δ and set2Δecm5Δ strains, and the rate of loss in the set2Δgis1Δ strain was similar to the set2Δ strain (Supplemental Fig. S5G–L). We also examined whether disruption of ASF1, a histone exchange factor that contributes to replication and transcription, would affect loss of methylation. Deletion of ASF1 minimally impacted loss of H3K36 methylation (Supplemental Fig. S5M–P; Rufiange et al. 2007). We also examined the impact of replication by adding α-factor to arrest cells in G1 before LANS-Set2 inactivation. Cell cycle arrest minimally impacted loss of H3K36 methylation (Supplemental Fig. S5Q–T). Taken together, these data indicate that Rph1 primarily mediates loss of H3K36 trimethylation, whereas Jhd1 is primarily responsible for H3K36me2 demethylation.
Global H3K36me3 removal is associated with a one-phase exponential rate of decay
To explore the impact of deregulated demethylation on H3K36me3 distribution, we performed a ChIP-seq time course following LANS-Set2 inactivation in set2Δrph1Δ cells. In the absence of Rph1, H3K36me3 signal was retained over genes, and total H3K36me3 levels were increased (Fig. 6A; Supplemental Fig. S6A). The effect of Rph1 loss was apparent when comparing all genes across the time points (Wilcoxon rank sum test, P < 2.2 × 10⁻¹⁶ for all time points) (Fig. 6B). After scaling the average H3K36me3 levels relative to each gene's maximum H3K36me3 level, we observed a clear difference between set2Δrph1Δ and set2Δ relative H3K36me3 signals, with the largest difference between strains at 60 min following LANS-Set2 inactivation (Fig. 6C). By 90 min, the difference was largely eliminated, suggesting that Rph1 is most active in the early demethylation of H3K36me3.
Figure 6.

Global H3K36me3 removal is associated with a one-phase exponential rate of decay. (A) Genome browser ChIP-seq signal track of a representative example of LANS-Set2 inactivation in a set2Δ (green) or set2Δrph1Δ (red) background over the time course experiment. Signal is normalized by internal spike-in S. pombe DNA and H3 ChIP-seq signal. (B) Distribution of mean, per-gene normalized LANS-Set2 inactivation ChIP-seq signal represented as interquartile box plots across the time course in a set2Δ (green) or set2Δrph1Δ (red) background. Each line represents the mean of all three replicates for one specific gene over time. Gray box plots represent LANS-Set2 inactivation in the set2Δ background (as seen in Fig. 3C), and black box plots represent the set2Δrph1Δ background. (C) Distribution of the relative LANS-Set2 inactivation ChIP-seq signal in a set2Δ (green) or set2Δrph1Δ (red) over time. To highlight relative H3K36me3 change for each gene, the maximum signal value over all time points was set to 1, and subsequent time points became a fraction of that maximum. Gray box plots represent LANS-Set2 inactivation in the set2Δ background (as seen in Fig. 3E), and black box plots represent the set2Δrph1Δ background. (D) Venn diagram of the high-confidence genes identified within LANS-Set2 inactivation in a set2Δ (green) or set2Δrph1Δ (red) background. High-confidence genes were determined to have a clear negative trend based on the 95% credible interval of the GLMM rate never including zero (on the linear predictor). (E) Histogram of the GLMM rates within the shared high-confidence gene set between LANS-Set2 inactivation in a set2Δ (green) or set2Δrph1Δ (red) background (n = 3531). (F) Jointly modeling the set2Δ and set2Δrph1Δ backgrounds of LANS-Set2 inactivation rates revealed a lag in set2Δrph1Δ compared to set2Δ across the time course. Points above zero indicate genes with a higher GLMM loss rates in set2Δ compared to set2Δrph1Δ at a given time point, whereas points below zero indicate genes with lower GLMM rates in set2Δrph1Δ compared to set2Δ. Each line represents one gene across the time course. Box plot borders represent the interquartile range of the difference in GLMM rates between set2Δrph1Δ and set2Δ for each time point.
We then applied a GLMM to the set2Δrph1Δ data (Supplemental Fig. S6B,C). Using the estimated relative H3K36me3 rates of loss, we identified 3531 (of 5355 total) high-confidence genes after Set2 inactivation across both set2Δrph1Δ and set2Δ strains (Fig. 6D). The set2Δrph1Δ H3K36me3 loss rate estimates were less extreme than for set2Δ H3K36me3 loss (Fig. 6E). To formally test for a delay between set2Δrph1Δ and set2Δ H3K36me3 loss, we jointly modeled the set2Δrph1Δ H3K36me3 loss rates against the set2Δ loss rates across genes (Methods). We found that the delay in H3K36me3 loss between set2Δrph1Δ and set2Δ was statistically significant (Fig. 6E). H3K36me3 loss became more disparate between 0 and 60 min, before partially recovering at 90 min (Fig. 6F). Together, these data provide strong support that Rph1 loss significantly slows H3K36me3 demethylation by primarily mediating early demethylation before other factors.
Finally, we examined the relationship of H3K36me3 decay in the absence of Rph1 to RNA abundance. Relative H3K36me3 demethylation rates in the absence of Rph1 were not strongly correlated to transcriptional frequency (r = 0.132) (Supplemental Fig. S6D), suggesting that the relative rate of H3K36me3 loss is largely uniform across all transcribed genes and mostly independent of RNA abundance, suggesting that H3K36me removal is largely uncoupled from transcription elongation.
Discussion
In this study we sought to quantitatively explore the dynamics of H3K36me addition and removal in response to Set2 modulation. We created a light-controlled variant of Set2 (LANS-Set2) that offered a rapid and reversible tool to generate a per-signal kinetic model based on aggregate values that are, in turn, based on many parameters. Using this photoswitch, we investigated H3K36me3 deposition by Set2 in the presence of competing endogenous demethylases. Total levels positively correlate with transcriptional frequency, in agreement with prior studies. However, by internally scaling H3K36me3 deposition to the total H3K36me3 levels, we found the rate at which each gene achieves its maximum level to be largely uniform. These data are consistent with the idea that H3K36me3 deposition is cotranscriptional and that H3K36me3 deposition occurs at a defined rate that may be regulated by the limited number of Set2 molecules associated with RNAPII combined with the rate of polymerase elongation. In this model, a higher level of H3K36me3 at more highly transcribed genes results from multiple rounds of transcription, in which each round of transcription mediates a fixed amount of H3K36 methylation per nucleosome across the population of cells. Additionally, the linear rate of H3K36me3 gain across protein-coding genes also suggests that Set2 activity remains constant over the time course of H3K36 methylation deposition. H3K36me deposition may therefore be controlled by a limited amount of Set2 that can interact with RNAPII. Alternatively, the residency time of Set2 at nucleosomes could be influenced by the speed of RNAPII elongation. Consistent with the idea of limited binding capacity of Set2 with RNAPII at genes, we observed that overexpression of SET2 in yeast does not result in increased H3K36me levels (DiFiore et al. 2020). Future studies will be required to explore this model further, for example, by increasing either the length of the CTD or levels of serine 2 CTD phosphorylation as a means to accommodate additional molecules of Set2 on RNAPII. In addition, future studies will be required to examine H3K36me deposition in the absence of demethylases to determine absolute rates of deposition independent of demethylation.
H3K36me2/3 demethylation occurs more slowly than deposition. Demethylation shows a pattern that cannot be explained by simple passive loss through cell division or by histone exchange. Rather, and in agreement with work by others, H3K36me2/3 is removed through the activity of multiple H3K36 demethylases, primarily Rph1 that targets H3K36me3. We showed that H3K36me2/3 is lost at the same timescale for all genes, regardless of H3K36 methylation levels. This first-order kinetic pattern of demethylation suggests that the rate of demethylation is regulated by the abundance and equal availability of H3K36 methylation as a substrate. This pattern differs from that associated with a mechanism of directed or controlled removal, which might be observed if a fixed number of H3K36 demethylase molecules were associated with RNAPII during transcription elongation. In this scenario, highly transcribed genes would lose H3K36me3 more rapidly than lowly transcribed ones, and the rate at which H3K36me3 is lost would appear linear and correlate with RNA abundance levels. As relative H3K36me3 loss resembles a decay curve and we found minimal association between H3K36me3 loss rates and RNA abundance, our study suggests that H3K36 demethylation occurs through a stochastic and continuous mechanism. This finding is supported by a previous study demonstrating H3K36me3 loss after transcription cessation at a galactose-inducible locus, further suggesting that demethylation is continuous irrespective of transcription (Sein et al. 2015). Future studies with more data collected at earlier time points after Set2 inactivation may support alternate hypotheses in which demethylation function may be more directed, and a more comprehensive mechanistic view may evolve with nascent RNA or RNAPII occupancy instead of RNA abundance. In addition, future studies that use orthogonal techniques simultaneously, for example, chromatin immunoprecipitation integrated with mass spectrometry, may provide the resolution to address methylation dynamics across the multiple histone tails of adjacent nucleosomes.
Although Set2 methylation is known to function in transcription-associated activities, including the prevention of cryptic transcription, a recent report uncovered the potential for Set2 methylation and demethylation by Rph1 to function in metabolic pathways that control amino acid biosynthesis (Ye et al. 2017). More specifically, Set2 methylation promotes S-adenosylmethionine (SAM) consumption to drive cysteine and glutathione biosynthesis, whereas H3K36me removal is linked to the biosynthesis of methionine. Thus, H3K36 acts as a methylation “sink” that controls various biosynthetic pathways involving SAM. Consistent with this report, our studies support the idea that Rph1 acts in a global and stochastic manner for a role other than one in transcription. Our data, in combination with previous work showing that H3K36me2 is largely targeted by Jhd1 (Fang et al. 2007), may suggest that the combination of multiple H3K36 demethylases in fact function to maintain the balance of available SAM and the histone methylation sink.
The histone sink theory described above leads to an important question: How does Set2 methylation function in transcriptional regulation but also in amino acid biosynthetic pathways that are perhaps uncoupled to transcription? Although at first approximation it might seem these two functions of Set2 are incompatible, they may not be mutually exclusive. For example, it may be that only a small amount of H3K36 di- and trimethylation is sufficient to regulate the Rpd3S deacetylation pathway, whereas higher amounts of H3K36me may function in amino acid and SAM biosynthesis pathways. In this model, mutants that result in a significant reduction of global H3K36me2/3 levels might not impact the ability of Rpd3S to limit histone acetylation levels at genes, thereby still preventing cryptic transcription. Consistent with this idea, several studies have shown that mutations in transcription elongation factors like the PAF complex and Spt6, or Set2 itself, that reduce H3K36 methylation amounts still supress cryptic initiation (Cheung et al. 2008; Silva et al. 2012; Dronamraju and Strahl 2014). We observed that those genes that were the most impacted by Set2 loss were metabolic genes associated with amino acid biosynthesis.
In summary, our optogenetic system offers a level of control that permitted genome-wide analysis of H3K36me methylation and demethylation. By combining optogenetic, genomic, and statistical techniques, we achieved fine resolution of dynamics of H3K36 methylation genome-wide. This provided inference on the parameters of transcription-dependent deposition and transcription-independent removal that builds from prior studies to illuminate new details on how the cycle of Set2 methylation and removal is achieved. These studies also offer a strategy for further use of optogenetic approaches to study other chromatin modifiers with improved spatiotemporal control, and to obtain a more quantitative, time-resolved understanding of the dynamics of chromatin regulation.
Methods
Reagents
The following antibodies were used: Set2 (raised in lab, 1:5000), G6PDH (Sigma-Aldrich A9521, 1:100,000), H3K36me3 (Abcam 9050, 1:1000 for ECL, 1:2000 for LI-COR, and 2 μL for ChIP), H3K36me2 (Active Motif 38255, 1:1000 for ECL and 1:2000 for LI-COR), H3K36me1 (Abcam 9048, 1:1000 for ECL and 1:2000 for LI-COR), H3K79me3 (Abcam 2621, 1:2000), H3 (EpiCypher 13-0001, 1:1000) (Supplemental Fig. S1C) (Abcam 12079, 1:1000; CST 14269, 1:2000 for LI-COR, and EMD MilliporeSigma 05-928 2 µL for ChIP) (Supplemental Fig. S1E). Rabbit (Amersham NA934, Donkey anti-Rabbit), goat (Santa Cruz 2768, Rabbit anti-Goat), rabbit (Thermo Fisher Scientific SA5-10044, Donkey anti-Rabbit DyLight 800), and mouse (Thermo Fisher Scientific 35518, Goat anti-mouse DyLight 680) secondary antibodies were used at 1:10,000.
Strain generation
All strains were in the BY4741 background unless otherwise stated. Gene deletions (SET2, RPH1, JHD1, ECM5, and GIS1) were performed by gene replacement using the PCR toolkit. The Set2-FRB strain was generated by amplifying FRB-KanMX6 from pFA6a-FRB-KanMX6 (HHY168, Euroscarf) and inserting it at the SET2 3′ end by homologous recombination. Strains are listed in Supplemental Table S1.
DNA cloning
The mVenus-NES1-Set2 plasmid was Gibson assembled from an mVenus-NES1-MCS plasmid and SET2 amplified from BY4741 genomic DNA. The resulting mVenus-NES1-Set2 plasmid was then blunt-end cloned to create the mVenus-Set2 plasmid by digestion with XbaI and XmaI, polishing with Phusion polymerase, and subsequent ligation to remove NES1. The mVenus-NES1-Set2 plasmid was also used to make the NES2 and NES3 variants by cutting the plasmid with XbaI and SbfI to remove NES1 and ligating annealed inserts.
Similarly, the mVenus-NES1-Set2NLSΔ plasmid was Gibson assembled from the mVenus-NES1-MCS plasmid and SET2NLSΔ with XmaI restriction site at its 5′ and XhoI at its 3′ that was generated by two rounds of overlap extension PCR from BY4741 genomic DNA to sequentially mutate the bipartite NLS. The mVenus-NES1-Set2NLSΔ plasmid was then used to make plasmids as above: the mVenus- Set2NLSΔ plasmid was generated by blunt-end cloning, and the NES2, NES3, and NLS variants were generated by cutting and ligating annealed inserts.
The mVenus-LANS-Set2 plasmid was constructed by inserting SET2NLSΔ into the MCS of an mVenus-LANS-MCS plasmid: SET2NLSΔ was generated as above, both the insert and the plasmid were cut with XmaI and XhoI, and ligation was performed. The resulting plasmid was used to generate the LANS-Set2 plasmid lacking mVenus: a LANS-Set2NLSΔ cassette with HpaI restriction site at its 5′ and XhoI at its 3′, and the mVenus-LANS-Set2 plasmid were cut with HpaI and XhoI and ligated to remove mVenus. All plasmids were sequence verified (Eurofins). Selected plasmids are listed in Supplemental Table S2.
Microscopy
Yeast samples were imaged and photoactivated with an Olympus FV1000 confocal microscope equipped with a 100 (N.A. 1.40) oil immersion objective. Image acquisition for mVenus and mCherry used the 514 nm and 559 nm laser lines, respectively, to acquire 800 × 800 images of a single optical section. For photoactivation of cells expressing mVenus-LANS-Set2, a time line of image acquisition and photoactivation was generated with the Time Controller module in the Olympus FluoView software. An image was taken before activation, after which activation images were taken every 25 sec with activation in between each image acquisition for 10 cycles. After activation, images were acquired every 10 sec for 50 cycles of imaging. The activation sequence consisted of rasterizing 800 × 800 pixels with 1% of the 488 nm laser and pixel dwell time of 8 μsec/pixel.
Spotting
Overnight cultures of relevant strains were transformed and plated on appropriate SC plates that were then incubated at 30°C in the dark. Colonies were resuspended in the appropriate SC dropout media and grown at 30°C in the dark. Overnight cultures were diluted to an OD600 of 0.5 (FLO8-HIS3 cryptic transcription initiation assay) or 2.0 (bur1Δ bypass assay). Fourfold (FLO8-HIS3 assay) or fivefold (bur1Δ assay) serial dilutions were spotted onto appropriate plates. For the GAL-inducible FLO8-HIS3 cryptic transcription initiation assay, dilutions were spotted onto SC−Leu−His plates containing 1% galactose and 1% raffinose as well as SC−Leu plates. For the bur1Δ bypass assay, dilutions were spotted onto SC−Leu−Ura plates with and without 5-FOA to select against the pRS316-Bur1 plasmid. Growth was assayed after between 48 and 96 h as indicated for plates placed either in the dark or in 500 μW/cm2 blue light emitted from an LED strip with maximum emission at 465 nm.
Steady-state immunoblotting
BY4741 wild-type and set2Δ overnight cultures were transformed and plated on SC−Leu plates that were then incubated in the dark at 30°C. A colony from the LANS-Set2 transformation was resuspended in SC−Leu and split into light and dark cultures, whereas all other transformants were resuspended and grown in the dark. A colony from the Set2-FRB strain was resuspended in YPD and split into cultures either lacking rapamycin or with exposure to 1 μg/mL rapamycin in ethanol. All cultures were placed in the same incubator overnight at 30°C: dark cultures were wrapped in foil and light cultures were exposed to 500 μW/cm2 blue light (465 nm) from an LED strip wrapped around the base of the tube rack. In the morning cell density was measured at OD600 and cultures were diluted in SC−Leu to a final OD600 of 0.3 in a final volume of 6.5 mL. Cultures were then returned to an incubator at 30°C in either the same light conditions or the same rapamycin exposure conditions for 5 h, after which OD600 was measured and 5 OD600 units of each asynchronous log-phase culture were collected. Samples for chemiluminescent detection (Supplemental Fig. 1C,E and all Set2 and G6PDH blots) were processed as follows: cells were collected by centrifugation and lysed using glass beads and vortexing for 8 min at 4°C in SUMEB (1% SDS, 8 M urea, 10 mM MOPS, pH 6.8, 10 mM EDTA, 0.01% bromophenol blue). Extracts were retrieved, centrifuged, and boiled for 5 min at 95°C. Samples for near-infrared fluorescent detection (all other figures) were processed as follows: cells were added to the appropriate volume of 100% TCA (Sigma-Aldrich, 100% w/v) to obtain a final concentration of 20% TCA, mixed and centrifuged at 5000 RPM. Supernatants were discarded and pellets were stored at −80°C. After freezing, samples were resuspended in TCA buffer (10 mM Tris, pH 8.0, 10% TCA, 25 mM NH4OAc, 1 mM Na2 EDTA), and then mixed and incubated for 10 min on ice. Samples were centrifuged, resuspended in resuspension buffer (0.1 M Tris, pH 11.0, 3% SDS), and boiled for 10 min at 95°C. Samples were centrifuged to clarify the extracts, protein was quantified using the DC assay, and samples were diluted in resuspension buffer to equivalent concentrations and further diluted in 2× SDS Loading Buffer (60 mM Tris pH 6.8, 2% SDS, 10% glycerol, 0.2% bromophenol blue, 100 mM DTT added fresh). Ten microliters of whole-cell extracts from either preparation method were loaded on 15% SDS-PAGE gels (or 8% SDS-PAGE for the Set2 blot). Proteins were transferred to 0.45 μm PVDF membranes (MilliporeSigma Immobilon-FL for near-infrared fluorescent detection) using a Hoefer Semi-Dry Transfer Apparatus at 45 mA per membrane. For chemiluminescent blotting, primary antibodies were incubated in 5% milk overnight at 4°C, and secondary antibodies were incubated for 1 h in 5% milk. Immunoblots were developed using ECL Prime (Amersham RPN2232). For near-infrared fluorescent blotting, primary antibodies were incubated in Odyssey blocking buffer overnight at 4°C, and secondary antibodies were incubated in Odyssey blocking buffer with 0.015% SDS for 1 h.
Photoactivation and anchor-away immunoblotting
Colonies from LANS-Set2 transformations of the appropriate yeast strain were resuspended in SC−Leu and grown in the dark or 500 μW/cm2 blue light overnight at 30°C. For the Set2-FRB anchor-away strain, colonies were resuspended in YPD and grown without rapamycin exposure at 30°C. In the morning, cell density was measured at OD600 and cultures were diluted in SC−Leu to a final volume of 70 mL and final OD600 of 0.35 (OD600 of 0.3 for Set2-FRB). For set2Δbar1Δ cultures, after 3 h cultures were split into two cultures, one of which was treated with 0.1 μg/mL of alpha-factor (Diag RP01002), grown another 1.5 h, visualized to ensure arrest in treated cells, and grown another 30 min. All other cultures were grown in the same light conditions, although light cultures were grown in 200 μW/cm2 blue light (465 nm emitted from an LED strip above the culture flasks) for 4.5 h of growth at 30°C, at which point five OD600 units of each asynchronous log-phase culture were collected. Time courses began when cultures were moved from the dark to the light or from the light to the dark (or for the Set2-FRB strain, upon addition of 1 μg/mL rapamycin in ethanol). At each time point the same volume of each culture (five OD600 units measured at time zero) was harvested by the TCA method detailed above. Frozen pellets were further processed as above after the completion of each time course.
Immunoblot quantification
Band intensities for H3, H3K36me3, H3K36me2, H3K36me1, and H3K56ac were quantified with local background subtracted using Image Studio Lite. H3K36 methylation and H3K56 acetylation intensities were divided by their respective H3 intensities. To obtain relative abundance throughout the dark-to-light time courses, the last time point was used as a reference for each preceding time point; for the light-to-dark and anchor-away time courses, the first time point was used as a reference for each subsequent time point. Relative abundances were plotted using GraphPad Prism 5, statistical significance was calculated using unpaired two-tailed student's t-test (P < 0.05), and half-lives were obtained by fitting data using single exponentials. The one-phase association equation Y = Y0 + (plateau−Y0) × (1−e−kx) was used to fit values corresponding to the LANS-Set2 dark-to-light time courses, whereas the one-phase decay equation Y = (Y0−plateau) × e−kx) + plateau was used to fit values corresponding to the LANS-Set2 light to dark as well as the anchor-away time courses.
Chromatin immunoprecipitation (ChIP)
For WT, set2Δ, and rph1Δ strains, yeast was resuspended in YPD and grown in the dark overnight at 30°C. For time courses, colonies from LANS-Set2 transformations of the appropriate yeast strain were resuspended in SC−Leu and grown in the dark or 500 μW/cm2 blue light overnight at 30°C. In the morning, cell density was measured at OD600 and cultures were diluted in appropriate media to a final volume of 70 mL and final OD600 of 0.35. Cultures were maintained in the dark or light (200 μW/cm2 blue light) for 4.5 h of growth at 30°C until the OD600 reached 0.8−1.0. For WT, set2Δ, and rph1Δ strains, samples were collected; for time courses, an initial time point was collected then samples were shifted from the dark to light or the light to dark. To collect samples, cells were fixed with a 1% final concentration of formaldehyde, the fixation was quenched, cells were washed, and pellets were frozen at −80°C. After the completion of each time course, cells were lysed using 140 mM FA-lysis buffer (50 mM HEPES, 140 mM NaCl, 1 mM EDTA, 1% Triton X-100, pH 7.5, containing protease inhibitor cocktail). Lysed cells were sonicated (Diagenode Bioruptor UCD-200) on high intensity five times for 5 min each (cycles of 30 sec “ON” and 30 sec “OFF”) and clarified by centrifuging at full speed for 15 min. Notably, immunoprecipitation fragment sizes ranged from 100 to 500 base pairs, and ∼50% of the fragments were 200 base pairs or smaller. Overnight immunoprecipitations of S. cerevisiae chromatin with appropriate antibodies were prepared with S. pombe chromatin spike-in control corresponding to 15% of S. cerevisiae chromatin as estimated by Bradford assay (Bio-Rad). Fifty microliters of Protein G Dynabeads were added to each 500 μL immunoprecipitation reaction, and reactions were incubated for 2 h. Washes were performed with 1 mL of 140 mM FA-lysis buffer, 500 mM FA-lysis buffer (50 mM HEPES, 500 mM NaCl, 1 mM EDTA, 1% Triton X-100, pH 7.5, containing protease inhibitor cocktail), LiCl solution (250 mM LiCl, 10 mM Tris, 0.5% each of NP-40 and sodium doxycholate and 1 mM EDTA), and TE pH 8.0. Elution buffer (1% SDS, 0.1 M NaHCO3) was used to elute the DNA (15 min shaking at 65°C followed by centrifugation at 2000 RPM for 2 min). Ten microliters of 5 M NaCl was added to the eluates and 10% inputs and samples were incubated overnight at 65°C to carry out de-crosslinking. Samples were treated with RNase for 1 h and Proteinase K for 1 h before ChIP DNA Clean & Concentrator (Zymo Research) to extract the DNA.
ChIP-sequencing and data analysis
Barcoded sequencing libraries were prepared as recommended by the manufacturer (KAPA Hyper Prep Kit), pooled, and sequenced (HiSeq 2500, Illumina). Reads from the sequencer were demultiplexed using bcl2fastq (v2.20.0) (https://support.illumina.com/downloads/bcl2fastq-conversion-software-v2-20.html). Sequencing adapters on reads were trimmed using cutadapt (v1.12) (Martin 2011) using options -a GATCGGAAGAGC -A GATCGGAAGAGC and ‐‐minimum-length 36 in paired mode. After trimming, reads were filtered for quality using the fastq_quality_filter in FASTX-Toolkit (v0.0.12) (http://hannonlab.cshl.edu/fastx_toolkit/), with options -Q 33, -p 90, and -q 20. In-house scripts were used to limit potential PCR duplicates by limiting reads with the same sequence to a maximum of five copies and discarding the copies beyond that limit. Because the previous filtering steps may remove one end of a read pair but not the other, both read pair FASTQ files were synced using in-house scripts to ensure proper order for alignment. As the ChIP experiments contained S. pombe spike-in, a chimeric S. cerevisiae–S. pombe genome (sacCer3-ASM294v2) was generated using the genomeGenerate tool in STAR (v2.5.2b) (Dobin et al. 2013). This chimeric genome contains the full sequence of both species, allowing reads to align to their best overall fit between the two species. Once generated, read alignment was done using STAR (v2.5.2b) and options ‐‐outFilterMismatchNmax 2, ‐‐chimSegmentMin 15, ‐‐chimJunctionOverhangMin 15, ‐‐outSAMtype BAM Unsorted, ‐‐outFilterType BySJout, ‐‐outFilterScoreMin 1, and ‐‐outFilterMultimapNmax 1. Post-alignment, SAMtools (v1.31) (Li et al. 2009) and BEDTools (2.26) (Quinlan and Hall 2010) were used to generate bigWig files for downstream analyses. To account for S. pombe spike-in, the bigWig signal was normalized by the total number of S. pombe reads per million, using the -scale option within the BEDTools genomecov tool. Normalized H3K36me3 signal was obtained by dividing H3K36me3 spike-in normalized signal by H3 spike-in normalized signal for each base pair for each replicate. Some regions were devoid of any H3 signal, and these regions were flagged and excluded from further analyses regardless of H3K36me3 signal.
deepTools (v2.5.4) (Ramírez et al. 2016) was used to generate metagene plots using the normalized H3K36me3 signal. deepTools was also used to obtain base-pair-by-base-pair signal over regions of interest such as genes, introns, and exons. This data was used to calculate the average signal per gene, excluding those regions flagged for lacking H3 signal. We set out to understand H3K36me3 signals over time; however, differing levels of normalized H3K36me3 signal within genes made analysis difficult. To account for these differences, we scaled the average signal per gene throughout the time course between 0 (no signal) and 1 (the maximum signal of a gene over the time course). This yielded a relative (proportional) scale for each gene as a fraction of its maximum signal and allowed for easier comparisons of patterns within and across treatments. To yield a comprehensive gene value for plotting, H3K36me3 signal (for both mean and proportional) was the mean of all the replicates for the gene.
RNA isolation
Colonies from WT, rph1Δ, or LANS-Set2 transformations in set2Δ were prepared as above, except that in the morning cultures were diluted in the appropriate media to a final volume of 70 mL and final OD600 of 0.3. Time courses were conducted as above except that 10 mL of log-phase cultures were collected by centrifugation and frozen at −80°C. After the completion of each time course, RNA was isolated by acid phenol extraction. RNA (10 μg) was treated with DNase (Promega) and purified (RNeasy column, Qiagen).
RNA-sequencing and data analysis
RNA (2.5 μg) was processed using rRNA depletion beads specific to yeast (Illumina). Barcoded sequencing libraries were prepared as recommended by the manufacturer (TruSeq Stranded Total RNA Library Preparation Kit, Illumina), pooled, and sequenced (HiSeq 4000, Illumina). Reads from the sequencer were demultiplexed using bcl2fastq (v2.20.0). Reads were trimmed using cutadapt (v1.12) using options -a GATCGGAAGAGC -A GATCGGAAGAGC and ‐‐minimum-length 36 to remove any sequencing adapters. After trimming, reads were filtered for quality using the fastq_quality_ filter in FASTX-Toolkit (v0.0.12), with options -Q 33, -p 90, and -q 20. Reads were aligned to the sacCer3 genome using STAR (v2.5.4b) with options ‐‐quantMode TranscriptomeSAM, ‐‐outFilterMismatchNmax 2, ‐‐alignIntronMax 1000000, ‐‐alignIntronMin 20, ‐‐chimSegmentMin 15, ‐‐chimJunctionOverhangMin 15, ‐‐outSAMtype BAM Unsorted, ‐‐outFilterType BySJout, and ‐‐outFilterMultimapNmax 1. To calculate the RNA abundance values, Salmon (v0.8.1) tool quant was used with options -l SR, ‐‐incompatPrior 0.0 to account for read strandedness. SAMtools (v1.3.1), BEDTools (v2.26), and R (v3.3.1) were used to interconvert files for downstream analyses. DESeq2 (v1.14.1) (Love et al. 2014) was used to determine which genes had differential expression. Venn diagrams were made using R package Vennerable (v3.0).
Bayesian generalized linear mixed effect model
A Bayesian generalized linear mixed effect model, implemented in R (v3.5.2) (R Core Team 2018) with the brms (v2.8.0) (Bürkner 2017) and rstan (v2.18.2) (https://cran.r-project.org/web/packages/rstan/index.html) packages as wrappers for the statistical software Stan (v2.18.1) (Carpenter et al. 2017), to account for features of the data: non-normality and the longitudinal and replicate observation study design. Posterior summaries from the models were used to make inferences and for further analysis. See Supplemental Materials for greater detail.
Data access
All raw and processed sequencing data generated in this study have been submitted to the NCBI Gene Expression Omnibus (GEO; https://www.ncbi.nlm.nih.gov/geo/) under accession number GSE153539. The processed data and R code necessary to reproduce the findings and figures presented here, as well as results summary tables, are provided (Supplemental Data S1–S9; Supplemental Code S1).
Competing interest statement
B.D.S. is a cofounder and scientific advisory board member of EpiCypher, Inc.
Supplementary Material
Acknowledgments
This work was supported by the National Institutes of Health (R01DA036877, R01CA198492, R35GM126900, R35GM131923, F31GM122321, and R35GM130312). We thank M. Keogh for providing the KLY78 strain, and S. Buratowski for providing the BUR1 shuffle strains.
Author contributions: conceptualization, A.M.L., A.J.H., B.D.S., B.K., and I.J.D; methodology, A.M.L., A.J.H., G.R.K., and H.Y.; software, A.J.H. and G.R.K.; formal analysis, A.J.H. and G.R.K.; investigation, A.M.L., H.A.M., H.Y., D.R., and S.Z.; resources, J.B.; data curation, A.J.H. and G.R.K.; writing—original draft, A.M.L., A.J.H., B.D.S., and I.J.D.; writing—review and editing, all authors; visualization, A.M.L., A.J.H., and G.R.K.; supervision, I.J.D., B.K., and B.D.S.; funding acquisition, A.M.L., H.Y., B.K., B.D.S., and I.J.D.
Footnotes
[Supplemental material is available for this article.]
Article published online before print. Article, supplemental material, and publication date are at http://www.genome.org/cgi/doi/10.1101/gr.264283.120.
References
- Bürkner PC. 2017. brms: an R package for Bayesian multilevel models using stan. J Stat Softw 80: 1–28. 10.18637/jss.v080.i01 [DOI] [Google Scholar]
- Carpenter B, Gelman A, Hoffman M, Lee D, Goodrich B, Betancourt M, Brubaker M, Guo J, Li P, Riddell A. 2017. Stan: a probabilistic programming language. J Stat Softw 76: 1–32. 10.18637/jss.v076.i01 [DOI] [PMC free article] [PubMed] [Google Scholar]
- Carrozza MJ, Li B, Florens L, Suganuma T, Swanson SK, Lee KK, Shia WJ, Anderson S, Yates J, Washburn MP, et al. 2005. Histone H3 methylation by Set2 directs deacetylation of coding regions by Rpd3S to suppress spurious intragenic transcription. Cell 123: 581–592. 10.1016/j.cell.2005.10.023 [DOI] [PubMed] [Google Scholar]
- Chang Y, Wu J, Tong XJ, Zhou JQ, Ding J. 2011. Crystal structure of the catalytic core of Saccharomyces cerevesiae histone demethylase Rph1: insights into the substrate specificity and catalytic mechanism. Biochem J 433: 295–302. 10.1042/BJ20101418 [DOI] [PubMed] [Google Scholar]
- Cheung V, Chua G, Batada NN, Landry CR, Michnick SW, Hughes TR, Winston F. 2008. Chromatin- and transcription-related factors repress transcription from within coding regions throughout the Saccharomyces cerevisiae genome. PLoS Biol 6: e277 10.1371/journal.pbio.0060277 [DOI] [PMC free article] [PubMed] [Google Scholar]
- Churchman LS, Weissman JS. 2011. Nascent transcript sequencing visualizes transcription at nucleotide resolution. Nature 469: 368–373. 10.1038/nature09652 [DOI] [PMC free article] [PubMed] [Google Scholar]
- DiFiore JV, Ptacek TS, Wang Y, Li B, Simon JM, Strahl BD. 2020. Unique and shared roles for histone H3K36 methylation states in transcription regulation functions. Cell Rep 31: 107751 10.1016/j.celrep.2020.107751 [DOI] [PMC free article] [PubMed] [Google Scholar]
- Di Ventura B, Kuhlman B. 2016. Go in! Go out! inducible control of nuclear localization. Curr Opin Chem Biol 34: 62–71. 10.1016/j.cbpa.2016.06.009 [DOI] [PMC free article] [PubMed] [Google Scholar]
- Dobin A, Davis CA, Schlesinger F, Drenkow J, Zaleski C, Jha S, Batut P, Chaisson M, Gingeras TR. 2013. STAR: ultrafast universal RNA-seq aligner. Bioinformatics 29: 15–21. 10.1093/bioinformatics/bts635 [DOI] [PMC free article] [PubMed] [Google Scholar]
- Dronamraju R, Strahl BD. 2014. A feed forward circuit comprising Spt6, Ctk1 and PAF regulates Pol II CTD phosphorylation and transcription elongation. Nucleic Acids Res 42: 870–881. 10.1093/nar/gkt1003 [DOI] [PMC free article] [PubMed] [Google Scholar]
- Fang J, Hogan GJ, Liang G, Lieb JD, Zhang Y. 2007. The Saccharomyces cerevisiae histone demethylase Jhd1 fine-tunes the distribution of H3K36me2. Mol Cell Biol 27: 5055–5065. 10.1128/MCB.00127-07 [DOI] [PMC free article] [PubMed] [Google Scholar]
- Gilbert TM, McDaniel SL, Byrum SD, Cades JA, Dancy BCR, Wade H, Tackett AJ, Strahl BD, Taverna SD. 2014. A PWWP domain-containing protein targets the NuA3 acetyltransferase complex via histone H3 lysine 36 trimethylation to coordinate transcriptional elongation at coding regions. Mol Cell Proteomics 13: 2883–2895. 10.1074/mcp.M114.038224 [DOI] [PMC free article] [PubMed] [Google Scholar]
- Govind CK, Qiu H, Ginsburg DS, Ruan C, Hofmeyer K, Hu C, Swaminathan V, Workman JL, Li B, Hinnebusch AG. 2010. Phosphorylated Pol II CTD recruits multiple HDACs, including Rpd3C(S), for methylation-dependent deacetylation of ORF nucleosomes. Mol Cell 39: 234–246. 10.1016/j.molcel.2010.07.003 [DOI] [PMC free article] [PubMed] [Google Scholar]
- Greer EL, Shi Y. 2012. Histone methylation: A dynamic mark in health, disease and inheritance. Nat Rev Genet 13: 343–357. 10.1038/nrg3173 [DOI] [PMC free article] [PubMed] [Google Scholar]
- Haruki H, Nishikawa J, Laemmli UK. 2008. The anchor-away technique: rapid, conditional establishment of yeast mutant phenotypes. Mol Cell 31: 925–932. 10.1016/j.molcel.2008.07.020 [DOI] [PubMed] [Google Scholar]
- Jang YK, Wang L, Sancar GB. 1999. RPH1 and GIS1 are damage-responsive repressors of PHR1. Mol Cell Biol 19: 7630–7638. 10.1128/MCB.19.11.7630 [DOI] [PMC free article] [PubMed] [Google Scholar]
- Jha DK, Strahl BD. 2014. An RNA polymerase II-coupled function for histone H3K36 methylation in checkpoint activation and DSB repair. Nat Commun 5: 3965 10.1038/ncomms4965 [DOI] [PMC free article] [PubMed] [Google Scholar]
- Joshi AA, Struhl K. 2005. Eaf3 chromodomain interaction with methylated H3-K36 links histone deacetylation to Pol II elongation. Mol Cell 20: 971–978. 10.1016/j.molcel.2005.11.021 [DOI] [PubMed] [Google Scholar]
- Kemmeren P, Sameith K, van de Pasch LA, Benschop JJ, Lenstra TL, Margaritis T, O'Duibhir E, Apweiler E, van Wageningen S, Ko CW, et al. 2014. Large-scale genetic perturbations reveal regulatory networks and an abundance of gene-specific repressors. Cell 157: 740–752. 10.1016/j.cell.2014.02.054 [DOI] [PubMed] [Google Scholar]
- Keogh MC, Podolny V, Buratowski S. 2003. Bur1 kinase is required for efficient transcription elongation by RNA polymerase II. Mol Cell Biol 23: 7005–7018. 10.1128/MCB.23.19.7005-7018.2003 [DOI] [PMC free article] [PubMed] [Google Scholar]
- Keogh MC, Kurdistani SK, Morris SA, Ahn SH, Podolny V, Collins SR, Schuldiner M, Chin K, Punna T, Thompson NJ, et al. 2005. Cotranscriptional Set2 methylation of histone H3 lysine 36 recruits a repressive Rpd3 complex. Cell 123: 593–605. 10.1016/j.cell.2005.10.025 [DOI] [PubMed] [Google Scholar]
- Kim T, Buratowski S. 2007. Two Saccharomyces cerevisiae JmjC domain proteins demethylate histone H3 Lys36 in transcribed regions to promote elongation. J Biol Chem 282: 20827–20835. 10.1074/jbc.M703034200 [DOI] [PubMed] [Google Scholar]
- Kim EM, Jang YK, Park SD. 2002. Phosphorylation of Rph1, a damage-responsive repressor of PHR1 in Saccharomyces cerevisiae, is dependent upon Rad53 kinase. Nucleic Acids Res 30: 643–648. 10.1093/nar/30.3.643 [DOI] [PMC free article] [PubMed] [Google Scholar]
- Kim JH, Lee BB, Oh YM, Zhu C, Steinmetz LM, Lee Y, Kim WK, Lee SB, Buratowski S, Kim TS. 2016. Modulation of mRNA and lncRNA expression dynamics by the Set2–Rpd3S pathway. Nat Commun 7: 13534 10.1038/ncomms13534 [DOI] [PMC free article] [PubMed] [Google Scholar]
- Kim CK, Adhikari A, Deisseroth K. 2017. Integration of optogenetics with complementary methodologies in systems neuroscience. Nat Rev Neurosci 18: 222–235. 10.1038/nrn.2017.15 [DOI] [PMC free article] [PubMed] [Google Scholar]
- Kizer KO, Phatnani HP, Shibata Y, Hall H, Greenleaf AL, Strahl BD. 2005. A novel domain in Set2 mediates RNA polymerase II interaction and couples histone H3 K36 methylation with transcript elongation. Mol Cell Biol 25: 3305–3316. 10.1128/MCB.25.8.3305-3316.2005 [DOI] [PMC free article] [PubMed] [Google Scholar]
- Klose RJ, Zhang Y. 2007. Regulation of histone methylation by demethylimination and demethylation. Nat Rev Mol Cell Biol 8: 307–318. 10.1038/nrm2143 [DOI] [PubMed] [Google Scholar]
- Klose RJ, Gardner KE, Liang G, Erdjument-Bromage H, Tempst P, Zhang Y. 2007. Demethylation of histone H3K36 and H3K9 by Rph1: a vestige of an H3K9 methylation system in Saccharomyces cerevisiae? Mol Cell Biol 27: 3951–3961. 10.1128/MCB.02180-06 [DOI] [PMC free article] [PubMed] [Google Scholar]
- Kosugi S, Hasebe M, Tomita M, Yanagawa H. 2009. Systematic identification of cell cycle-dependent yeast nucleocytoplasmic shuttling proteins by prediction of composite motifs. Proc Natl Acad Sci 106: 10171–10176. 10.1073/pnas.0900604106 [DOI] [PMC free article] [PubMed] [Google Scholar]
- Kouzarides T. 2007. Chromatin modifications and their function. Cell 128: 693–705. 10.1016/j.cell.2007.02.005 [DOI] [PubMed] [Google Scholar]
- Kwon DW, Ahn SH. 2011. Role of yeast JmjC-domain containing histone demethylases in actively transcribed regions. Biochem Biophys Res Commun 410: 614–619. 10.1016/j.bbrc.2011.06.039 [DOI] [PubMed] [Google Scholar]
- Li B, Howe L, Anderson S, Yates JR, Workman JL. 2003. The Set2 histone methyltransferase functions through the phosphorylated carboxyl-terminal domain of RNA polymerase II. J Biol Chem 278: 8897–8903. 10.1074/jbc.M212134200 [DOI] [PubMed] [Google Scholar]
- Li H, Handsaker B, Wysoker A, Fennell T, Ruan J, Homer N, Marth G, Abecasis G, Durbin R, 1000 Genome Project Data Processing Subgroup. 2009. The sequence alignment/Map format and SAMtools. Bioinformatics 25: 2078–2079. 10.1093/bioinformatics/btp352 [DOI] [PMC free article] [PubMed] [Google Scholar]
- Liang CY, Hsu PH, Chou DF, Pan CY, Wang LC, Huang WC, Tsai MD, Lo WS. 2011. The histone H3K36 demethylase Rph1/KDM4 regulates the expression of the photoreactivation gene PHR1. Nucleic Acids Res 39: 4151–4165. 10.1093/nar/gkr040 [DOI] [PMC free article] [PubMed] [Google Scholar]
- Liu Q, Tucker CL. 2017. Engineering genetically-encoded tools for optogenetic control of protein activity. Curr Opin Chem Biol 40: 17–23. 10.1016/j.cbpa.2017.05.001 [DOI] [PMC free article] [PubMed] [Google Scholar]
- Love MI, Huber W, Anders S. 2014. Moderated estimation of fold change and dispersion for RNA-seq data with DESeq2. Genome Biol 15: 550 10.1186/s13059-014-0550-8 [DOI] [PMC free article] [PubMed] [Google Scholar]
- Maltby VE, Martin BJE, Schulze JM, Johnson I, Hentrich T, Sharma A, Kobor MS, Howe L. 2012. Histone H3 lysine 36 methylation targets the Isw1b remodeling complex to chromatin. Mol Cell Biol 32: 3479–3485. 10.1128/MCB.00389-12 [DOI] [PMC free article] [PubMed] [Google Scholar]
- Martin M. 2011. Cutadapt removes adapter sequences from high-throughput sequencing reads. EMBnetjournal 17: 10–12. [Google Scholar]
- McDaniel SL, Strahl BD. 2017. Shaping the cellular landscape with Set2/SETD2 methylation. Cell Mol Life Sci 74: 3317–3334. 10.1007/s00018-017-2517-x [DOI] [PMC free article] [PubMed] [Google Scholar]
- McDaniel SL, Hepperla AJ, Huang J, Dronamraju R, Adams AT, Kulkarni VG, Davis IJ, Strahl BD. 2017. H3k36 methylation regulates nutrient stress response in Saccharomyces cerevisiae by enforcing transcriptional fidelity. Cell Rep 19: 2371–2382. [DOI] [PMC free article] [PubMed] [Google Scholar]
- Neil H, Malabat C, Aubenton-Carafa Y, Xu Z, Steinmetz LM, Jacquier A. 2009. Widespread bidirectional promoters are the major source of cryptic transcripts in yeast. Nature 457: 1038–1042. 10.1038/nature07747 [DOI] [PubMed] [Google Scholar]
- Nelson DA. 1982. Histone acetylation in baker's yeast. Maintenance of the hyperacetylated configuration in log phase protoplasts. J Biol Chem 257: 1565–1568. [PubMed] [Google Scholar]
- Niopek D, Benzinger D, Roensch J, Draebing T, Wehler P, Eils R, Di Ventura B. 2014. Engineering light-inducible nuclear localization signals for precise spatiotemporal control of protein dynamics in living cells. Nat Commun 5: 4404 10.1038/ncomms5404 [DOI] [PMC free article] [PubMed] [Google Scholar]
- Niopek D, Wehler P, Roensch J, Eils R, Ventura BD. 2016. Optogenetic control of nuclear protein export. Nat Commun 7: 10624 10.1038/ncomms10624 [DOI] [PMC free article] [PubMed] [Google Scholar]
- Pokholok DK, Harbison CT, Levine S, Cole M, Hannett NM, Lee TI, Bell GW, Walker K, Rolfe PA, Herbolsheimer E, et al. 2005. Genome-wide map of nucleosome acetylation and methylation in yeast. Cell 122: 517–527. 10.1016/j.cell.2005.06.026 [DOI] [PubMed] [Google Scholar]
- Quinlan AR, Hall IM. 2010. BEDTools: a flexible suite of utilities for comparing genomic features. Bioinformatics 26: 841–842. 10.1093/bioinformatics/btq033 [DOI] [PMC free article] [PubMed] [Google Scholar]
- Ramírez F, Ryan DP, Grüning B, Bhardwaj V, Kilpert F, Richter AS, Heyne S, Dündar F, Manke T. 2016. Deeptools2: A next generation web server for deep-sequencing data analysis. Nucleic Acids Res 44: W160–W165. 10.1093/nar/gkw257 [DOI] [PMC free article] [PubMed] [Google Scholar]
- R Core Team. 2018. R: a language and environment for statistical computing. R Foundation for Statistical Computing, Vienna: http://www.R-project.org/. [Google Scholar]
- Rufiange A, Jacques PE, Bhat W, Robert F, Nourani A. 2007. Genome-wide replication-independent histone H3 exchange occurs predominantly at promoters and implicates H3 K56 acetylation and Asf1. Mol Cell 27: 393–405. 10.1016/j.molcel.2007.07.011 [DOI] [PubMed] [Google Scholar]
- Sein H, Värv S, Kristjuhan A. 2015. Distribution and maintenance of histone H3 lysine 36 trimethylation in transcribed locus. PLoS One 10: e0120200 10.1371/journal.pone.0120200. [DOI] [PMC free article] [PubMed] [Google Scholar]
- Sen P, Dang W, Donahue G, Dai J, Dorsey J, Cao X, Liu W, Cao K, Perry R, Lee JY, et al. 2015. H3k36 methylation promotes longevity by enhancing transcriptional fidelity. Genes Dev 29: 1362–1376. 10.1101/gad.263707.115 [DOI] [PMC free article] [PubMed] [Google Scholar]
- Silva AC, Xu X, Kim HS, Fillingham J, Kislinger T, Mennella TA, Keogh MC. 2012. The replication-independent histone H3-H4 chaperones HIR, ASF1, and RTT106 co-operate to maintain promoter fidelity. Journal of Biological Chemistry 287: 1709–1718. 10.1074/jbc.M111.316489 [DOI] [PMC free article] [PubMed] [Google Scholar]
- Smolle M, Venkatesh S, Gogol MM, Li H, Zhang Y, Florens L, Washburn MP, Workman JL. 2012. Chromatin remodelers Isw1 and Chd1 maintain chromatin structure during transcription by preventing histone exchange. Nat Struct Mol Biol 19: 884–892. 10.1038/nsmb.2312 [DOI] [PMC free article] [PubMed] [Google Scholar]
- Strahl BD, Allis CD. 2000. The language of covalent histone modifications. Nature 403: 41–45. 10.1038/47412 [DOI] [PubMed] [Google Scholar]
- Strahl BD, Grant PA, Briggs SD, Bone JR, Caldwell JA, Mollah S, Cook RG, Shabanowitz J, Hunt DF, Allis CD, et al. 2002. Set2 is a nucleosomal histone H3-selective methyltransferase that mediates transcriptional repression. Mol Cell Biol 22: 1298–1306. 10.1128/MCB.22.5.1298-1306.2002 [DOI] [PMC free article] [PubMed] [Google Scholar]
- Tsukada YI, Fang J, Erdjument-Bromage H, Warren ME, Borchers CH, Tempst P, Zhang Y. 2006. Histone demethylation by a family of JmjC domain-containing proteins. Nature 439: 811–816. 10.1038/nature04433 [DOI] [PubMed] [Google Scholar]
- Tu S, Bulloch EMM, Yang L, Ren C, Huang WC, Hsu PH, Chen CH, Liao CL, Yu -M, Lo WS, et al. 2007. Identification of histone demethylases in Saccharomyces cerevisiae. J Biol Chem 282: 14262–14271. 10.1074/jbc.M609900200 [DOI] [PMC free article] [PubMed] [Google Scholar]
- Venkatesh S, Workman JL. 2015. Histone exchange, chromatin structure and the regulation of transcription. Nat Rev Mol Cell Biol 16: 178–189. 10.1038/nrm3941 [DOI] [PubMed] [Google Scholar]
- Venkatesh S, Smolle M, Li H, Gogol MM, Saint M, Kumar S, Natarajan K, Workman JL. 2012. Set2 methylation of histone H3 lysine 36 suppresses histone exchange on transcribed genes. Nature 489: 452–455. 10.1038/nature11326 [DOI] [PubMed] [Google Scholar]
- Wagner EJ, Carpenter PB. 2012. Understanding the language of Lys36 methylation at histone H3. Nat Rev Mol Cell Biol 13: 115–126. 10.1038/nrm3274 [DOI] [PMC free article] [PubMed] [Google Scholar]
- Waterborg JH. 2001. Dynamics of histone acetylation in Saccharomyces cerevisiae. Biochemistry 40: 2599–2605. 10.1021/bi002480c [DOI] [PubMed] [Google Scholar]
- Xiao T, Hall H, Kizer KO, Shibata Y, Hall MC, Borchers CH, Strahl BD. 2003. Phosphorylation of RNA polymerase II CTD regulates H3 methylation in yeast. Genes Dev 17: 654–663. 10.1101/gad.1055503 [DOI] [PMC free article] [PubMed] [Google Scholar]
- Ye C, Sutter BM, Wang Y, Kuang Z, Tu BP. 2017. A metabolic function for phospholipid and histone methylation. Mol Cell 66: 180–193.e8. 10.1016/j.molcel.2017.02.026 [DOI] [PMC free article] [PubMed] [Google Scholar]
- Yumerefendi H, Dickinson DJ, Wang H, Zimmerman SP, Bear JE, Goldstein B, Hahn K, Kuhlman B. 2015. Control of protein activity and cell fate specification via light-mediated nuclear translocation. PLoS One 10: e0128443 10.1371/journal.pone.0128443 [DOI] [PMC free article] [PubMed] [Google Scholar]
- Yumerefendi H, Lerner AM, Zimmerman SP, Hahn KM, Bear JE, Strahl BD, Kuhlman B. 2016. Light-induced nuclear export reveals rapid dynamics of epigenetic modifications. Nat Chem Biol 12: 399–401. 10.1038/nchembio.2068 [DOI] [PMC free article] [PubMed] [Google Scholar]
Associated Data
This section collects any data citations, data availability statements, or supplementary materials included in this article.