

Abstract
Sex differences in adipose tissue distribution and function are associated with sex differences in cardiometabolic disease. While many studies have revealed sex differences in adipocyte cell signaling and physiology, there is a relative dearth of information regarding sex differences in transcript abundance and regulation. We investigated sex differences in subcutaneous adipose tissue transcriptional regulation using omic-scale data from ∼3000 geographically and ethnically diverse human samples. We identified 162 genes with robust sex differences in expression. Differentially expressed genes were implicated in oxidative phosphorylation and adipogenesis. We further determined that sex differences in gene expression levels could be related to sex differences in the genetics of gene expression regulation. Our analyses revealed sex-specific genetic associations, and this finding was replicated in a study of 98 inbred mouse strains. The genes under genetic regulation in human and mouse were enriched for oxidative phosphorylation and adipogenesis. Enrichment analysis showed that the associated genetic loci resided within binding motifs for adipogenic transcription factors (e.g., PPARG and EGR1). We demonstrated that sex differences in gene expression could be influenced by sex differences in genetic regulation for six genes (e.g., FADS1 and MAP1B). These genes exhibited dynamic expression patterns during adipogenesis and robust expression in mature human adipocytes. Our results support a role for adipogenesis-related genes in subcutaneous adipose tissue sex differences in the genetic and environmental regulation of gene expression.
Sex differences have been implicated in the etiology, symptomatology, prognosis, prevalence, and genetics of common diseases (Ober et al. 2008; Gilks et al. 2014; Winham et al. 2015; Khramtsova et al. 2019). For instance, sex differences have been observed in obesity and type 2 diabetes (Kautzky-Willer et al. 2016; Zore et al. 2018). Adipose tissues are known contributors to metabolic dysregulation, and sex differences in adipose tissue distribution and function have been associated with cardiometabolic diseases (Karastergiou et al. 2012; Lumish et al. 2020). Data indicate that gene expression in adipose tissue influences adipose distribution patterns (Shungin et al. 2015), and adipose tissue distribution patterns influence type 2 diabetes and cardiovascular disease risk (Emdin et al. 2017). However, the molecular mechanisms underlying sex-specific regulation of adipose tissue function and cardiometabolic disease are poorly understood. Improving our understanding of sex-specific disease mechanisms could facilitate clinical efforts in precision medicine (Humphries et al. 2017; Segarra et al. 2017; Reusch et al. 2018).
A wealth of data have described sex differences in adipose tissue distribution, physiology, and cell signaling. However, relatively little is known about how sex differences in transcript abundance and regulation contribute to sex differences in adipose metabolism (Fried et al. 2015). While several relevant gene expression analyses have been undertaken, sample sizes have typically been small (Linder et al. 2004). Large-scale studies have been conducted (hundreds of samples), though the degree to which the results are replicable across diverse human cohorts is unclear (Emilsson et al. 2008; Sharma et al. 2016; GTEx Consortium 2017). Complementary to sex differences in adipose tissue function, sex differences in the genetic underpinnings of adipose tissue distribution and cardiometabolic disease risk have been demonstrated (Pulit et al. 2017). Females have higher heritability for adipose tissue distribution. Correspondingly, sex-stratified genome-wide association studies (GWASs) have shown that females have more single nucleotide polymorphism (SNP) associations with adipose tissue distribution, as compared to males (Pulit et al. 2017). Bioinformatic analyses support a role for adipocyte and adipose tissue gene expression in coordinating sex differences in adipose tissue distribution (Shungin et al. 2015). However, it has not been addressed whether there are sex differences in the genetic underpinnings of gene expression in human adipose tissue, as has been shown in mouse (Hasin-Brumshtein et al. 2014).
In this study, we addressed two central themes. The first aim was to evaluate the consistency in subcutaneous adipose tissue gene expression sex differences observed across large-scale studies from geographically and ethnically diverse human cohorts. The second aim was to test whether there are sex differences in the genetic architecture of gene expression in human subcutaneous adipose tissue. We specifically addressed mechanistic underpinnings of our findings throughout our analyses (Fig. 1A).
Figure 1.

Robust sex differences in human adipose tissue gene expression. (A) The general study design involved analyses of sex-dependent gene expression patterns and sex-dependent genetic regulation of gene expression. (B) Fold changes are shown for 162 genes that were significantly differentially expressed across three data sets (73% of the genes showed elevated expression in females). (C) We found that 162 genes were differentially expressed in a directionally consistent manner across three data sets. Of the 162 differentially expressed genes (DEGs), 57% were also differentially expressed in subcutaneous adipose tissues from obese individuals; 15% of the DEGs were differentially expressed in visceral adipose tissue; 43% of the DEGs were differentially expressed in at least one metabolically active tissue (including visceral adipose, liver, skeletal muscle, left ventricle, cardiac atrium, blood, and 13 brain tissues). Of 122 identified murine orthologs, 28% showed differential expression consistent with the DEGs. For all comparisons, differential expression was defined for |fold change| > 5%, FDR < 0.05, and effect direction was required to be consistent across studies.
Results
Robust sex differences in adipose tissue gene expression
A number of publicly available genome-wide gene expression data sets have been derived from adult human adipose tissue samples. However, an analysis documenting the consistent sex differences across studies has not been reported. To investigate whether robust sex differences exist in subcutaneous adipose tissue gene expression across geographically and ethnically diverse human populations, we evaluated expression differences using data from three large human cohorts. We considered the African American Genetics of Metabolism and Expression cohort (AAGMEx) (Sharma et al. 2016), the Icelandic deCODE Genetics cohort (Emilsson et al. 2008), and the multi-ethnic Genotype-Tissue Expression cohort (GTEx) (Table 1; GTEx Consortium 2017). We identified sex differences in gene expression for each cohort (|fold change| > 5%, false discovery rate [FDR] < 0.05) (Fig. 1B; Supplemental Fig. S1C). Our analysis revealed 162 differentially expressed genes (DEGs) with directionally consistent sex differences in gene expression across cohorts (P < 1.0 × 10⁻¹⁶, multiset intersection exact test) (Fig. 1B,C). In each data set, the 162 genes with sex-biased expression exhibited elevated expression variance explained by sex in univariate linear models, by comparison to all genes analyzed (P < 1.0 × 10⁻¹⁶, permutation test) (Supplemental Fig. S1D). In a recent study of the Stockholm-Tartu Atherosclerosis Reverse Network Engineering Task (STARNET) cohort of healthy individuals from Estonia, subcutaneous adipose tissue biopsies were obtained from subjects and gene expression assays were performed (Table 1; Franzén et al. 2016). We used the STARNET data as a test set to evaluate the predictions of our differential gene expression analysis. We found that 85.8% of the 162 DEGs showed consistent patterns of differential expression in the STARNET data set at an FDR threshold of 0.05 (where the FDR correction was considered with respect to the 162 genes tested). These results are consistent with the robustness of the sex-biased gene set identified through our analyses.
Table 1.
Cohort sample characteristics: sample sizes, data attributes, and acquisition information

We next investigated the degree to which the observed sex differences in gene expression were context-dependent. We evaluated the 162 DEGs in multiple contexts and examined the overlap of the genes identified with consistent fold change directionalities (Fig. 1C; lower comparison Venn diagram circles are of size ≤162 except for the analysis of murine orthologs) (see below). To determine whether the DEGs exhibited an association with sex under a metabolic disease state, we evaluated differential expression in subcutaneous adipose tissues from obese individuals (Greenawalt et al. 2011). We found that 57% of the 162 DEGs were differentially expressed in obese adipose tissue (P < 1.0 × 10⁻¹⁶, hypergeometric test) (Fig. 1C). This high degree of overlap is consistent with the impact of sex on DEGs in various metabolic states. To further investigate the context-specificity of the DEGs, we evaluated differential expression in a set of metabolic tissues including visceral adipose, liver, skeletal muscle, left ventricle, atrium, blood, and 13 brain tissues. While only 15% of the subcutaneous adipose tissue DEGs were differentially expressed in visceral adipose tissue (P < 1.0 × 10⁻¹⁶, hypergeometric test), 43% of the DEGs were differentially expressed in at least one other metabolically active tissue (P < 1.0 × 10⁻¹⁶, hypergeometric test) (Fig. 1C). This high degree of overlap is consistent with the absence of tissue-specificity for the DEGs. Furthermore, subcutaneous adipose tissue is among the highest sampled tissue from GTEx (GTEx Consortium 2017), and it is therefore likely that we have underestimated the degree to which DEGs are observed in multiple tissues due to power limitations. See Supplemental Table S1 for summary data. These results suggest that many differentially expressed genes may have context-independent functions, while a subset of these genes are health state–specific.
To evaluate the degree of conservation for sex-biased gene expression, we compared our results to a complementary analysis of epididymal adipose tissue from 98 strains of inbred mice. We identified murine orthologs for 122 of the 162 DEGs. We found that 28% of the orthologs showed directionally consistent sex differences in expression (P < 1.0 × 10⁻¹⁶, hypergeometric test) (Fig. 1C; Supplemental Table S2). These analyses highlight a set of genes for which a wealth of data are consistent with a conserved sex difference in adipose tissue-specific function in a healthy metabolic state.
Sex differences in adipose tissue gene expression are associated with oxidative phosphorylation and adipogenesis
We investigated the potential biological functions associated with the 162 sex-biased genes. We first implemented gene set enrichment analysis (GSEA) to determine whether genes with greater degrees of sex differences were enriched for functional annotations (Subramanian et al. 2005). We performed GSEA for each of the three cohort data sets separately. In addition to evaluating enrichments with respect to the hallmark gene set collection (Liberzon et al. 2015), we included other annotations in our analysis. In particular, we considered trans-eQTL genes associated with the KLF14 locus (Civelek et al. 2017; Small et al. 2018). The KLF14 transcript is a cis-eQTL at this locus and is implicated in sex-specific adipocyte functions involved in cardiometabolic disease (Small et al. 2018). We found one functional annotation significantly associated with differential expression for the African American cohort (FDR < 0.1): pancreatic beta cells. This is presumably because many genes associated with metabolism are expressed in both pancreatic and adipose tissues. For the multi-ethnic American and Icelandic cohorts, we observed six positively enriched annotations, consistent with enrichment in genes with elevated expression in females (FDR < 0.1): adipogenesis, oxidative phosphorylation, fatty acid metabolism, transcription factor KLF14 targets, xenobiotic metabolism, and peroxisome function (Fig. 2A,B). We observed positive fold change correlations for all annotations, with correlations between the African American and Icelandic cohorts comparable to the correlations between the Icelandic and multi-ethnic American cohorts, suggesting that the absence of fatty acid metabolism and KLF14 target positive enrichments for the African American cohort could be due to a power limitation (Fig. 2C; see also Supplemental Fig. S7; Supplemental Results). Collectively, these findings are consistent with enrichments for adipogenesis and metabolic function in the adipose tissue DEGs.
Figure 2.

Sex-biased genes are implicated in oxidative phosphorylation and adipogenesis. (A) Gene set enrichment analysis (GSEA) enrichment scores are plotted as a function of the ranked degree of differential expression. Tick marks indicate genes from a specific functional annotation (e.g., oxidative phosphorylation). An elevated density of tick marks to the left suggests that genes with elevated expression in females are enriched for the functional annotation. (B) Normalized peak enrichment scores are shown for annotations with FDR < 0.1 for the multi-ethnic and Icelandic cohorts. (C) Positive fold change correlations across cohorts suggest that the enrichments are directionally consistent across cohorts. (D) Functional enrichment results based on Fisher's exact test (FET) are shown for 162 differentially expressed genes (FET P < 0.001). The point size indicates the number of genes in the functional annotation and the intensity indicates the negative log of the P-value. (E) We implemented the Binding Analysis for Regulation of Transcription (BART) for genes that were elevated in females (left) or elevated in males (right). The plots show the top 10 factors for each sex, ranked according to the Wilcoxon rank-sum test FDR (< 0.05). The point size indicates the maximal area under the receiver operator characteristic curve, a measure of the corresponding factor's putative regulatory influence on the gene set, and the intensity indicates the negative log of the FDR.
Next, we utilized alternative approaches to interrogate the biological functions associated with the 162 sex-biased genes. Using Fisher's exact test (Kuleshov et al. 2016), we observed functional enrichments associated with fatty acid and lipid metabolism (P < 0.001), consistent with the GSEA results (Fig. 2D; Supplemental Table S3). To identify transcription factors potentially associated with the DEGs, we implemented the data-driven Binding Analysis for Regulation of Transcription (BART) (Wang et al. 2018). In order to identify putative sex-specific transcription factors (TFs), we performed this analysis separately for genes up-regulated in females and for genes up-regulated in males. We identified 45 female-associated TFs and 42 male-associated TFs (FDR < 0.05) (Supplemental Table S4). Figure 2E shows the top 10 putative female- and male-associated TFs. This analysis identifies sets of transcription factors that are putative regulators of either genes up-regulated in females (Fig. 2E, left) or genes up-regulated in males (Fig. 2E, right). Consistent with the GSEA results, we observed that prominent adipogenic TFs CEBPB and PPARG were associated with genes that showed elevated expression in females. We found that differentially expressed genes with elevated expression in males were associated with sex-hormone receptors including the androgen and estrogen receptors (AR and ESR1). Note that ESR1 was also associated with genes elevated in females (Supplemental Table S4). Overall, the functional enrichment analyses are consistent with adipose tissue sex-differences associated with oxidative phosphorylation and adipogenesis.
Sex-dependent genetic regulation of adipose tissue gene expression
Available data support the hypothesis that sex-differences in the genetic architecture of adipose tissue gene expression influence sex differences in the genetic architecture of cardiometabolic traits such as the waist-to-hip ratio (Shungin et al. 2015). However, sex differences in the genetic architecture of subcutaneous adipose tissue gene expression have not previously been studied in humans. To examine whether such sex differences exist, we implemented linear models with sex-by-SNP interactions for associations between SNP genotypes and the expression of genes within 1Mb. We applied this analysis to the multi-ethnic American GTEx subcutaneous adipose tissue data set. We identified 2408 interaction eQTLs (P < 1 × 10⁻⁴) (Fig. 3A). We observed a low degree of replication for our observed associations in other large adipose tissue cohorts (≤4.2%) (see Supplemental Results; Supplemental Table S5).
Figure 3.

Identification, classification, and genomic annotation of sex-specific eQTLs. (A) Our analysis revealed 2408 sex-specific eQTLs (P < 1 × 10⁻⁴). We classified the sex-specific eQTLs into the following groups: sex-specific effect, sex-specific direction, and sex-specific magnitude. (B) Here we show distributions of heritability and eQTL effect size, with data for females and males colored in red and blue, respectively (the horizontal axes indicate counts for females on the left half and males on the right half). We found that heritability was elevated for females (P < 2.2 × 10⁻¹⁶, Mann–Whitney U test) and that the sex-specific eQTL effect sizes (i.e., regression coefficients) were also elevated for females (P < 2.2 × 10⁻¹⁶, Mann–Whitney U test). (C) Quantification of the sex-specific eQTL groups yielded the following relative contributions: 33% sex-specific effect, 66% sex-specific magnitude, and 1% sex-specific direction eQTLs. (D) We used ChromHMM data to document the genomic context of the sex-specific eQTLs in pre-adipocytes and adipocytes. Approximately 30% of the eQTL SNPs were within transcription start sites, enhancers, or transcribed regions.
Based on data showing that females exhibit a higher degree of heritability for cardiometabolic traits (Pulit et al. 2017), we evaluated the SNP-based narrow-sense heritability of gene expression in a sex-stratified analysis. We found that, on average with respect to expressed transcripts, female gene expression exhibited greater heritability (mean h2 = 0.12 for females and h2 = 0.08 for males, P < 2.2 × 10⁻¹⁶, Mann–Whitney U test) (Fig. 3B). We further observed that eQTL effect sizes for females were larger than those for males (P < 2.2 × 10⁻¹⁶, Mann–Whitney U test with effect size absolute values) (Fig. 3B). Collectively, these results suggest that there are distinct genetic underpinnings of gene expression in females and males. Our findings also suggest that there is a greater degree of genetic control over adipose tissue gene regulation in females as compared to males.
To determine whether the sex-specific eQTLs are associated with human disease and complex trait variants, we overlapped the sex-specific eQTL SNPs with those from human GWASs. We did not find evidence of colocalization with waist-to-hip ratio loci or related cardiometabolic traits (Supplemental Results). We next overlapped the sex-specific eQTL SNPs with disease- or trait-associated SNPs identified through human GWAS analyses (Buniello et al. 2019) based on linkage. When accounting for linkage disequilibrium (LD r2 > 0.8), we found that 95 sex-specific eQTL associations corresponded to 138 GWAS traits (Supplemental Tables S6, S7), including relevant cardiometabolic traits such as LDL cholesterol, waist-to-hip ratio, and blood pressure. However, further investigation would be needed to establish whether the sex-specific eQTLs are causally related to the GWAS associations at the same loci. We identified 38/138 (26%) of the GWAS traits that could be classified as cardiometabolic traits (Supplemental Table S7). Other trait classifications included blood, immune function, bone-related, pulmonary, cancer-related, cognitive/behavioral, and sex-related (Supplemental Table S7). Such widespread associations could be spurious results. Such results could also arise due to genetic pleitropy and/or due to the pervasive impact of adipose tissue on systemic physiology and organismal function (Luchsinger et al. 2013; Exley et al. 2014; Declèves and Sharma 2015; Lengyel et al. 2018). These findings suggest that variants with sex-specific influences on adipose tissue gene expression are also associated with complex human phenotypes and diseases. In general, these results are consistent with the possibility that sex differences in the genetic architecture of adipose tissue gene expression could contribute to sex differences in common human diseases.
Mechanisms of sex differences in genetic regulation
Expression QTLs with sex-by-SNP interactions have been classified into the following categories: sex-specific effect, sex-specific direction, and sex-specific magnitude (Yao et al. 2014; Khramtsova et al. 2019). We separated the eQTLs into these categories by fitting independent linear models for each sex and assessing the degree of overlap for the confidence intervals of the effect sizes (Fig. 3A). All 2408 associations could be unambiguously assigned to one of the three categories: 33% of the eQTLs showed sex-specific effects; 66% showed sex-specific directions; and 1% showed sex-specific magnitudes (Fig. 3C). These results suggest that there are a number of sites in the genome that influence gene expression in a sex-specific manner, and there are even more sex-specific direction than sex-specific effect sites.
We sought to identify a mechanistic basis of sex-specific eQTLs. We evaluated whether sex-specific eQTLs overlapped with chromatin contacts inferred from pre-adipocyte promoter-capture Hi-C data and obtained generally negative results (Supplemental Results). Next, we investigated whether the sex-specific eQTL SNPs resided within regulatory regions that were identified in human pre-adipocytes and adipocytes based on hidden Markov models generated from histone modification data (Roadmap Epigenomics Consortium et al. 2015). For both pre-adipocytes and mature adipocytes, of the eQTL SNPs were within regions defined as transcription start sites, enhancers, or transcribed regions. In contrast, of the eQTL SNPs were within repressed or quiescent regions of chromatin (Fig. 3D). However, we note that the mappings between particular histone modifications and chromatin regulation states, such as the association between histone H3 lysine 4 monomethylation and enhancer activity, have been disputed (Henriques et al. 2018). Furthermore, there are reported discrepancies between patterns of histone modifications in vitro and in vivo, and experimental perturbations of histone modifiers have elicited unpredictable effects (Rando 2012).
It has been demonstrated that noncoding variants influence gene expression by modulating transcription factor binding (Gaffney et al. 2012). We tested whether sex-specific eQTL SNPs, as well as SNPs in high LD (r2 > 0.8), were coincident with transcription factor binding sites (TFBSs) (Kumar et al. 2017). Out of 2408 associations, we identified 881 loci (37%) with overlapping TFBSs for either the lead SNP or at least one LD variant. Consistent with the relevance of adipogenesis to sex differences in gene regulation, we identified 36 loci overlapping PPARG motifs and 16 loci overlapping motifs for CEBPA or CEBPB. We found that the FADS1 locus overlapped a ZFX motif, the MAP1B locus overlapped a PPARG-RXRA dimer motif, and the PDZD2 locus overlapped a HAND1-TCF3 motif.
To determine the functions associated with the TFs with binding motifs overlapping sex-specific eQTLs, we applied an enrichment analysis to the set of TFs overlapping both lead and LD SNPs. We applied Fisher's exact test to evaluate the functional enrichments for a set of 160 TF genes. Our analysis revealed 113 annotated functional categories with a considerable degree of overlap (Fig. 4A; Supplemental Table S8). We found that adipogenesis was associated with the highest odds ratio for enrichment (OR = 66.4, FDR <1.0 × 10⁻¹⁶). Out of the 160 TFs in this analysis, 17 (10.6%) were associated with adipogenesis (e.g., PPARG, CEBPA/B, STAT5A/B, KLF5, EGR2, SREBF1, and NR3C1) (see Fig. 4H). Other enriched functional annotations of interest included immune-related signaling, circadian rhythm-related genes, fatty acid, triacylglycerol, and ketone body metabolism, and the AGE-RAGE signaling pathway in diabetic complications (Supplemental Table S8). These findings are consistent with the contributions of adipose tissues to inflammation and metabolism (Exley et al. 2014; Grundy 2015), along with the overlaps with the GWAS associations documented above. These results suggest that sex-specific genetic influences on adipose tissue gene expression are associated with adipocyte differentiation pathways.
Figure 4.

Adipogenic transcription factors are implicated in the regulation of sex-specific eQTLs. (A) We applied Fisher's exact test to evaluate the functions associated with transcription factors overlapping SNPs in sex-specific eQTLs. Adipogenesis was the functional annotation with the largest odds ratio, suggesting that factors regulating sex-specific eQTL genes are implicated in adipogenesis. Point sizes correspond to the number of genes in each annotation (> 10) and intensity corresponds to the FET false discovery rate (FDR < 0.001). (B–E) An illustrative case in which sex differences in the expression of a transcription factor that binds to a sex-specific eQTL SNP can explain the sex-specificity of the eQTL. (B) Data-driven model indicating that male-specific binding of the anti-adipogenic transcription factor EGR1 to the GG allele of an eQTL SNP augments the expression of the associated eQTL gene FLT3. (C) The EGR1 consensus motif corresponds to the reference allele G but not the alternate allele C at rs61944702 (see box). (D) FLT3 expression is associated with the genotype at rs61944702 in males, such that the homozygous reference genotype (GG) is associated with elevated expression as well as enhanced predicted binding of EGR1. (E) Elevated EGR1 expression in males (FDR = 0.02) is consistent with the sex-specificity of the eQTL observed for the rs61944702 SNP located within an EGR1 binding motif. (F) For an eQTL relating the genotype at rs28372757 with the expression of BRD4, the SNP at rs28372757 resides within a binding motif for the PPARG-RXRA dimer. Further, the SNP at rs28372757 resides within an open chromatin region in human pre-adipocytes, adipocytes and subcutaneous adipose tissue. The G allele is associated with enhanced predicted binding of the PPARG-RXRA dimer based on sequence conformity to the consensus motif. (G) The G allele is associated with elevated BRD4 expression in females and reduced BRD4 expression in males. (H) Examples of adipogenesis genes enriched in transcription factors (TFs) with binding motifs overlapping sex-specific eQTL SNPs or eSNPs. Also shown are adipogenesis genes enriched in sex-specific eQTL genes or eGenes that overlap with sex-by-genotype interaction genes identified in mouse.
To further interrogate the molecular mechanisms associated with sex-specific allelic influences on gene expression, we integrated TF expression data with TF motif data and sex-specific eQTL data (Supplemental Fig. S8). We tested a hypothesis to address the molecular mechanisms of sex-specific effect eQTLs (Supplemental Fig. S8B). We found nine and seven loci for which we could explain female- and male-specific eQTLs, respectively, based on differential expression of a TF with a binding motif overlapping the sex-specific eQTL SNP. For these loci, the sex with the observed eQTL showed significantly elevated expression for the TF associated with a predicted TFBS alteration by the corresponding SNP genotype (Supplemental Fig. S8B). For instance, the expression of FLT3 in males was associated with a locus that overlapped an EGR1 motif (Fig. 4B–D). EGR1 showed elevated expression in males (FDR = 0.02, where the FDR was taken with respect to genes for TFs with motifs overlapping eQTL SNPs) (Fig. 4E). We note that sex-specific eQTLs with sex-specific directionalities could be explained by cases in which multiple sex-specific TFs bind to a given SNP (Supplemental Fig. S8C). However, such analyses were outside of the scope of the current study. Nevertheless, we identified 310 loci with both sex-specific directional effects on gene expression and overlap with putative binding sites for multiple TFs. Sex-specific TF binding at these sites could be implicated in the sex-specific allelic effects.
Because gene expression regulation and TF binding are associated with regions of open chromatin, we tested whether sex-specific eQTL SNPs, and associated LD variants (r2 > 0.8), reside within regions of enzyme accessible chromatin from human pre-adipocytes, adipocytes, and adipose tissue samples. We assessed Assay for Transposase-Accessible Chromatin using sequencing (ATAC-seq) data. We considered ATAC-seq data from pre-adipocytes and adipocytes of the Simpson Golabi Behmel Syndrome (SGBS) cell line (Cannon et al. 2019). To assess adipose tissue chromatin regulation, we considered ATAC-seq data from the Metabolic Syndrome in Men (METSIM) cohort (Cannon et al. 2019) and the Encyclopedia of DNA Elements (ENCODE) consortium (The ENCODE Project Consortium 2012). We analyzed open chromatin peaks that denote the genomic coordinates of putative regulatory regions with bound TFs and/or histone modifications associated with gene expression regulation. We documented four sets of peaks: (1) pre-adipocyte peaks; (2) adipocyte peaks; (3) the union of pre-adipocyte, adipocyte, and adipose tissue peaks; and (4) the intersection of pre-adipocyte, adipocyte, and adipose tissue peaks. Out of 2408 sex-specific eQTLs, 4% were in the intersection of all peak classes, 15% were in pre-adipocyte peaks, 21% were in adipocyte peaks, and 23% were in the union or all peak classes (similar results were obtained for the overlaps of non-sex-specific eQTLs with ATAC peaks [see Supplemental Results]). The adipocyte peaks contained variants associated with FADS1 and MAP1B. We further evaluated whether sex-specific eQTL SNPs were enriched in TF binding motifs within open chromatin peaks and obtained negative results (Supplemental Results). However, we note that a number of functionally relevant adipogenic TF motifs overlapping sex-specific eQTL SNPs were identified within open chromatin peaks (e.g., Fig. 4F,G; Supplemental Table S9; Supplemental Results). Overall, our results are consistent with a functional influence of adipogenesis-related TF expression on the sex-specificity of allelic effects on gene expression and a general role of chromatin regulation in the sex-specific eQTLs for FADS1 and MAP1B.
Conservation of sex-by-genotype interactions implicated in oxidative phosphorylation and adipogenesis
We next addressed whether there are sex-by-genotype interactions underlying adipose tissue gene expression in mice. However, such an analysis is difficult given that available populations of genetically variable mice do not offer comparable statistical power for genome-wide association analyses as described above for humans. Furthermore, direct comparisons between murine- and human-associated loci are limited to loci in conserved regions. To address these limitations, we employed a recently developed method—the fold change correlation (FCC) method—to identify genes associated with sex-by-genotype interactions in a population of ˜100 inbred mouse strains known as the Hybrid Mouse Diversity Panel (HMDP) (Santolini et al. 2018). The HMDP mice have been characterized in terms of metabolic phenotypes (Supplemental Fig. S5) and gene expression in epididymal adipose tissue (Fig. 5). Through the FCC analysis, we could identify genes for which expression sex differences were associated with the phenotypic sex differences across strains. For instance, consider a gene for which strains with elevated sex differences in expression also show greater sex differences in phenotype. Such a gene is identified as a FCC gene. For FCC genes, the relation between the degree of phenotypic sex differences and the genotype indicates a sex-by-genotype interaction, while the relation between the sex-dependent expression and phenotype fold change supports the functional relevance of the gene's expression (Methods; Fig. 5A,C,E). We identified three prominent clusters of cardiometabolic phenotypes and selected the following representative metabolic phenotypes for the FCC analysis: the body fat percentage at the age of 8 wk, the percentage of body fat growth between 0 and 8 wk due to a high fat diet, and the Homeostatic Model Assessment of Insulin Resistance (HOMA-IR) metric (Supplemental Fig. S5).
Figure 5.

Fold change correlations reflect genotype-by-sex interactions in a population of inbred mouse strains. (A) Sex differences in body fat percentage vary substantially across 98 murine strains from the Hybrid Mouse Diversity Panel (fc = fold change). Fat percentage is elevated in approximately 50% of the strains, with apparent symmetry in the fold change directionality profile with respect to sex. (B) Distinct fold change correlation genes are observed for fat percentage, fat growth, and insulin resistance, therefore suggesting disparate genetic architectures. (C) Uty shows significant differential expression with respect to sex with elevation in males (negative fc) across strains (same strain organization as in A). (D) Due to the robust differential expression of Uty, and the variable sex-dependence of fat % across strains, the correspondence between sex and Uty expression is not associated with the correspondence between sex and fat percentage. (E) Xbp1 shows variable sex differences across strains without apparent differential expression (same strain organization as in A). (F) The strain-dependent Xbp1 fold changes are negatively associated with the fat percentage fold changes across strains. Therefore, the putative influence of sex on Xbp1 is associated with the putative influence of sex on fat percentage. (G) Overlapping the differentially expressed genes (|fc| >5%, FDR < 0.05) and fold change correlation genes (|midweight bicorrelation| > 0.2, FDR < 0.05) shows that fold change correlations identify distinct sets of genes for which sex differences in expression are consistent with sex differences in metabolic phenotypes.
Our analyses revealed 3602, 894, and 1081 FCC genes associated with fat percentage, fat growth, and insulin resistance, respectively (|r| > 0.2, FDR < 0.05) (Fig. 5B; Supplemental Table S10). Only eight genes were identified for all three metabolic traits, consistent with differences in the genetic architectures underlying these traits in mice (P = 1.0, multiset intersection exact test). To illustrate the functional significance of FCC genes, we contrasted the FCCs with instances of differential expression. For example, fat percentage shows highly variable sex differences across strains (Fig. 5A), whereas Uty expression is generally uniform across strains with elevated expression in males (Fig. 5C). Thus, the sex differences in Uty expression are not expected to drive sex differences in fat percentage (Fig. 5D). However, the sex differences in Xbp1 expression are negatively associated with the sex differences in fat percentage (Fig. 5E,F). Thus, an FCC is consistent with a functional relationship between the influence of sex on gene expression and the influence of sex on fat percentage. The underlying basis of the FCC is a genotype-by-sex interaction in which the influence of sex is genotype-dependent, as for sex-specific eQTLs observed in humans.
To establish the prevalence of FCC genes at a genome-wide scale and determine whether these genes were also differentially expressed between females and males, we identified the overlaps between FCC genes and differentially expressed genes (|fold change| > 5%, FDR < 0.05) (Fig. 5G). Our analysis revealed considerable overlaps (>50% of the FCC genes for each trait; P ≤ 1.1 × 10⁻¹⁴, hypergeometric test) (Fig. 5G). However, numerous FCC genes showed robust associations between sex differences in gene expression and metabolic traits without differential expression. This finding highlights the fact that FCCs can arise in cases where the sex differences in a phenotype effectively cancel, such that population-wide differential expression is absent (Fig. 5E).
Given that we identified sex-by-SNP interactions and sex-by-genotype interactions for the regulation of adipose tissue gene expression in human and mouse, respectively, we addressed whether there is an overlap between the genes identified for each species. Considering FCC genes for fat percentage, fat growth, and insulin resistance, we identified 4508 total FCC genes (Supplemental Table S10). Out of the 4508 FCC genes, 369 genes (8.2%) matched the human sex-specific eQTL genes (15.3% of the human sex-specific eQTL genes were identified). To further evaluate the functions associated with these genes, we performed an enrichment analysis. Our analysis revealed 79 distinct though overlapping functional annotations (FDR < 0.05, FET [Supplemental Table S11]). Consistent with our previous findings, we identified enrichments for oxidative phosphorylation (e.g., NDUFA3,10,11, SDHD, and COX6B1; 11 genes total, odds ratio = 4.5, FDR = 0.002), as well as adipogenesis (e.g., NCOR2, EGR2, NR3C1, FOXC2, and PPARGC1A; 11 genes total, odds ratio = 4.6, FDR = 0.014) (Fig. 4H). These results suggest that sex-by-genotype interactions regulate the expression of a conserved set of genes, implicated in oxidative phosphorylation and adipogenesis, in both mouse and human.
Genetic regulation predicts sex differences in expression and dynamic expression during adipogenesis
Our analyses suggest that sex differences in adipose tissue gene expression, and sex differences in the effects of genetic variants on expression, are related to oxidative phosphorylation and adipogenesis. To determine whether there are specific genes with both sex differences in expression and sex differences in associations with genetic variation, we determined the overlap between the 162 DEGs and the sex-specific eQTL genes. Our analysis revealed 13 genes (Fig. 6; Supplemental Figs. S9–S11; Supplemental Table S12). The SNP effect directionalities were congruent with the expression differences, consistent with genetic contributions to population-wide sex differences in gene expression.
Figure 6.

Sex-specific genetic regulation is associated with sex-biased gene expression. Six cases illustrate sex-specific eQTLs (P < 1 × 10⁻⁴) that overlap with differentially expressed genes (FDR <0.05). Note the congruence between the sex-specificities of gene expression and the corresponding sex-specificities of allelic effects. The results suggest that differential expression could be partially accounted for by differential genetic regulation at sex-specific eQTLs.
Because all of our analyses were undertaken using data from adipose tissues, it remains to be determined whether our observations were generated from sex differences specific to adipocytes. We evaluated the gene expression patterns in human and mouse adipocytes (Fig. 7; Supplemental Fig. S11) and performed a literature review (Table 2) to prioritize genes of interest. We focused on six genes: FADS1, MAP1B, HSPA12A, CLIC6, MMD, and PDZD2 (Figs. 6, 7; Supplemental Results). These genes were within the upper expression quartiles across all genes in mature human adipocytes, therefore demonstrating their robust expression (Fig. 7). Furthermore, these genes showed temporally dependent gene expression dynamics during human adipogenesis (FDR ≤2.7 × 10⁻⁴, likelihood ratio test [Fig. 7]). Of note, the murine data did not consistently match the human data (see Supplemental Results). Our results support conserved functional roles for FADS1 and MAP1B in adipogenesis. In particular, the finding of a prominent initial up-regulation of FADS1 following the application of a differentiation stimulus to pre-adipocytes supports a role for this enzyme in coordinating human adipogenesis.
Figure 7.
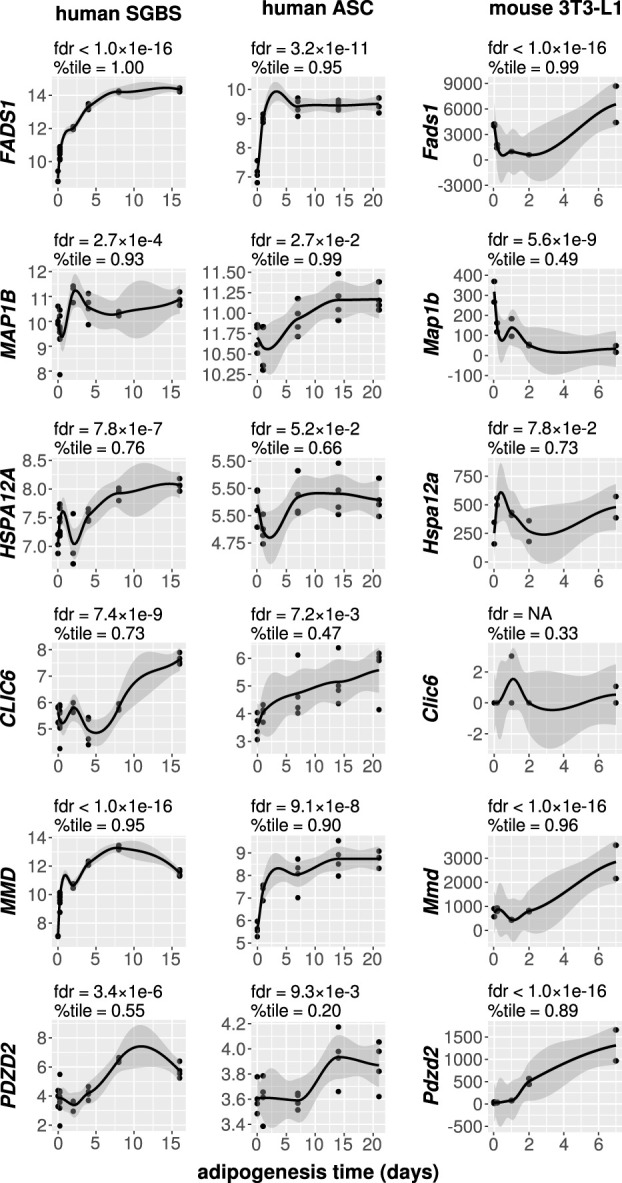
Sex-specific genetic regulation is associated with adipocyte differentiation. Adipogenesis time course gene expression data are shown for human cultured SGBS cells, human adipose-derived stromal cells (ASCs), and murine 3T3-L1 cells. For each time course profile, we performed a likelihood ratio test (LRT) to evaluate whether the gene in question changes dynamically during differentiation. The false discovery rates (fdrs) correspond to the LRTs. We also show the expression percentiles (%tile) for each gene, considering all expressed genes at the time point of terminal differentiation, thereby representing the relative degree of expression in mature adipocytes. All genes indicated show evidence for dynamic expression during human adipogenesis and a substantial degree of expression in human adipocytes. Smooth curves were generated using Loess regression, and associated 95% confidence intervals are shown in dark gray.
Table 2.

Discussion
We performed an expansive repertoire of focused analyses to improve our understanding of sex differences in human adipose tissue function. While the results of our unbiased omic-scale investigations confirmed previous findings, clinically relevant novel findings emerged. In particular, we identified FADS1, MAP1B, HSPA12A, CLIC6, MMD, and PDZD2 as genes with differential expression patterns and sex differences in genetic regulation. These genes were dynamically expressed during human adipogenesis. We discuss our findings in the context of the previous literature, and limitations of this work are described in the Supplemental Discussion. We conclude by discussing the implications of our work.
While analyses of individual studies generate hundreds to thousands of differentially expressed genes, we demonstrated that only 162 of these genes showed robust sex differences. Gene set enrichment analyses indicated that genes which were elevated in females were implicated in oxidative phosphorylation and adipogenesis. Complementary analyses supported an association between adipogenesis and sex-biased expression. There was a small degree of overlap between genes that were differentially expressed in human and mouse adipose tissues. This could be due to the fact that we compared available data from human subcutaneous adipose tissue and murine epididymal adipose tissue (Rosen and Spiegelman 2014). In general, it remains to be established whether particular cellular mechanisms, as well as specific depot/cell type–specific sex differences, are conserved in mice.
Consistent with our findings, sex differences associated with mitochondrial function and adipogenesis have been reported previously (Blouin et al. 2010; Keuper et al. 2019; see Supplemental Discussion). In general, the cellular basis for sex differences in adipose tissue oxidative phosphorylation-related gene expression remains to be established. Studies of mice in vivo are consistent with both sex differences in adipogenesis and a functional role of adipogenesis in the susceptibility to type 2 diabetes and metabolic syndrome (Wang et al. 2008; Jeffery et al. 2016). However, the extant literature regarding adipogenesis sex differences in humans is difficult to interpret due to variations in sampling, experimental procedures, and analysis methods. Our findings are consistent with sex differences in the expression levels and regulatory functions of genes implicated in adipogenesis.
Our study revealed sex-by-SNP interactions in human subcutaneous adipose tissue. We found that these associations could predominantly be categorized as either sex-specific effects (33%) or sex-specific directionalities (66%) (Khramtsova et al. 2019). Such eQTL interaction profiles have been observed previously in studies of sex and tissue differences (Fu et al. 2012; Yao et al. 2014). Consistent with the functional importance of adipose tissue sex-specific eQTLs, many of the eQTLs we identified overlapped GWAS SNPs associated with cardiometabolic traits and diseases. These results are consistent with previous findings indicating that adipose tissue eQTLs influence cardiometabolic disease susceptibility (Civelek et al. 2017). In line with the well-characterized associations between eQTL/GWAS SNPs and regulatory influences on transcription (Gaffney et al. 2012; Maurano et al. 2012; Brown et al. 2013a; Kilpinen et al. 2013; Pai et al. 2015; Deplancke et al. 2016), we observed that adipose tissue eQTL SNPs overlapped transcription factor binding motifs. In particular, we observed overlaps with motifs for adipogenic factors including EGR1 and PPARG. To investigate the mechanisms underlying sex-by-SNP interactions, we proposed mechanistic models to explain our results, similar to those proposed for tissue-specific eQTLs (Fu et al. 2012). In contrast to previous work (Fu et al. 2012), we incorporated transcription factor gene expression data and explicitly tested our model. Our analysis could explain some sex-specific eQTL effects by the differential expression and putative binding of transcription factors. However, transcription factor activity may contribute to gene regulation, in addition to factor expression (John et al. 2016). Further, transcription factors may regulate expression through altered binding in the vicinity of eQTL SNPs (Deplancke et al. 2016). Hence, further work will be required to elucidate the molecular mechanisms of sex-specific eQTLs.
Our heritability and sex-specific eQTL effect size data are consistent with previous results demonstrating an enhanced contribution of genetic variation to metabolic phenotypes in females, as compared to males (Pulit et al. 2017). According to the liability threshold model, the increased heritability of a disease-related trait is expected for the sex with lower prevalence for that trait (Khramtsova et al. 2019). It is not clear that males exhibit increased cardiometabolic disease prevalence, as was once thought (Humphries et al. 2017). One possibility is that the genetic regulation of adipose function is especially important in females, given the dependence of pregnancy outcomes and early development on maternal adipose tissue quantity and function (Straughen et al. 2013; Tyrrell et al. 2016; Shrestha et al. 2018; Pringle et al. 2019), along with the notion that factors influencing pregnancy outcomes are expected to be under selective pressure (Brown et al. 2013b). Our observation of increased genetic influences on adipose gene expression in females is consistent with studies showing increased female heritability for a plethora of traits (Gilks et al. 2014; Khramtsova et al. 2019). Further work will be required to understand the causes and consequences of elevated genetic influences on adipose function in females.
We found that sex-specific eQTL genes from human subcutaneous adipose tissue overlapped with genes regulated by sex-by-genotype interactions in murine epididymal adipose tissue. The correlation fold change method employed in mice showed enhanced sensitivity for detecting sex-by-genotype interactions, as compared to previous approaches involving QTL associations (Krohn et al. 2014). The genes identified in the associations for both species were significantly enriched for oxidative phosphorylation and adipogenesis pathways. Sex-specific eQTLs were recently described in mice (Norheim et al. 2019). Consistent with our findings, the murine sex-specific eQTLs were implicated in mitochondrial function (Norheim et al. 2019). These observations are especially interesting in the context of our finding that there was a low degree of overlap for differentially expressed genes from human and mouse. These results suggest that sex differences in the genetic architectures underlying adipogenesis and oxidative phosphorylation are conserved.
Our study showed that FADS1, MAP1B, HSPA12A, CLIC6, MMD, and PDZD2 exhibit differential expression patterns that could be potentially explained by sex differences in genetic regulation. A similar finding was obtained in a study of whole blood gene expression (Yao et al. 2014). Sex differences in the genetic architectures of gene expression have been associated with sex-biased gene expression (Khramtsova et al. 2019), and this association can occur as a result of evolutionary processes (Ober et al. 2008). A number of mechanisms exist whereby evolutionary processes can shape sex-specific genetic architectures for complex traits and diseases (Gilks et al. 2014; Grath and Parsch 2016).
Our results also showed that FADS1, MAP1B, HSPA12A, CLIC6, MMD, and PDZD2 exhibit dynamic expression during human adipogenesis and robust expression in mature human adipocytes. This is consistent with the possibility that the sex differences identified in our adipose tissue analyses were derived from sex differences in adipocytes. Few published studies have reported evidence for the functions of these genes in adipogenesis (see Table 2; Supplemental Discussion). Moreover, while there are reported roles for these genes in adipose tissue and/or adipocyte function, there is a relative dearth of information regarding sex differences in adipose tissue function. This study highlights opportunities for focused analyses to improve our understanding of how these genes contribute to adipocyte functions and sex differences therein.
Understanding the mechanistic basis for sex differences in adipose tissue gene expression could enhance efforts in precision medicine (Humphries et al. 2017; Segarra et al. 2017; Reusch et al. 2018). It has been established that leveraging human genetics data facilitates drug development (Fox 2019). Males have cardiometabolic disease risk profiles associated with deleterious fat distribution patterns (Fried et al. 2015), whereas females have elevated prevalence for obesity (Flegal et al. 2016). Furthermore, understanding sex differences in adipose function could have important implications for providing medical care to transgender individuals (Elbers et al. 1999). Independent of sex, previous studies have shown a decline in oxidative metabolism in adipocytes from obese individuals (Heinonen et al. 2017). Similarly, adipogenesis has been associated with cardiometabolic disease (Ghaben and Scherer 2019). In future studies, it will also be important to address sex-by-ethnicity and sex-by-age interactions underlying adipose function and cardiometabolic disease (Winham et al. 2015; Reusch et al. 2018). Likewise, defining how sex differences in adipocyte biology relate to anatomical differences in adipose function will improve our understanding of how systemic manipulations influence metabolism and physiology (Rosen and Spiegelman 2014). An increasing arsenal of experimental tools for culturing human adipocytes and adipose tissues will facilitate advances (Fitzgerald et al. 2018). Isolated adipocytes from large cohorts of males and females, as well as adipose-derived macrophages and vascular cells, will promote our understanding of the cellular basis for adipose tissue sex differences.
Methods
Our analyses were completed using R (R Core Team 2018) and the Unix command line. We routinely used BEDTools for operations on genomic coordinates (Quinlan and Hall 2010).
Gene expression analysis
For differential gene expression analyses, we considered (1) the African American Genetics of Metabolism and Expression cohort of African Americans from North Carolina, USA (117 females, 135 males; NCBI Gene Expression Omnibus (GEO; https://www.ncbi.nlm.nih.gov/geo/) accession number GSE95674 (Sharma et al. 2016), (2) the Genotype-Tissue Expression project with a multi-ethnic population from the USA (194 females, 387; data access: https://gtexportal.org/home/) (GTEx Consortium 2017), and (3) the Icelandic deCODE Genetics cohort (400 females, 295 males; GEO accession: GSE7965) (Table 1; Emilsson et al. 2008). We applied the Linear Models for Microarray Data (limma) analysis to evaluate differential gene expression between females and males (Ritchie et al. 2015). We focused on autosomal genes for our differential expression analyses. The gene expression fold changes were varied across cohorts (Supplemental Figs. S1, S6). As demonstrated in the Supplemental Results, normalization methods can contribute to such variation in fold change (Supplemental Fig. S2). We evaluated the statistical significance of the differentially expressed gene overlaps, identified from the three data sets, with an exact test for multiset intersections (Wang et al. 2015). For pairwise gene set overlap comparisons, we employed the hypergeometric test. We used the maximal number of expressed genes as the background population size, and we reported probabilities that the number of overlaps were greater than or equal to the observed overlaps. See Supplemental Methods for further details.
Functional enrichment analysis
We implemented functional enrichment analyses using Gene Set Enrichment Analysis (GSEA) and Enrichr (Subramanian et al. 2005; Kuleshov et al. 2016). For Enrichr analyses based on Fisher's exact test, we considered all genes in the human genome as a background set. We identified transcription factors implicated in regulating sex-biased gene expression using the Binding Analysis for Regulation of Transcription (Wang et al. 2018). See Supplemental Methods for further details.
Expression quantitative trait locus (eQTL) analysis
We performed eQTL analysis using Matrix eQTL (Shabalin 2012), with covariates identified using the Probabilistic Estimation of Expression Residuals (PEER) (Stegle et al. 2012) (Supplemental Fig. S3, S4). We identified variants in linkage disequilibrium using PLINK (Purcell et al. 2007). We evaluated the colocalization of eQTL and GWAS SNPs using the coloc R package (Giambartolomei et al. 2014). We used the Approximate Bayes Factor colocalization analysis to test the hypothesis that both the eQTL gene and GWAS trait shared a single causal variant. Following previous approaches, we considered a colocalization probability >0.8 to indicate significance. See Supplemental Methods for further details.
Heritability analysis
We determined the SNP-based narrow sense heritability (Visscher et al. 2008) associated with gene expression using GCTA (Yang et al. 2011), as described previously (Civelek et al. 2017). The analysis was performed separately for males and females from the GTEx cohort using subcutaneous adipose tissue gene expression data.
Transcription factor binding site analysis
To evaluate whether sex-specific eQTL SNPs overlapped with putative transcription factor binding sites, we overlapped these SNPs with sites within TF consensus motifs. We utilized the SNP2TFBS resource of estimated effects of SNPs on predicted TF binding, based on the conformity of motif alleles to the genome (Kumar et al. 2017). For this analysis, we considered SNPs in LD with sex-specific eQTL SNPs (r2 > 0.8). We considered the TF at each site for which the predicted effect on binding was largest, with respect to any other overlapping TFBSs, given the SNP genotype. We applied restrictive filtering criteria to the analysis enrichments of TFs overlapping eQTL SNPs in functional annotations (FDR < 0.01, more than 10 genes in each functional category), consistent with a high degree of confidence in the results of this analysis. For plotting motif signatures, we isolated position probability matrices corresponding to specific motifs using JASPAR 2018 core vertebrate files (Khan et al. 2018) downloaded from the MEME website (http://meme-suite.org/doc/download.html).
Assay for Transposase-Accessible Chromatin using sequencing analysis
We considered both pre-adipocyte and mature adipocyte data from the Simpson Golabi Behmel Syndrome cell line (Table 1; Cannon et al. 2019). We also evaluated human adipose tissue ATAC-seq data from three male donors (Cannon et al. 2019) and one female donor from ENCODE (https://www.encodeproject.org/experiments/ENCSR540BML/) (The ENCODE Project Consortium 2012). The adipose tissue data from male donors originated from the METSIM study (Cannon et al. 2019). The data from Cannon et al. (2019) were downloaded as files documenting the coordinates of open chromatin peaks. In contrast, the ENCODE data were acquired in the BAM file format and further processed to match the analysis from Cannon et al. (2019). For the ENCODE data, we identified peaks using MACS2 with the following settings: ‐‐nomodel -q 0.05 ‐‐shift -100 ‐‐extsize 200 (https://github.com/taoliu/MACS/) (Zhang et al. 2008). We merged overlapping peaks, removed blacklisted regions, and converted the data to the bigWig format for visualization using the UCSC Genome Browser (Lee et al. 2020). We merged the adipose tissue peak coordinates and merged replicates for the SGBS peak data sets. Following these steps, we considered sets of pre-adipocyte peaks, adipocyte peaks, and adipose tissue peaks. We further considered four sets of peaks for overlap with the sex-specific eQTL SNPs: pre-adipocyte peaks; adipocyte peaks; the intersection of all three peak sets; and the union of all three peak sets. For this analysis, we considered SNPs in LD with sex-specific eQTL SNPs (r2 > 0.8).
Analysis of sex-by-genotype interactions in mouse
We used the fold change correlation (FCC) method to establish genotype-by-sex interactions in mice (Santolini et al. 2018). We used epididymal adipose tissue gene expression data from 98 HMDP mouse strains (Table 1; Lusis et al. 2016). For our application of the FCC method, we related sex differences in gene expression to sex differences in metabolic phenotypes. To prioritize metabolic phenotypes for our analysis, we evaluated the phenotypic correlations across the mouse population and clustered the Pearson's correlation matrix. The analysis revealed three prominent clusters (Supplemental Fig. S5). This suggests that distinct groups of phenotypes covary such that cluster representatives can be used as proxies for the respective sets of cluster phenotypes. After inspecting the clusters, we elected to further examine body fat percentage, the percentage of body fat growth, and insulin resistance. The FCC method entails correlating gene expression fold changes with phenotypic fold changes, both with respect to sex. To mitigate against spurious correlations due to the presence of outliers, we computed the median-based biweight midcorrelation (bicor) coefficients for this analysis (Song et al. 2012). Both phenotype and gene expression data were approximately normally distributed, based on visual inspection of the corresponding distributions, and therefore were considered to be in the log space. The log2 fold change for a given strain was taken as the female value minus the male value for that strain (value refers to either gene expression level or phenotype measure). We obtained correlations between the log2 gene expression fold changes and the log2 phenotype fold changes.
Software availability
Further analysis details can be obtained through a publicly available repository of vignettes and associated scripts (https://github.com/WarrenDavidAnderson/manuscriptCode/tree/master/sexDifferencesAdipose_code). Code files are available in the Supplemental Material as Supplemental Code.
Competing interest statement
The authors declare no competing interests.
Supplementary Material
Acknowledgments
This work has been supported by an American Heart Association Postdoctoral Fellowship #18POST33990082 (W.D.A.), National Institutes of Health (NIH) T32 DK007646 (W.D.A.), NIH T32 HL007284 (W.D.A.), NIH/National Institute of Diabetes and Digestive and Kidney Diseases (NIDDK) R01 DK118287 (M.C.), American Diabetes Association 1-19-IBS-105 (M.C.), NIH/NIDDK R01 DK090111 (S.K.D.), and NIH/NIDDK R01 DK118243 (S.K.D. and M.C.). The authors thank the members of the Civelek laboratory, Ingrid Braenne, Yunxian Liu, and Sathyan Kizhakke Mattada for advice and discussion.
Author contributions: M.C. and W.D.A. conceived of the study and designed the research. W.D.A. implemented the research. J.Y.S., S.E.I., and A.D. contributed analyses or code. L.M., C.D.L., M.E.C., S.K.D., E.E.S., and J.L.M.B. contributed data and/or analysis. W.D.A. wrote the manuscript. W.D.A. and M.C. edited the manuscript.
Footnotes
[Supplemental material is available for this article.]
Article published online before print. Article, supplemental material, and publication date are at http://www.genome.org/cgi/doi/10.1101/gr.264614.120.
References
- Blouin K, Nadeau M, Perreault M, Veilleux A, Drolet R, Marceau P, Mailloux J, Luu-The V, Tchernof A. 2010. Effects of androgens on adipocyte differentiation and adipose tissue explant metabolism in men and women. Clin Endocrinol (Oxf) 72: 176–188. 10.1111/j.1365-2265.2009.03645.x [DOI] [PubMed] [Google Scholar]
- Brown CD, Mangravite LM, Engelhardt BE. 2013a. Integrative modeling of eQTLs and cis-regulatory elements suggests mechanisms underlying cell type specificity of eQTLs. PLoS Genet 9: e1003649 10.1371/journal.pgen.1003649 [DOI] [PMC free article] [PubMed] [Google Scholar]
- Brown EA, Ruvolo M, Sabeti PC. 2013b. Many ways to die, one way to arrive: how selection acts through pregnancy. Trends Genet 29: 585–592. 10.1016/j.tig.2013.03.001 [DOI] [PubMed] [Google Scholar]
- Buniello A, MacArthur JAL, Cerezo M, Harris LW, Hayhurst J, Malangone C, McMahon A, Morales J, Mountjoy E, Sollis E, et al. 2019. The NHGRI-EBI GWAS Catalog of published genome-wide association studies, targeted arrays and summary statistics 2019. Nucleic Acids Res 47: D1005–D1012. 10.1093/nar/gky1120 [DOI] [PMC free article] [PubMed] [Google Scholar]
- Cannon ME, Currin KW, Young KL, Perrin HJ, Vadlamudi S, Safi A, Song L, Wu Y, Wabitsch M, Laakso M, et al. 2019. Open chromatin profiling in adipose tissue marks genomic regions with functional roles in cardiometabolic traits. G3 (Bethesda) 9: 2521–2533. 10.1534/g3.119.400294 [DOI] [PMC free article] [PubMed] [Google Scholar]
- Civelek M, Wu Y, Pan C, Raulerson CK, Ko A, He A, Tilford C, Saleem NK, Stančáková A, Scott LJ, et al. 2017. Genetic regulation of adipose gene expression and cardio-metabolic traits. Am J Hum Genet 100: 428–443. 10.1016/j.ajhg.2017.01.027 [DOI] [PMC free article] [PubMed] [Google Scholar]
- Declèves AE, Sharma K. 2015. Obesity and kidney disease: differential effects of obesity on adipose tissue and kidney inflammation and fibrosis. Curr Opin Nephrol Hypertens 24: 28–36. 10.1097/MNH.0000000000000087 [DOI] [PMC free article] [PubMed] [Google Scholar]
- Deplancke B, Alpern D, Gardeux V. 2016. The genetics of transcription factor DNA binding variation. Cell 166: 538–554. 10.1016/j.cell.2016.07.012 [DOI] [PubMed] [Google Scholar]
- Elbers JM, Asscheman H, Seidell JC, Gooren LJ. 1999. Effects of sex steroid hormones on regional fat depots as assessed by magnetic resonance imaging in transsexuals. Am J Physiol 276: E317–E325. 10.1152/ajpendo.1999.276.2.E317 [DOI] [PubMed] [Google Scholar]
- Emdin CA, Khera AV, Natarajan P, Klarin D, Zekavat SM, Hsiao AJ, Kathiresan S. 2017. Genetic association of waist-to-hip ratio with cardiometabolic traits, type 2 diabetes, and coronary heart disease. JAMA 317: 626–634. 10.1001/jama.2016.21042 [DOI] [PMC free article] [PubMed] [Google Scholar]
- Emilsson V, Thorleifsson G, Zhang B, Leonardson AS, Zink F, Zhu J, Carlson S, Helgason A, Walters GB, Gunnarsdottir S, et al. 2008. Genetics of gene expression and its effect on disease. Nature 452: 423–428. 10.1038/nature06758 [DOI] [PubMed] [Google Scholar]
- The ENCODE Project Consortium. 2012. An integrated encyclopedia of DNA elements in the human genome. Nature 489: 57–74. 10.1038/nature11247 [DOI] [PMC free article] [PubMed] [Google Scholar]
- Exley MA, Hand L, O'Shea D, Lynch L. 2014. Interplay between the immune system and adipose tissue in obesity. J Endocrinol 223: R41–R48. 10.1530/JOE-13-0516 [DOI] [PubMed] [Google Scholar]
- Fitzgerald SJ, Janorkar AV, Barnes A, Maranon RO. 2018. A new approach to study the sex differences in adipose tissue. J Biomed Sci 25: 89 10.1186/s12929-018-0488-3 [DOI] [PMC free article] [PubMed] [Google Scholar]
- Flegal KM, Kruszon-Moran D, Carroll MD, Fryar CD, Ogden CL. 2016. Trends in obesity among adults in the United States, 2005 to 2014. JAMA 315: 2284–2291. 10.1001/jama.2016.6458 [DOI] [PMC free article] [PubMed] [Google Scholar]
- Fox CS. 2019. Using human genetics to drive drug discovery: a perspective. Am J Kidney Dis 74: 111–119. 10.1053/j.ajkd.2018.12.045 [DOI] [PubMed] [Google Scholar]
- Franzén O, Ermel R, Cohain A, Akers NK, Di Narzo A, Talukdar HA, Foroughi-Asl H, Giambartolomei C, Fullard JF, Sukhavasi K, et al. 2016. Cardiometabolic risk loci share downstream cis- and trans-gene regulation across tissues and diseases. Science 353: 827–830. 10.1126/science.aad6970 [DOI] [PMC free article] [PubMed] [Google Scholar]
- Fried SK, Lee MJ, Karastergiou K. 2015. Shaping fat distribution: new insights into the molecular determinants of depot- and sex-dependent adipose biology. Obesity (Silver Spring) 23: 1345–1352. 10.1002/oby.21133 [DOI] [PMC free article] [PubMed] [Google Scholar]
- Fu J, Wolfs MGM, Deelen P, Westra HJ, Fehrmann RSN, Te Meerman GJ, Buurman WA, Rensen SSM, Groen HJM, Weersma RK, et al. 2012. Unraveling the regulatory mechanisms underlying tissue-dependent genetic variation of gene expression. PLoS Genet 8: e1002431 10.1371/journal.pgen.1002431 [DOI] [PMC free article] [PubMed] [Google Scholar]
- Gaffney DJ, Veyrieras JB, Degner JF, Pique-Regi R, Pai AA, Crawford GE, Stephens M, Gilad Y, Pritchard JK. 2012. Dissecting the regulatory architecture of gene expression QTLs. Genome Biol 13: R7 10.1186/gb-2012-13-1-r7 [DOI] [PMC free article] [PubMed] [Google Scholar]
- Ghaben AL, Scherer PE. 2019. Adipogenesis and metabolic health. Nat Rev Mol Cell Biol 20: 242–258. 10.1038/s41580-018-0093-z [DOI] [PubMed] [Google Scholar]
- Giambartolomei C, Vukcevic D, Schadt EE, Franke L, Hingorani AD, Wallace C, Plagnol V. 2014. Bayesian test for colocalisation between pairs of genetic association studies using summary statistics. PLoS Genet 10: e1004383 10.1371/journal.pgen.1004383 [DOI] [PMC free article] [PubMed] [Google Scholar]
- Gilks WP, Abbott JK, Morrow EH. 2014. Sex differences in disease genetics: evidence, evolution, and detection. Trends Genet 30: 453–463. 10.1016/j.tig.2014.08.006 [DOI] [PubMed] [Google Scholar]
- Grath S, Parsch J. 2016. Sex-biased gene expression. Annu Rev Genet 50: 29–44. 10.1146/annurev-genet-120215-035429 [DOI] [PubMed] [Google Scholar]
- Greenawalt DM, Dobrin R, Chudin E, Hatoum IJ, Suver C, Beaulaurier J, Zhang B, Castro V, Zhu J, Sieberts SK, et al. 2011. A survey of the genetics of stomach, liver, and adipose gene expression from a morbidly obese cohort. Genome Res 21: 1008–1016. 10.1101/gr.112821.110 [DOI] [PMC free article] [PubMed] [Google Scholar]
- Grundy SM. 2015. Adipose tissue and metabolic syndrome: too much, too little or neither. Eur J Clin Invest 45: 1209–1217. 10.1111/eci.12519 [DOI] [PMC free article] [PubMed] [Google Scholar]
- GTEx Consortium. 2017. Genetic effects on gene expression across human tissues. Nature 550: 204–213. 10.1038/nature24277 [DOI] [PMC free article] [PubMed] [Google Scholar]
- Hasin-Brumshtein Y, Hormozdiari F, Martin L, van Nas A, Eskin E, Lusis AJ, Drake TA. 2014. Allele-specific expression and eQTL analysis in mouse adipose tissue. BMC Genomics 15: 471 10.1186/1471-2164-15-471 [DOI] [PMC free article] [PubMed] [Google Scholar]
- Heinonen S, Muniandy M, Buzkova J, Mardinoglu A, Rodríguez A, Frühbeck G, Hakkarainen A, Lundbom J, Lundbom N, Kaprio J, et al. 2017. Mitochondria-related transcriptional signature is downregulated in adipocytes in obesity: a study of young healthy MZ twins. Diabetologia 60: 169–181. 10.1007/s00125-016-4121-2 [DOI] [PubMed] [Google Scholar]
- Henriques T, Scruggs BS, Inouye MO, Muse GW, Williams LH, Burkholder AB, Lavender CA, Fargo DC, Adelman K. 2018. Widespread transcriptional pausing and elongation control at enhancers. Genes Dev 32: 26–41. 10.1101/gad.309351.117 [DOI] [PMC free article] [PubMed] [Google Scholar]
- Humphries K, Izadnegadar M, Sedlak T, Saw J, Johnston N, Schenck-Gustafsson K, Shah R, Regitz-Zagrosek V, Grewal J, Vaccarino V, et al. 2017. Sex differences in cardiovascular disease – impact on care and outcomes. Front Neuroendocrinol 46: 46–70. 10.1016/j.yfrne.2017.04.001 [DOI] [PMC free article] [PubMed] [Google Scholar]
- Jeffery E, Wing A, Holtrup B, Sebo Z, Kaplan JL, Saavedra-Peña R, Church CD, Colman L, Berry R, Rodeheffer MS. 2016. The adipose tissue microenvironment regulates depot-specific adipogenesis in obesity. Cell Metab 24: 142–150. 10.1016/j.cmet.2016.05.012 [DOI] [PMC free article] [PubMed] [Google Scholar]
- John K, Marino JS, Sanchez ER, Hinds TD. 2016. The glucocorticoid receptor: cause of or cure for obesity? Am J Physiol Endocrinol Metab 310: E249–E257. 10.1152/ajpendo.00478.2015 [DOI] [PMC free article] [PubMed] [Google Scholar]
- Karastergiou K, Smith SR, Greenberg AS, Fried SK. 2012. Sex differences in human adipose tissues - the biology of pear shape. Biol Sex Differ 3: 13 10.1186/2042-6410-3-13 [DOI] [PMC free article] [PubMed] [Google Scholar]
- Kautzky-Willer A, Harreiter J, Pacini G. 2016. Sex and gender differences in risk, pathophysiology and complications of Type 2 diabetes mellitus. Endocr Rev 37: 278–316. 10.1210/er.2015-1137 [DOI] [PMC free article] [PubMed] [Google Scholar]
- Keuper M, Berti L, Raedle B, Sachs S, Böhm A, Fritsche L, Fritsche A, Häring HU, Hrabě de Angelis M, Jastroch M, et al. 2019. Preadipocytes of obese humans display gender-specific bioenergetic responses to glucose and insulin. Mol Metab 20: 28–37. 10.1016/j.molmet.2018.11.006 [DOI] [PMC free article] [PubMed] [Google Scholar]
- Khan A, Fornes O, Stigliani A, Gheorghe M, Castro-Mondragon JA, van der Lee R, Bessy A, Chèneby J, Kulkarni SR, Tan G, et al. 2018. JASPAR 2018: update of the open-access database of transcription factor binding profiles and its web framework. Nucleic Acids Res 46: D1284 10.1093/nar/gkx1188 [DOI] [PMC free article] [PubMed] [Google Scholar]
- Khramtsova EA, Davis LK, Stranger BE. 2019. The role of sex in the genomics of human complex traits. Nat Rev Genet 20: 173–190. 10.1038/s41576-018-0083-1 [DOI] [PubMed] [Google Scholar]
- Kilpinen H, Waszak SM, Gschwind AR, Raghav SK, Witwicki RM, Orioli A, Migliavacca E, Wiederkehr M, Gutierrez-Arcelus M, Panousis NI, et al. 2013. Coordinated effects of sequence variation on DNA binding, chromatin structure, and transcription. Science 342: 744–747. 10.1126/science.1242463 [DOI] [PMC free article] [PubMed] [Google Scholar]
- Krohn J, Speed D, Palme R, Touma C, Mott R, Flint J. 2014. Genetic interactions with sex make a relatively small contribution to the heritability of complex traits in mice. PLoS One 9: e96450 10.1371/journal.pone.0096450 [DOI] [PMC free article] [PubMed] [Google Scholar]
- Kuleshov MV, Jones MR, Rouillard AD, Fernandez NF, Duan Q, Wang Z, Koplev S, Jenkins SL, Jagodnik KM, Lachmann A, et al. 2016. Enrichr: a comprehensive gene set enrichment analysis web server 2016 update. Nucleic Acids Res 44: W90–W97. 10.1093/nar/gkw377 [DOI] [PMC free article] [PubMed] [Google Scholar]
- Kumar S, Ambrosini G, Bucher P. 2017. SNP2TFBS – a database of regulatory SNPs affecting predicted transcription factor binding site affinity. Nucleic Acids Res 45: D139–D144. 10.1093/nar/gkw1064 [DOI] [PMC free article] [PubMed] [Google Scholar]
- Lee CM, Barber GP, Casper J, Clawson H, Diekhans M, Gonzalez JN, Hinrichs AS, Lee BT, Nassar LR, Powell CC, et al. 2020. UCSC Genome Browser enters 20th year. Nucleic Acids Res 48: D756–D761. 10.1093/nar/gkz1012 [DOI] [PMC free article] [PubMed] [Google Scholar]
- Lengyel E, Makowski L, DiGiovanni J, Kolonin MG. 2018. Cancer as a matter of fat: the crosstalk between adipose tissue and tumors. Trends Cancer 4: 374–384. 10.1016/j.trecan.2018.03.004 [DOI] [PMC free article] [PubMed] [Google Scholar]
- Liberzon A, Birger C, Thorvaldsdóttir H, Ghandi M, Mesirov JP, Tamayo P. 2015. The Molecular Signatures Database (MSigDB) hallmark gene set collection. Cell Syst 1: 417–425. 10.1016/j.cels.2015.12.004 [DOI] [PMC free article] [PubMed] [Google Scholar]
- Linder K, Arner P, Flores-Morales A, Tollet-Egnell P, Norstedt G. 2004. Differentially expressed genes in visceral or subcutaneous adipose tissue of obese men and women. J Lipid Res 45: 148–154. 10.1194/jlr.M300256-JLR200 [DOI] [PubMed] [Google Scholar]
- Luchsinger JA, Biggs ML, Kizer JR, Barzilay J, Fitzpatrick A, Newman A, Longstreth WT, Lopez O, Siscovick D, Kuller L. 2013. Adiposity and cognitive decline in the cardiovascular health study. Neuroepidemiology 40: 274–281. 10.1159/000345136 [DOI] [PMC free article] [PubMed] [Google Scholar]
- Lumish HS, O'Reilly M, Reilly MP. 2020. Sex differences in genomic drivers of adipose distribution and related cardiometabolic disorders: opportunities for precision medicine. Arterioscler Thromb Vasc Biol 40: 45–60. 10.1161/ATVBAHA.119.313154 [DOI] [PubMed] [Google Scholar]
- Lusis AJ, Seldin MM, Allayee H, Bennett BJ, Civelek M, Davis RC, Eskin E, Farber CR, Hui S, Mehrabian M, et al. 2016. The Hybrid Mouse Diversity Panel: a resource for systems genetics analyses of metabolic and cardiovascular traits. J Lipid Res 57: 925–942. 10.1194/jlr.R066944 [DOI] [PMC free article] [PubMed] [Google Scholar]
- Maurano MT, Humbert R, Rynes E, Thurman RE, Haugen E, Wang H, Reynolds AP, Sandstrom R, Qu H, Brody J, et al. 2012. Systematic localization of common disease-associated variation in regulatory DNA. Science 337: 1190–1195. 10.1126/science.1222794 [DOI] [PMC free article] [PubMed] [Google Scholar]
- Norheim F, Hasin-Brumshtein Y, Vergnes L, Chella Krishnan K, Pan C, Seldin MM, Hui ST, Mehrabian M, Zhou Z, Gupta S, et al. 2019. Gene-by-sex interactions in mitochondrial functions and cardio-metabolic traits. Cell Metab 29: 932–949.e4. 10.1016/j.cmet.2018.12.013 [DOI] [PMC free article] [PubMed] [Google Scholar]
- Ober C, Loisel DA, Gilad Y. 2008. Sex-specific genetic architecture of human disease. Nat Rev Genet 9: 911–922. 10.1038/nrg2415 [DOI] [PMC free article] [PubMed] [Google Scholar]
- Pai AA, Pritchard JK, Gilad Y. 2015. The genetic and mechanistic basis for variation in gene regulation. PLoS Genet 11: e1004857 10.1371/journal.pgen.1004857 [DOI] [PMC free article] [PubMed] [Google Scholar]
- Pringle KG, Lee YQ, Weatherall L, Keogh L, Diehm C, Roberts CT, Eades S, Brown A, Smith R, Lumbers ER, et al. 2019. Influence of maternal adiposity, preterm birth and birth weight centiles on early childhood obesity in an indigenous Australian pregnancy-through-to-early-childhood cohort study. J Dev Orig Health Dis 10: 39–47. 10.1017/S2040174418000302 [DOI] [PubMed] [Google Scholar]
- Pulit S, Karaderi T, Lindgren C. 2017. Sexual dimorphisms in genetic loci linked to body fat distribution. Biosci Rep 37 10.1042/BSR20160184 [DOI] [PMC free article] [PubMed] [Google Scholar]
- Purcell S, Neale B, Todd-Brown K, Thomas L, Ferreira MAR, Bender D, Maller J, Sklar P, de Bakker PIW, Daly MJ, et al. 2007. PLINK: a tool set for whole-genome association and population-based linkage analyses. Am J Hum Genet 81: 559–575. 10.1086/519795 [DOI] [PMC free article] [PubMed] [Google Scholar]
- Quinlan AR, Hall IM. 2010. BEDTools: a flexible suite of utilities for comparing genomic features. Bioinformatics 26: 841–842. 10.1093/bioinformatics/btq033 [DOI] [PMC free article] [PubMed] [Google Scholar]
- Rando OJ. 2012. Combinatorial complexity in chromatin structure and function: revisiting the histone code. Curr Opin Genet Dev 22: 148–155. 10.1016/j.gde.2012.02.013 [DOI] [PMC free article] [PubMed] [Google Scholar]
- R Core Team. 2018. R: a language and environment for statistical computing. R Foundation for Statistical Computing, Vienna: https://www.R-project.org/. [Google Scholar]
- Reusch JEB, Kumar TR, Regensteiner JG, Zeitler PS, Conference Participants. 2018. Identifying the critical gaps in research on sex differences in metabolism across the life span. Endocrinology 159: 9–19. 10.1210/en.2017-03019 [DOI] [PMC free article] [PubMed] [Google Scholar]
- Ritchie ME, Phipson B, Wu D, Hu Y, Law CW, Shi W, Smyth GK. 2015. limma powers differential expression analyses for RNA-sequencing and microarray studies. Nucleic Acids Res 43: e47 10.1093/nar/gkv007 [DOI] [PMC free article] [PubMed] [Google Scholar]
- Roadmap Epigenomics Consortium, Kundaje A, Meuleman W, Ernst J, Bilenky M, Yen A, Heravi-Moussavi A, Kheradpour P, Zhang Z, Wang J, et al. 2015. Integrative analysis of 111 reference human epigenomes. Nature 518: 317–330. 10.1038/nature14248 [DOI] [PMC free article] [PubMed] [Google Scholar]
- Rosen ED, Spiegelman BM. 2014. What we talk about when we talk about fat. Cell 156: 20–44. 10.1016/j.cell.2013.12.012 [DOI] [PMC free article] [PubMed] [Google Scholar]
- Santolini M, Romay MC, Yukhtman CL, Rau CD, Ren S, Saucerman JJ, Wang JJ, Weiss JN, Wang Y, Lusis AJ, et al. 2018. A personalized, multiomics approach identifies genes involved in cardiac hypertrophy and heart failure. NPJ systems biology and applications 4: 12 10.1038/s41540-018-0046-3 [DOI] [PMC free article] [PubMed] [Google Scholar]
- Segarra I, Modamio P, Fernández C, Mariño EL. 2017. Sex-divergent clinical outcomes and precision medicine: an important new role for institutional review boards and research ethics committees. Front Pharmacol 8 10.3389/fphar.2017.00488 [DOI] [PMC free article] [PubMed] [Google Scholar]
- Shabalin AA. 2012. Matrix eQTL: ultra fast eQTL analysis via large matrix operations. Bioinformatics 28: 1353–1358. 10.1093/bioinformatics/bts163 [DOI] [PMC free article] [PubMed] [Google Scholar]
- Sharma NK, Sajuthi SP, Chou JW, Calles-Escandon J, Demons J, Rogers S, Ma L, Palmer ND, McWilliams DR, Beal J, et al. 2016. Tissue-specific and genetic regulation of insulin sensitivity-associated transcripts in African Americans. J Clin Endocrinol Metab 101: 1455–1468. 10.1210/jc.2015-3336 [DOI] [PMC free article] [PubMed] [Google Scholar]
- Shrestha D, Rahman ML, Workalemahu T, Zhu C, Tekola-Ayele F. 2018. Influence of fetal and maternal genetic susceptibility to obesity on birthweight in African ancestry populations. Front Genet 9: 511 10.3389/fgene.2018.00511 [DOI] [PMC free article] [PubMed] [Google Scholar]
- Shungin D, Winkler TW, Croteau-Chonka DC, Ferreira T, Locke AE, Mägi R, Strawbridge RJ, Pers TH, Fischer K, Justice AE, et al. 2015. New genetic loci link adipose and insulin biology to body fat distribution. Nature 518: 187–196. 10.1038/nature14132 [DOI] [PMC free article] [PubMed] [Google Scholar]
- Small KS, Todorčević M, Civelek M, El-Sayed Moustafa JS, Wang X, Simon MM, Fernandez-Tajes J, Mahajan A, Horikoshi M, Hugill A, et al. 2018. Regulatory variants at KLF14 influence type 2 diabetes risk via a female-specific effect on adipocyte size and body composition. Nat Genet 50: 572–580. 10.1038/s41588-018-0088-x [DOI] [PMC free article] [PubMed] [Google Scholar]
- Song L, Langfelder P, Horvath S. 2012. Comparison of co-expression measures: mutual information, correlation, and model based indices. BMC Bioinformatics 13: 328 10.1186/1471-2105-13-328 [DOI] [PMC free article] [PubMed] [Google Scholar]
- Stegle O, Parts L, Piipari M, Winn J, Durbin R. 2012. Using probabilistic estimation of expression residuals (PEER) to obtain increased power and interpretability of gene expression analyses. Nat Protoc 7: 500–507. 10.1038/nprot.2011.457 [DOI] [PMC free article] [PubMed] [Google Scholar]
- Straughen JK, Trudeau S, Misra VK. 2013. Changes in adipose tissue distribution during pregnancy in overweight and obese compared with normal weight women. Nutr Diabetes 3: e84 10.1038/nutd.2013.25 [DOI] [PMC free article] [PubMed] [Google Scholar]
- Subramanian A, Tamayo P, Mootha VK, Mukherjee S, Ebert BL, Gillette MA, Paulovich A, Pomeroy SL, Golub TR, Lander ES, et al. 2005. Gene set enrichment analysis: a knowledge-based approach for interpreting genome-wide expression profiles. Proc Natl Acad Sci 102: 15545–15550. 10.1073/pnas.0506580102 [DOI] [PMC free article] [PubMed] [Google Scholar]
- Tyrrell J, Richmond RC, Palmer TM, Feenstra B, Rangarajan J, Metrustry S, Cavadino A, Paternoster L, Armstrong LL, De Silva NMG, et al. 2016. Genetic evidence for causal relationships between maternal obesity-related traits and birth weight. JAMA 315: 1129–1140. 10.1001/jama.2016.1975 [DOI] [PMC free article] [PubMed] [Google Scholar]
- Visscher PM, Hill WG, Wray NR. 2008. Heritability in the genomics era—concepts and misconceptions. Nat Rev Genets 9: 255–266. 10.1038/nrg2322 [DOI] [PubMed] [Google Scholar]
- Wang MY, Grayburn P, Chen S, Ravazzola M, Orci L, Unger RH. 2008. Adipogenic capacity and the susceptibility to type 2 diabetes and metabolic syndrome. Proc Natl Acad Sci 105: 6139–6144. 10.1073/pnas.0801981105 [DOI] [PMC free article] [PubMed] [Google Scholar]
- Wang M, Zhao Y, Zhang B. 2015. Efficient test and visualization of multi-set intersections. Sci Rep 5: 16923 10.1038/srep16923 [DOI] [PMC free article] [PubMed] [Google Scholar]
- Wang Z, Civelek M, Miller CL, Sheffield NC, Guertin MJ, Zang C. 2018. BART: a transcription factor prediction tool with query gene sets or epigenomic profiles. Bioinformatics 34: 2867–2869. 10.1093/bioinformatics/bty194 [DOI] [PMC free article] [PubMed] [Google Scholar]
- Winham SJ, de Andrade M, Miller VM. 2015. Genetics of cardiovascular disease: importance of sex and ethnicity. Atherosclerosis 241: 219–228. 10.1016/j.atherosclerosis.2015.03.021 [DOI] [PMC free article] [PubMed] [Google Scholar]
- Yang J, Lee SH, Goddard ME, Visscher PM. 2011. GCTA: a tool for genome-wide complex trait analysis. Am J Hum Genet 88: 76–82. 10.1016/j.ajhg.2010.11.011 [DOI] [PMC free article] [PubMed] [Google Scholar]
- Yao C, Joehanes R, Johnson AD, Huan T, Esko T, Ying S, Freedman JE, Murabito J, Lunetta KL, Metspalu A, et al. 2014. Sex- and age-interacting eQTLs in human complex diseases. Hum Mol Genet 23: 1947–1956. 10.1093/hmg/ddt582 [DOI] [PMC free article] [PubMed] [Google Scholar]
- Zhang Y, Liu T, Meyer CA, Eeckhoute J, Johnson DS, Bernstein BE, Nusbaum C, Myers RM, Brown M, Li W, et al. 2008. Model-based Analysis of ChIP-Seq (MACS). Genome Biol 9: R137 10.1186/gb-2008-9-9-r137 [DOI] [PMC free article] [PubMed] [Google Scholar]
- Zore T, Palafox M, Reue K. 2018. Sex differences in obesity, lipid metabolism, and inflammation—a role for the sex chromosomes? Mol Metab 15: 35–44. 10.1016/j.molmet.2018.04.003 [DOI] [PMC free article] [PubMed] [Google Scholar]
Associated Data
This section collects any data citations, data availability statements, or supplementary materials included in this article.